REVIEW: Photoelectrochemical Cycle of Bacteriorhodopsin
I. V. Kalaidzidis, A. D. Kaulen, A. N. Radionov, and L. V. Khitrina*
Belozersky Institute of Physico-Chemical Biology, Lomonosov Moscow State University, Moscow, 119899 Russia; fax: (095) 939-3181; E-mail: innak@phtbio.genebee.msu.su, radionov_a@mail.ru, khitr@phtbio.genebee.msu.su* To whom correspondence should be addressed.
Received May 10, 2001; Revision received August 9, 2001
The scheme of the bacteriorhodopsin photocycle associated with a transmembrane proton transfer and electrogenesis is considered. The role of conformational changes in the polypeptide chain during the proton transport is discussed.
KEY WORDS: bacteriorhodopsin, purple membranes, chromophore, electrogenesis, proton transport, proton transport groups, photocycle, intermediates L, M, N, O
Bacteriorhodopsin, a membrane chromoprotein from Halobacterium salinarum (halobium), was first described in 1971 by Oesterhelt and Stoeckenius [1, 2]; its structural, spectral, and photochemical properties were characterized. The pigment was shown to be located in the cytoplasmic membrane of the bacterium, where it forms purple membranes, oval regions ~0.5-1 µm in diameter and ~45 Å in thickness which contain a single 26-kD polypeptide (75% of dry weight) and specific lipids. The purple membrane has a specific hexagonal crystalline structure, with triads of bacteriorhodopsin molecules at its nodes [1, 2]. Each molecule consists of seven strands 35-40 Å in length directed transversely in the membrane [3]. The chromophore of the pigment is a Schiff base formed by retinal and the epsilon-amino group of Lys216, and this determines the characteristic purple color of bacteriorhodopsin membranes [1, 4]. The wide absorption band has maximum at ~568-570 nm for the light-adapted form of the pigment when the retinal residue is in the all-trans form and at ~558-560 nm after dark adaptation when the chromophore is partially converted to the 13-cis form.
By 1973, bacteriorhodopsin was shown to be a light-driven proton pump [5, 6]. The translocation of a charged particle, H+, generates electric potential on the membrane, this phenomenon being directly measured for the first time in the case of bacteriorhodopsin [7].
Absorption of a light quantum by the bacteriorhodopsin molecule induces a sequence of spectral changes, or the so-called photochemical cycle. The photocycle of the all-trans form of bacteriorhodopsin is closed, unlike the cycle of 13-cis bacteriorhodopsin [8]. The exposure induces the conversion of the latter to the all-trans state. This process is called light adaptation [1, 8, 9]. The first schemes of the photocycle were based on data of low temperature spectrophotometry [5, 10-13] or on measurements with substances which strongly decreased the rate of the cycle, e.g., in 4 M aqueous solution of NaCl saturated with diethyl ether [6, 13] or in 2 M guanidine hydrochloride at pH ~ 9 [14]. The proton release was thought to be associated with the generation of a short-wavelength intermediate with the differential maximum strongly depending on the experiment conditions. The lambdamax value in guanidine hydrochloride was 405 nm. German researchers (B. Hess, D. Kushmitz, D. Oesterhelt) proposed at the X International Congress on Biochemistry (Hamburg, 1976) the following scheme for the ether-decelerated cycle of bacteriorhodopsin:
Key intermediates of the cycle were independently and virtually synchronously found and investigated in several laboratories [10-13, 15, 16]. The first scheme with a complete and correct set of all of the main intermediates and of their sequence appeared in 1975 [17]:

This scheme was much like the unclosed photocycle of the visual rhodopsin. Afterwards, it was found [18] that the proton was released concurrently with the Schiff base deprotonation during the L-->M transition. Surprisingly, the form with the maximum at 405 nm was not detected in the bacteriorhodopsin cycle, and for a long time it was thought to be an artifact at the effect of decelerating agents on bacteriorhodopsin. The authors acknowledged another peculiarity of the scheme proposed: it did not permit a description of the photocycle kinetics in the reasonable temperature range at different wavelengths with the linearization of rate constants of the individual intermediates in the Arrhenius coordinates [19]. On the assumption that after the light absorption all other reactions of the cycle are first-order dark transformations, the exponent sum required for the description should coincide with the number of transitions. If it is not so, it means that either the scheme is not quite correct or incompletely characterizes the process, thus, the reversibility, branching, or parallel cycles can significantly contribute to it. During many years there was no shortage in various schemes, both with branching of the main path and with parallel cycles [11, 13, 19-30]. No doubt that the initial nonidentity of molecules entering the photocycle varied (the simplest case is represented by titration of the protein groups affecting the cycle rate). Naturally, high intensity of the exciting light can induce concurrent phototransformations in two or three molecules in the triad, and they can hinder one another. This effect is displayed by different transition rates depending on the molecule number in the triad which are synchronously changing being light-induced [31]. However, the required number of correct rate constants could not be obtained either at low light intensities or in the monomeric state. The photocycle reversibility including the N intermediate was indisputably shown in 1989 by Lozier et al. [32] that participated in the determination of the main cycle intermediates [17] and in the revealing of kinetic problems associated with the description of the cycle [19]. Later the reversibility was carefully studied in different groups [23, 33, 34].
![]()
Various schemes of the photocycle are widely discussed in the literature. The mathematical modeling often prevents the clear bordering between them. For many years, the main purpose of the group of A. D. Kaulen was to search for effects providing a qualitative choice among the models. A significant part of this work was summarized by A. D. Kaulen in 2000 [35]. Unfortunately, destiny left him too small time to consider all problems in detail. This article is an attempt to make up for this unfortunate situation.
PROTON TRANSLOCATION AND ELECTROGENESIS
To interface probable schemes of the photoelectrochemical cycle of bacteriorhodopsin with experimental data, it is important to take into account the existence of varied measurements (kinetics of optical changes, kinetics of proton release into the environment and of its absorption, the electrogenesis) and to compare with the known spatial distribution of the chromophore and probable proton transport groups in the membrane. Each transition in the photocycle must be related to the electrical component and to the normal projection to the membrane of the presumed charge paths between these groups.
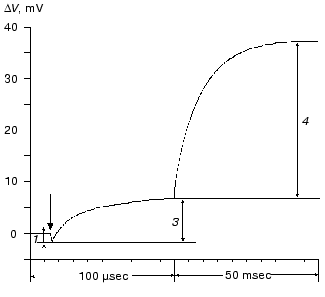
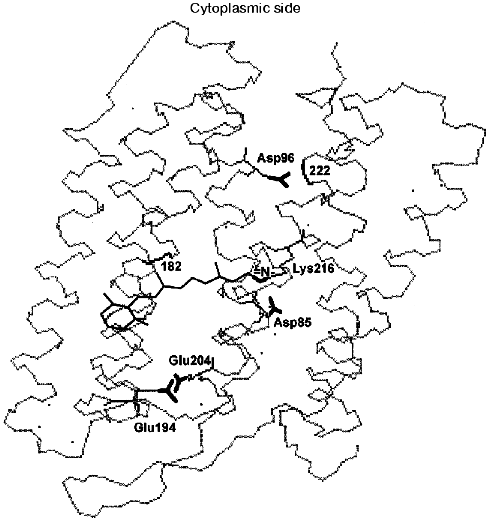
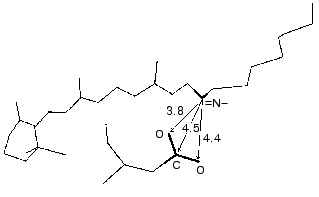
During the bacteriorhodopsin photocycle, the electric potential difference generation on the coupling membrane is caused by the transmembrane translocation of a charged particle, H+. Movements of any charged group normal to the membrane plane also contribute to the electrogenesis kinetics. A representative electrical response of light-adapted bacteriorhodopsin induced by a green laser light flash [36-42] is shown in Fig. 1. The H+ movement through the insulating membrane layer is similar to the charge translocation between facings of a condenser. In this case, the water-covered membrane surface plays the role of conducting plates of the condenser. At fixed dielectric constant (epsilon), the potential difference on the membrane (DeltaV) is directly proportional to the proton movement distance component normal to the membrane (r): DeltaV ~ kr/epsilon. It is difficult to expect epsilon to be absolutely the same in different regions of the purple membrane. However, in the absence of reliable data on epsilon changes along the membrane thickness, it is more reasonable to relate the longer paths of the charge to greater changes in the DeltaV. And to do this, it is preferable to maximally use the known distances between the presumed proton transport groups. An accurate determination of distances between individual amino acid residues and the aqueous phase and the normal projection of these distances to the membrane plane is a special problem. Computer models of the three-dimensional structure of the bacteriorhodopsin molecule fail to describe the location of water boundaries. However, Table 1 of distances between the presumed proton transport groups is useful, especially because these groups are placed transversely in the membrane (Fig. 2) and the distances between them (as a first approximation) allow us to assess their normal component. In Table 1, the distances are determined for carbons of carboxy groups because the proton is actually located between two oxygen atoms of the carboxy group. Figure 3 shows for example the distances between the Schiff base nitrogen and different atoms of the carboxy group of Asp85, and this allows us to see errors associated with the use of carbon atoms. In the structures obtained recently in different laboratories, the distance values were found to be rather similar (Table 1).
Table 1. Distances between proton transport groups in the main state of bacteriorhodopsin determined with the Skeleton programFig. 1. Characteristic electric photoresponse of light-adapted bacteriorhodopsin (phases 1, 3, and 4 of the photoresponse are discussed in the text). The purple membranes are associated with a collodion film impregnated with lecithin solution in decane (70 mg/ml) [37-40]. Here and further the laser flash moment (lambda = 532 nm, t1/2 = 15 nsec, the green pulse energy 50 mJ) is shown by a single arrow. The incubation medium: 100 mM NaCl, 5 mM Mes, 3 mM citrate (pH 6.0).
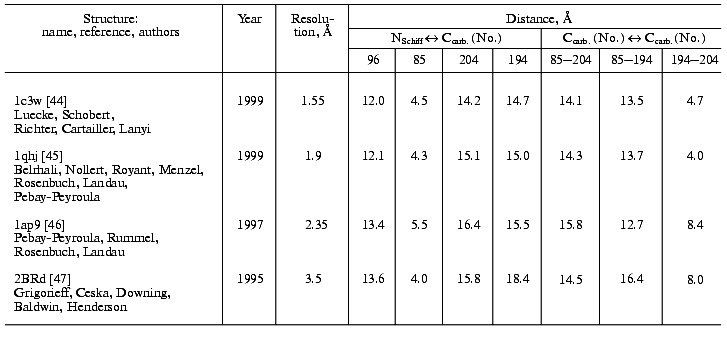
Fig. 2. Location of the Schiff base and of carboxy groups, whose involvement in the proton chain transfer is widely discussed, is shown. The locations of peptide bonds of residues 182 and 222 are also shown; according to data of the Henderson's group [43], here are fractures of the columns F and G associated with their displacement at opening of the gap. The structure is visualized by the 1c3w file [44] using the Skeleton program.
At pH 6 the fast negative phase 1 (Fig. 1) is 2-5% of the full amplitude of the positive component of the bacteriorhodopsin electric response measured by voltage. The rate of phase 1 is not resolved by the device (<100 nsec [42]) and is faster than the K-->L transition. The bacteriorhodopsin transition from the initial state to intermediate K is associated with Schiff base displacement due to the 6-s-trans,all-trans,15-anti --> 6-s-trans,13-cis,15-anti isomerization of the chromophore [43, 45, 48-55]. The characteristic time and the presumed displacement of the charged protonated group =NH+- suggests the correspondence of this shift to the negative phase recorded [35, 38, 39, 42]. The inverse 13-cis- --> all-trans-isomerization occurs during the N-->O transition [49, 51, 56]. In the dark-adapted bacteriorhodopsin the 13-cis-component is present in the 6-s-trans,13-cis,15-syn-form [54, 57-59].Fig. 3. A fragment of the molecule presented in Fig. 2. The chromophore and Asp85 are shown, the distances (Å) are given between the Schiff base nitrogen and of the carboxy group carbon and oxygen atoms.
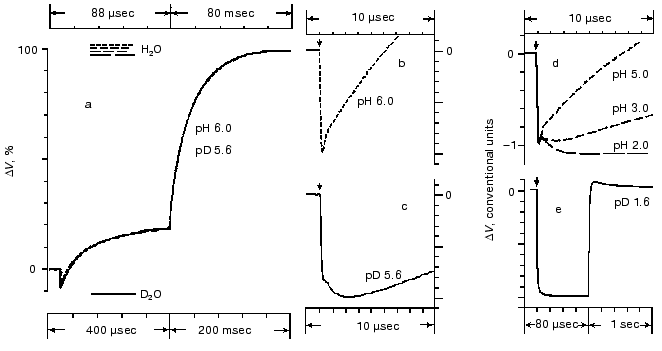
Phase 2 of the photoelectric response is also negative [42, 60, 61]. Its amplitude is very small (Fig. 4 [42]) and its kinetics are very much like the spectral K-->L transition [42, 60]. This phase can be detected on the background of the increasing microsecond phase either by computerized analysis of the experimental curve, or in medium with D2O where the deceleration of the microsecond positive phase is more pronounced, or at decreased pH until the generation of the blue acidic form (Fig. 4) which completely lacks the positive microsecond and millisecond phases [35, 37-39]. If the thickness of the hydrophobic insulating layer of the purple membrane is 40-45 Å [2, 3] and epsilon is homogenous, a 0.4 Å displacement of the unit charge normally to the surface is sufficient to produce a measurable amplitude. This could be either due to the movement of the positively charged group towards the cytoplasmic surface or due to the inversely directed movement of the negatively charged group (e.g., the deprotonated carboxy group of Asp85 should be displaced from the Schiff base). The hypothesis of such a shift of Asp85 has been discussed earlier [23]. The formation of the M is preceded by a decrease in the extraordinary high pK value (~12.5-13) of the Schiff base and by an increase in pK of Asp85 [62-67] that makes possible the proton transfer between these groups. The change in pK is a result of changes in the environment of the groups caused by their relocations, movements of other charged or polarizable amino acid residues, and of water molecules. Similar changes in the environment of Asp85 were found for the L intermediate [62, 66, 67].
Amplitudes of the positive microsecond and millisecond phases differ about fourfold (Fig. 1). A decreased ratio of the phases can be easily obtained by decreasing the resistance of the measuring membrane or by decelerating the processes associated with the M-->BR relaxation [39-41]. By the rate, the microsecond phase can be associated only with the H+ releasing during its movement from the Schiff base to the external surface of the membrane (Fig. 2). Moreover, conformational dislocations of charged groups can also contribute. The hypothesis on the homogeneity of epsilon and the ratio of electrogenesis amplitudes suggest that the proton path normal to the membrane should be fourfold longer during the millisecond phase than during the preceding one. Because the Schiff base is located roughly in the middle of the membrane, it is reasonable to suggest that part of the millisecond phase should be also associated with the charge dislocations “inside the half-channel of proton release” already after the appearance of H+ in the aqueous medium. This is supported by times of the proton residence on the groups involved in the transport and by measurements on point mutants that will be discussed in the following sections.Fig. 4. Comparison of the photoelectric response rates of purple membranes in ordinary water (H2O, the dotted line) and in heavy water (D2O, the solid line) which was used for the preliminary reprecipitation of bacteriorhodopsin and for the preparation of incubation media (100 mM NaCl, 5 mM Mes, 3 mM sodium citrate; pH and pD were adjusted with HCl and DCl, respectively). For other conditions see Fig. 1 and “Supplement”. The response amplitudes are normalized and presented in % (a) or in conventional units (b-e).
PROTON TRANSPORT PATH: WATER --> SCHIFF BASE
Asp96 seems to be the only amino acid residue on the membrane cytoplasmic side suitable for a transfer in the proton transport chain along the proton path from water to the Schiff base. The involvement of this residue in the H+ transfer is beyond doubt. In addition to the structural findings, this has been supported by experiments with point mutants at this amino acid residue, by the azide-induced acceleration of the D96N mutant intermediate M relaxation, and by finding of the Asp96 carboxy group protonation in the main state and of the absence of the proton in its intermediate N ([68] and also reviews [35, 51, 62, 69]). The involvement of water molecules in the organization of the H+ transport chain from the cytoplasmic side is discussed in the literature. However, in the whole bacteriorhodopsin structure (1c3w, Table 1) 23 H2O molecules per polypeptide chain have been found, and only six of them are located between the cytoplasmic surface and the Schiff base. Moreover, they fail to form an uninterrupted chain.
In 1992, V. P. Skulachev published an alternative hypothesis [70-72] that was confirmed by our experiments and by findings of other groups. He supposed a similarity to visual rhodopsin. At the late stages of phototransformations of this chromoprotein, a hollow appears in the molecule that is a cavity open into water and providing for an interaction with transducin due to entrance of part of the latter. During the M-->BR recovery in bacteriorhodopsin, a water-reached gap also opens that promotes the proton overcoming large hydrophobic regions during the Schiff base protonation from the cytoplasmic side. This hypothesis was based on data on conformational changes during the photocycle of bacteriorhodopsin. Changes in the light dispersion of the purple membrane suspension during the photocycle (during the M formation, M-->N transition, and the bacteriorhodopsin relaxation into the initial state) were first found in our laboratory [73-75]. Dencher et al. [76] analyzed neutron diffraction and were the first to directly show the existence of significant light-induced conformational changes. Afterwards, conformational changes were additionally shown by Varo and Lanyi in their studies on the effect of an increased hydrostatic pressure on the photocycle [77]. In 1993, the displacement of the alpha-helical column was directly shown using electron diffraction [78]. At present, it is established that the gap is generated as a result of displacements of the F and G columns [43]. In the intermediate M the F and G column displacements from their initial positions near the cytoplasmic surface are ~3.5 and ~2 Å, respectively [43]. The authors present the view from above (from the cytoplasmic side) of the bacteriorhodopsin structure with the gap and in the state closed by van der Waals atom radii that allows visual assessment of the cavity generated and the provision of the path for water molecules from the surface to Asp96 [43]. For the intermediate N of the F219L mutant an ~3 Å displacement of the F column is shown [79]. Subramaniam and Henderson [43, 80] purposely consider errors of other scientists in their unsuccessful attempts to show changes in the F-column position during the photocycle. First, the dehydration of a preparation with glucose inhibits the shift. Second, in the point mutants at Asp96 the protein conformation is changed, the state with the gap exists for a long time, but a classic early M412 without the gap is not produced in full measure, therefore, no great difference can be seen between the initial and displaced positions of the F-column.
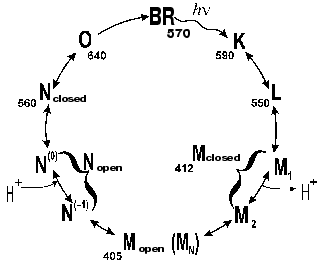
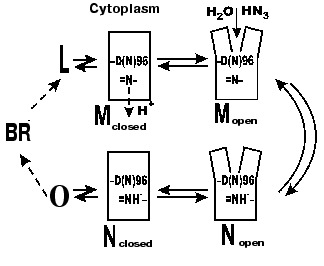
According to our data [35, 81-85], there are several forms of the intermediate M. At first, the well-known M form appears with the maximum at 412 nm, which we have called closed (Figs. 5 and 6). Then, due to displacement of the columns, an entrance channel opens from the aqueous medium to the Schiff base. This is the open M form (Figs. 5 and 6) with the maximum at 405 nm. To judge by the acceleration of relaxation of the intermediate M of the mutant D96N bacteriorhodopsin induced by various proton donors, this channel is very narrow and is appropriate for a chain of water molecules, while molecules with greater diameter than that of azide enter this channel with difficulty (even hydroxylamine is significantly less effective). The scheme (Fig. 5) shows the equilibrium between two M forms, the forms with the closed and open states of the proton entrance channel (MC and MO, respectively). Water molecules enter this channel and decrease the pK of Asp96, thus making it a good proton donor. The entrance of water molecules results in an immediate deprotonation of Asp96 and in the proton translocation onto the Schiff base (i.e., to the generation of N). We suggest that the equilibrium concentration of the MO in the wild type BR photocycle should be very low and determine the rate of the M-->N transition.
Fig. 5. A scheme of the all-trans bacteriorhodopsin photocycle (see [35, 86]).
If the generation of the open form is the limiting stage in the M relaxation, the gap seems to be imbedded into the membrane deeper than the Asp96 location and to promote the H+ translocation from the carboxyl to the Schiff base. Otherwise it is difficult to explain the reaction rate observed because the distance between Asp96 and the Schiff base is ~12 Å (Table 1) and the surrounding amino acid residues are rather hydrophobic. According to data of Subramaniam and Henderson [43] (and Fig. 2), this really occurs. The gap opens approximately to the level of Asp96 by the G-column and nearer to the membrane center by the F-column.Fig. 6. A scheme of the supposed opening of the cytoplasmic semichannel for H+ transport.
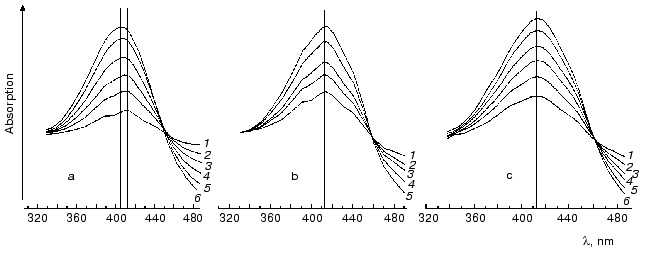
Under ordinary conditions, the lifetime of the MO form (M405) is short [81, 85], and the equilibrium in the reaction MC<-->MO<-->N is strongly shifted to the MC. We compared the effect of azide [81] on degradation of the intermediates M of the wild type BR and of the D96N mutant (both pretreated with inhibitors of M degradation), and the rate of the equilibrium establishment between MC and MO was ~100 µsec in both cases. Thus, the MO form is not recorded under ordinary conditions (the aqueous suspension of purple membranes, neutral pH values, room temperature). The point mutant D96N has the M405 form generated but the latter relaxes extremely slowly because the Schiff base protonation is impeded. The comparison of differential spectra of the M taken at varied time intervals after the exciting light flash shows that during the intermediate M formation the maximum of the D96N mutant spectrum is gradually displaced from 412 to 404 nm (Fig. 7, [83, 87-89]). Such a displacement is absent during the formation of the intermediate M of the wild type BR, and the maximum is at 412 nm.
It is reasonable to suggest that MO should be stabilized at sufficiently high value of the environmental pH (i.e., higher than pK of the Schiff base in the state N). Indeed, by IR spectroscopy the intermediate MN of the D96N mutant was found, and the protein structure of this intermediate was similar to that of the intermediate N but with the deprotonated Schiff base [90, 91] and is likely to correspond to the M open state. A similar intermediate was also described at high pH values in the presence of guanidine hydrochloride and for the wild type bacteriorhodopsin [92]. By our data, in the purple membranes of ET1001 the absorption maximum of the differential spectrum of the intermediate M accumulated under conditions favorable for the MN generation (6 M guanidine hydrochloride (pH 9.6)) is located at 405-406 nm, although immediately after the light flash this maximum is recorded at 412 nm. At pH 11.3 in the absence of guanidine hydrochloride the intermediate M maximum is recorded at 412 nm 0.1 msec after the flash. Several milliseconds later the maximum is 5-6 nm shifted towards the shorter waves, and this shift is similar to the absorption maximum shift of the intermediate M of the D96N mutant during the MN (MO) formation. However, in the wild type bacteriorhodopsin this shift goes, first, more slowly and is comparable to the M-->N transition (t1/2 ~ 2 msec) and, second, only at alkaline values of pH higher than the pK of the Schiff base in the intermediates with the deprotonated Asp96 (~10.8 in 1 M NaCl). We suggested that the intermediate MN (MO) with the open water-filled proton entrance channel should be found only at high values of pH when both the Schiff base and Asp96 are deprotonated. This supports our hypothesis about the closed state of the proton entrance channel in the M at the lower pH values.Fig. 7. Differential spectra of the intermediate M for light-adapted purple membranes of the D96N (a, c) and ET1001 (b) strains recorded after the exciting laser flash (lambda = 532 nm, t1/2 = 15 nsec, the energy in the green light pulse is 10 mJ) [85]; a, b) without inhibitors; c) in the presence of 5 mM LuCl3. Time after the flash for the spectra: a) 0.05 (1), 0.11 (2), 0.2 (3), 0.4 (4), 1 (5), 11 msec (6); b) 0.08 (1), 0.11 (2), 0.2 (3), 0.38 (4), 0.7 msec (5); c) 0.05 (1), 0.11 (2), 0.21 (3), 0.4 (4), 1 (5), 11 msec (6); the spectra 6a, 5b, and 6c were recorded at the differential maximums of the intermediates M. The medium: 10 mM Hepes (pH 7), 20°C.
The slowing down of the M relaxation under different conditions was caused by difficulties during the formation or degradation just of the M405 form. M decay inhibitors of the wild type bacteriorhodopsin (glutaric dialdehyde, lutetium ions, glycerol) fail to affect the spectrum of M of the wild type bacteriorhodopsin [83]. In the case of the D96N mutant, these agents not only strongly inhibit the intermediate M degradation in the presence of azide but also prevent the short-wavelength shift of its differential spectrum. These agents are concluded to affect the equilibrium between the MC and MO forms, displacing it towards the MC.
It follows from the data presented above that the MO spectrum has a short-wavelength shift compared to the MC spectrum, and the existence of M405 has been qualitatively shown in a number of experiments.
The rate decay of intermediate M depends on the exciting light intensity [31, 93, 94]. This dependence is the most pronounced at alkaline pH values [95, 96]. The more molecules in the trimer are executing cyclic transformations, the slower is this process. Consequently, bacteriorhodopsin molecules in the trimer are interacting with each other. This interaction can be caused by conformational changes in the protein during the M-->N transition.
The transition into the N state occurs from the open M state (MO) as a result of the proton transfer from Asp96 onto the Schiff base of the wild type bacteriorhodopsin or from a protonated azide molecule which can penetrate this channel. Based on the photocycle schemes (Figs. 5 and 6) describing the channel formation from the cytoplasmic surface of the protein during the MC --> MO transition, we suggested [86] that the next intermediate N should also be a mixture of two states, the open and closed ones. And inhibitors decreasing the equilibrium concentration of the open N form should accelerate its degradation if the chromophore can be reisomerized only from the closed N form. In the presence of 1 M sodium azide, the D96N mutant virtually does not produce the intermediate M in response to the light flash. This is because the rate of the M degradation at this azide concentration is greater than the rate of formation of this intermediate [85-87]. Certainly, the accelerated decay of intermediate N of D96N can be recorded only at high concentrations of azide when the M degradation is not the limiting stage of the whole cycle.
Aluminum salts and glycerol slow down the decay of intermediate M and accelerate the decay of N, stabilizing the closed states of these intermediates. Note, that aluminum ions induce a clear (~10 nm) shift to longer wavelengths of the differential spectrum maximum of the D96N mutant N intermediate but fail to affect the maximum position of the initial bacteriorhodopsin. Thus, the absorption spectrum of the open form of the intermediate N is also shifted to shorter wavelengths compared to the spectrum of the closed form, similarly to the spectrum of the open form of the intermediate M (M405) which is shifted relative to its closed form (M412) [86].
The existence of the open N form is directly supported by displacement of the F column found in intermediate N [79] that is possible only with an opened gap.
The photocycle scheme (Fig. 5) allows us to explain the acceleration of the intermediate N degradation by inhibitors of decay of intermediate M by taking into account that the open and closed forms of both intermediates are in equilibrium, that retinal can be reisomerized only in the closed form of the intermediate N, and the inhibitors accelerate the transition to this form. This model also presents a sufficient explanation of the literature data on the concurrent and differently directed changes in the M and N intermediate degradation rates with changes in the hydrostatic pressure, in the intensity of the exciting light, and in some mutants.
“SEMICHANNEL”: SCHIFF BASE --> EXTERNAL
MEMBRANE SURFACE
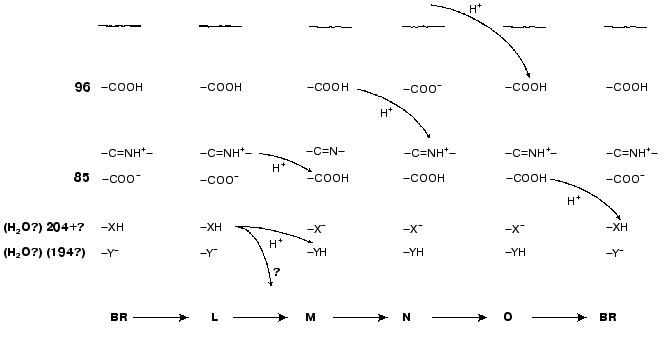
Asp85 is long known to be a proton acceptor for the Schiff base [23, 35, 51, 69, 97]. During the L-->M transition, the nitrogen of this residue is deprotonated and the carboxy group is protonated that contributes to the microsecond part of the electrogenesis (Fig. 1, phase 3). The proton release from Asp85 is recorded during the stage O-->BR [64, 66, 97, 98]. By the lifetimes of the O intermediate and by possible distances of the proton translocation between Asp85 and any of supposed acceptors (Glu204, Glu194, a water molecule between these amino acid residues) (Table 1), this process partially corresponds to the millisecond phase 4 of the photoelectric response (Fig. 1). The involvement of Glu204 [99] and Glu194 [100] in the proton transport path has been shown earlier. In the point mutant E204Q the microsecond phase 3 of the electric response is decreased twofold, i.e., the transfer of H+ from =NH+- onto Asp85 is about half of the fast (microsecond) electrogenic part of the H+ releasing path [101]. Thus, Glu204 is required for the proton transfer during phase 3 (Fig. 8, [101]). However, according to pH titration, Glu204 is not the terminal group in the proton transport path because the pH dependence of the decrease in the microsecond phase amplitude in the alkaline region (similar for ET1001 and E204Q) fails to agree either with the protonation of Asp85 or with the pH dependence of the H+ release into the environmental medium [101]. We have also observed a similar decrease in the microsecond phase amplitude for the E194Q mutant. The involvement of Arg82 in the proton transport path is also under discussion [66, 102]. Based on our data, it is suggested that Asp85 --> Glu204 --> Glu194 should be a terminal part of the H+ translocation, but this does not exclude the probability involvement of some other groups, e.g., of Arg82, in the formation of hydrogen bonds in the proton transport path. Based on their studies including the recording of FTIR spectral series, Dioumaev et al. [103] came to a similar conclusion for the wild type bacteriorhodopsin. In this case, in the scheme (Fig. 8) X is Glu204 and Y is Glu194. The groups X and Y are not terminal. During the H+ translocation between them during the L-->M transition the proton enters water from another group whose kinetics are not recorded in the electric response.
However, by FTIR spectroscopy data of German authors [68, 104], Glu204 and Glu194 are not deprotonated during the L-->M transition. In such case, the so-called proton-releasing complex consisting of the interacting groups Glu204, Glu194, and Arg82 can be involved in the H+ transfer during this stage [35, 51, 63, 69]. We think it is unlikely that this complex is terminal. More likely, a water molecule stabilized by these three groups and located between them is immediately involved in the transport (see structure 1c3w [44]). In this case, in the scheme (Fig. 8) X is the proton-releasing complex or the water molecule. However, the H+ entry into water directly from XH must not be ruled out. The question of group Y and on its involvement in the cycle is not yet clear. One hypothesis [104] suggests proton transfer through several water molecules or through other hydrogen bonds.Fig. 8. A scheme of supposed intraprotein proton translocations during the photoelectrochemical cycle. The H+ movement is shown only for electrogenic stages.
The present work considers the scheme of the all-trans bacteriorhodopsin photocycle, the scheme of the intraprotein proton translocation during this photoelectrochemical cycle, and open and closed forms of the M and N intermediates. The proton transport in the region of Asp85 --> external membrane surface is the most difficult problem which needs further studies.
We are grateful to Ya. L. Kalaidzidis for his elaborations: the program of visualization and processing of files of three-dimensional protein structures in the PDB-format Skeleton and the program language Pluk; to N. V. Khitrin for help in the technical preparation of the manuscript; and also to S. P. Balashov for his careful analysis of the manuscript that motivated the appearance of the “Supplement”.
The work was supported in part by the Russian Foundation for Basic Research (project No. 00-04-48588).
Supplement
Here we supplement the article with discussion of the exponential concept of the electric signals. To approximate experimental curves with exponentials, the program by Provencher [105] was used. The program does automatic multiexponential fitting by a modified Gauss-Newton least squares method to maximize a posteriori probability. This algorithm minimizes the experimenter's subjectivism in the choice of the number of exponentials. The program gives two best variants and their probabilities. However, the real abilities of the program version we have are limited. First, it chooses not more than five exponential components for the curve approximation. Although there are also five main time-resolvable transitions (K-->L, L-->M, M-->N, N-->O, O-->BR), the number of exponential components in these processes is significantly higher than was shown in the 1970s (see introductory section). Such a situation is caused by the transition reversibility, by the existence of substates of the main intermediates, by the deceleration of the cycle completion along with concurrent transformations of more than one molecule of bacteriorhodopsin in the triad, and by heterogeneity of the preparation. The latter can be determined by different protonation of the surface groups [106] and by defects in the crystal lattice. As is common for microbiological preparations, the size and shape of the purple membranes depend on the growth conditions. Bacteriorhodopsin molecules on the purple membrane edges seem to be in a different environment and have somewhat different kinetic constants. In any case, ultrasonic fragmentation of the purple membranes results in a significant increase in the contribution of the minor component to the degradation kinetics of the intermediate M (Table 2). Individual molecules are irreversibly discolored under the influence of the exciting light [107] and also provide disorders in the regular structure. Second, in the case of the one-to-three order of magnitude difference in the tau values, the accuracy of calculation of fast components is insufficient, even when a logarithmic time scale is used. Third, the program is good with an exact zero level of the curve. The zero can be chosen automatically, but this significantly decreases the tau values. The multi-exponentional curve can be analyzed by parts, either starting from its tail to recognize slow components, subtracting them from initial data, and operating by this algorithm; or (in the case of significant difference in the kinetic constants) the fast part can be analyzed separately. In the latter case, the search for zero can be performed in the program in itself, or the curve tail can be approximated using a certain averaged component which has little in common with the kinetic constants. On subtraction, small errors in values of slow components will result in a significant inaccuracy of fast components. In any case, the processing by parts decreases the value of the Provencher's algorithm. Note, that Provencher's algorithm is not always correct in determination of the number of exponents due to presence of accidental non-Gaussian ejections on the experimental curve. Approximating the same experimental curve with varied number of exponentials, it is easy to obtain markedly different tau values. Thus, the number of signal components recognizable in a real situation is rather arbitrary. Even in relatively simple cases when a series of the same type curves is processed, the program can find more exponents for the more smoothed or successful curves.
Table 2. Sonication-induced changes in
relaxation times of the M intermediate in suspension of the
light-adapted purple membranes of the ET1001 strain
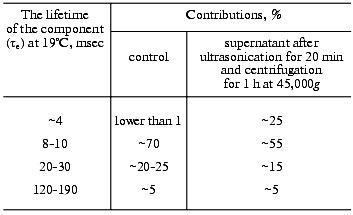
Note: The photocycle is induced by a laser light flash (lambda =
532 nm, t1/2 = 15 nsec, the energy of
the green light is 15 mJ), measurements at 412 nm. The
incubation medium is shown in Fig. 1.
All the above-listed difficulties of the mathematical analysis apply also to studies on the electrogenesis of bacteriorhodopsin in both current and voltage measurements. Analysis of optical curves is easier because at the corresponding wavelength each transition has a predominant contribution. The same components have different contributions at different wavelengths, and this can be used as an internal control. The recording of electrogenesis gives uniform curves. In this case, the choice of the exponent number significantly depends on the author's standpoint. In particular, the linear temperature dependence of rate constants in Arrhenius coordinates can be used as a control. Table 3 presents the minimal number of the electric response components fitting this test. The phase numbering corresponds to Fig. 1, and they are significantly different in the isotope effect. The deceleration (1.2 ± 0.25 times) of the second phase in D2O is questionable. In Fig. 4a the time scales for responses in H2O and in D2O are different, they are selected by the maximal graphical coincidence of the third and fourth phases of these experimental signals obtained under different conditions. The difference in the scales of response in ordinary and heavy waters, which is 4.55- and 2.5-fold for the microsecond and millisecond phases, respectively (for phases 3 and 4, respectively, in Fig. 1) is a measure of the isotope effect. Due to significant difference in the isotope effect, the deceleration of the third positive phase in D2O, unlike the second negative phase, allows us to clearly recognize the latter in heavy water at pH ~ 6, and this is obvious on comparison of Figs. 4b and 4c. In both H2O and D2O a decrease in pH results in the transition of the neutral purple form to the acidic blue form which lacks the positive third and fourth phases of the electric response (Fig. 4e [37, 41]). A decrease in pH resulting in a decrease in the microsecond phase amplitude also reveals the second negative phase in H2O (Fig. 4d).
Table 3. Parameters of the electric response
of the light-adapted purple membranes of the 353-P strain associated
with collodion film impregnated with a lecithin solution in decane [38, 39, 42]

Note: The photoeffect was induced by a laser light flash
(lambda = 532 nm, t1/2 =
15 nsec). The incubation medium is shown in Fig. 1. Sign (+) means that the phase direction coincides
with the response to constant light.
*For responses of low amplitudes [38, 39].
The phase 2 is not directly connected with the proton translocation between the groups; therefore, its isotope effect is low. In D2O the deceleration of positive phases determined just by the proton transport is clearly displayed. The isotope effect of phase 3 where the proton overcomes the lower distances (Figs. 8 and 9) is nearly twofold greater than for phase 4. For the latter phase the kinetics were determined not only by the rate of the proton movement but also by great conformational changes required for the transport and responsible for the transition into the open and then again into the closed form.
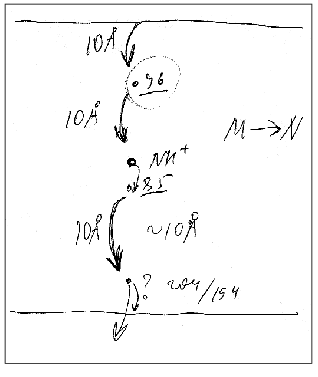
Figure 9 presents a manuscript sketch by Andrey Kaulen of our interpretation of amplitudes and phases of the electric signals. The proton is transferred over three sections of ~10 Å (Fig. 9) during phase 4 (Fig. 1) and over two other sections during phase 3. Correspondingly, the millisecond phase includes three transitions: M-->N-->O-->BR. Of course the distances in Fig. 9 are given approximately. The Schiff base is located roughly in the middle of the membrane thickness and Asp96 is in the middle of the path between the cytoplasmic surface and the Schiff base. If the thickness of the membrane isolating layer is ~40 Å, for each transition from the cytoplasmic side corresponds to ~10 Å. By the structures of 1999 (Table 1), the distance from the Schiff base nitrogen to the carboxyl carbon is 12 Å. The direction of this segment is nearly normal to the membrane, but the projection can be a little shorter. In any case, these estimations are close. By Table 1, the distances between Asp85 and Glu204/Glu194 corresponding to the O-->BR phase in the wild type are in the range of 13-14 Å. This is somewhat higher than 10 Å, but the segment direction is also not quite normal to the membrane. The distances between the Schiff base nitrogen and atoms of the carboxy group of Asp85 are ~ 4 Å (Fig. 3). The proton transfer on this section corresponds to a part of the microsecond phase of the signal. The geometric distance at the translocation moment is not precisely known because the structure of intermediate L is somewhat different due to isomerization and structural changes. But these differences are not great [35, 51]. At the non-operating second section of the microsecond phase (in the E204Q mutant [101] or at high pH value [108]) the signal is twofold decreased. Consequently, this section can also be referred to ~4 Å. Thus, the distances of ~8 and 30-33 Å correspond to the microsecond and millisecond phases, respectively. At uniform epsilon the result is in good agreement with the phase ratio of 1 to 4.
Phase 3 includes two transfer sections, and it cannot be approximated by less than two exponentional components (Table 3). The result is quite expectable, but the division of the proton transport path is likely to be not the only reason for the presence of the two components. The situation for phase 4 is different: it looks like a monoexponential phase although it corresponds to three transitions. However, A. M. Shkrob has shown (unfortunately, it is unpublished) that, if activation energies of the components are not different, their average value can be also linearized in Arrhenius coordinates. An incomplete coincidence of tau from electrical and spectral determinations is suggested to be due to recognition of an insufficient number of components in the mathematical analysis. However, there are also other causes, e.g., incomplete comparability of associated preparations with their aqueous suspension. First, the association with a measuring film results in the appearance of a closed volume between the bacteriorhodopsin-containing membrane and the lipid layer, and the open purple membranes form vesicles. This delays the response under the influence of its own electric field that is especially noticeable for the millisecond phase at high light flash intensity; this is the so-called locking [38, 39]. This effect always occurs also for proteoliposomes or for whole cells in aqueous suspension. Second, the ultrasonication for 1-2 min of the purple membrane association has been required so far. The incorporation of control membranes of the ET1001 strain (Table 2) by this technique with a subsequent multicomponent analysis of the millisecond phase of the photopotential revealed a 10-15% contribution of the 4-msec component and a prevalence of the ~23-msec component. Although in this case the fragmented membrane fraction is not great, it is not clear precisely what component of the suspension is associated with the plane lipid film. Third, there is a certain diffusion of decane and/or lipid into the purple membranes after the association [42, 109] that can result in slight (~1.5-fold) changes in the kinetic constants.Fig. 9. A manuscript sketch by Andrey Kaulen of a new interpretation of amplitudes and phases of the electric signals.
Our experience of many years has shown that even on comparison of only optical data the lower than 1.5-fold difference in the tau values is significant only in the same series of experiments when the same bacteriorhodopsin preparation and identical mathematical approaches are used. We often recorded 1.5-fold differences in the main component of the intermediate M relaxation in the purple membranes from various wild type strains (e.g., ET1001 and 353-P or R1, Tables 2 and 4), especially grown in different laboratories. Preparations of the purple membranes grown in different series from the 353-P biomass kindly presented in 1977-1980 by L. N. Chekulaeva were significantly different in the cooperative effect (our data unpublished).
Table 4. Photocycle parameters in suspension
of the light-adapted purple membranes of the 353-P strain [38, 39, 42]
analyzed to be compared to Table 3
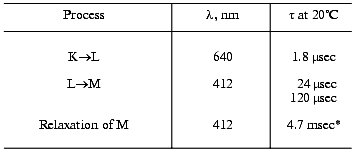
*For responses of small amplitude (the intensity of the
exciting laser flash was decreased).
L. A. Drachev, who started studies on bacteriorhodopsin electrogenesis together with A. D. Kaulen, is now working in the USA. Recently he and coauthors have succeeded in finding a plant lecithin that allows the sonication of the purple membrane to be avoided before their association with the lipid film [110]. One of our immediate goals is to study the electrogenesis in such a system to elucidate the kinetic contributions of each of the three transitions to the generation of the millisecond phase of the photopotential.
REFERENCES
1.Oesterhelt, D., and Stoeckenius, W. (1971)
Nature New Biol., 233, 149-152.
2.Blaurock, A., and Stoeckenius, W. (1971) Nature
New Biol., 233, 152-156.
3.Henderson, R., and Unwin, P. N. T. (1975)
Nature, 257, 28-32.
4.Ovchinnikov, Yu. A., Abdulaev, N. G., Feigina, M.
Yu., Kiselev, A. V., Lobanov, N. A., and Nazimov, I. V. (1978)
Bioorg. Khim., 4, 1573-1574.
5.Oesterhelt, D., and Stoeckenius, W. (1973) Proc.
Natl. Acad. Sci. USA, 70, 2853-2857.
6.Oesterhelt, D., and Hess, B. (1973) Eur. J.
Biochem., 37, 316-326.
7.Drachev, L. A., Kaulen, A. D., Ostroumov, S. A.,
and Skulachev, V. P. (1974) FEBS Lett., 39, 33-35.
8.Dencher, N. A., Rafferty, C. N., and Sperling, W.
(1976) Ber. Kernforsch. Julich, 1374, 1-42.
9.Ohno, K., Takeuchi, Y., and Yoshida, M. (1977)
Biochim. Biophys. Acta, 462, 575-582.
10.Litvin, F. F., Balashov, S. P., and Sineshchekov,
V. L. (1975) Bioorg. Khim., 1, 1767-1776.
11.Balashov, S. P., and Litvin, F. F. (1985)
Photochemical Transformations of Bacteriorhodopsin [in Russian],
MGU Publishers, Moscow.
12.Vsevolodov, N. N., and Kayushin, L. P. (1976)
Stud. Biophys. (Berlin), 59, 81-87.
13.Stoeckenius, W., Lozier, R. H., and Bogomolni, R.
A. (1979) Biochim. Biophys. Acta, 505, 215-278.
14.Pettei, M. J., Yudd, A., Nakanishi, K.,
Henselman, R., and Stoeckenius, W. (1977) Biochemistry,
16, 1955-1959.
15.Dencher, N. A., and Wilms, M. (1975) Biophys.
Struct. Mechanism, 1, 259-271.
16.Kung, M. C., DeVault, D., Hess, B., and
Oesterhelt, D. (1975) Biophys. J., 15, 907-911.
17.Lozier, R. H., Bogomolni, R. A., and Stoeckenius,
W. (1975) Biophys. J., 15, 955-962.
18.Drachev, L. A., Kaulen, A. D., and Skulachev, V.
P. (1984) FEBS Lett., 178, 331-335.
19.Lozier, R. H., and Niederberger, W. (1977)
Fed. Proc., 36, 1805-1809.
20.Korenstein, R., Sherman, W. V., and Caplan, S. R.
(1976) Biophys. Struct. Mechanism, 2, 267-276.
21.Korenstein, R., and Hess, B. (1978) FEBS
Lett., 93, 266-270.
22.Marcus, M. A., and Lewis, A. (1978)
Biochemistry, 17, 4722-4734.
23.Lanyi, J. K. (1993) Biochim. Biophys.
Acta, 1183, 241-261.
24.Drachev, L. A., Kaulen, A. D., and Komrakov, A.
Yu. (1994) Biochemistry (Moscow), 59, 126-136
(Russ.).
25.Komrakov, A. Yu., and Kaulen, A. D. (1994)
FEBS Lett., 340, 207-210.
26.Vsevolodov, N. N., and Chekulaeva, L. N. (1978)
Biofizika, 23, 1019-1033.
27.Shkrob, A. M., and Rodionov, A. V. (1978)
Bioorg. Khim.,4, 500-513.
28.Balashov, S. P., and Litvin, F. F. (1981)
Biofizika, 26, 557-570.
29.Mantele, W., Siebert, F., and Kreutz, W. (1981)
FEBS Lett., 128, 254-259.
30.Lanyi, J. K., and Varo, G. (1995) Isr. J.
Chem.,35, 365-385.
31.Radionov, A. N., and Kaulen, A. D. (1995) FEBS
Lett., 377, 330-332.
32.Chernavskii, D. S., Chizhov, I. V., Lozier, R.
H., Murina, T. M., Prokhorov, A. M., and Zubov, B. V. (1989)
Photochem. Photobiol., 49, 649-653.
33.Chizhov, I., Chernavskii, D. S., Engelhard, M.,
Mueller, K.-H., Zubov, B. V., and Hess, B. (1996) Biophys. J.,
71,2329-2345.
34.Varo, G., Duschl, A., and Lanyi, J. K. (1990)
Biochemistry, 29, 3798-3804.
35.Kaulen, A. D. (2000) Biochim. Biophys.
Acta, 1460, 204-219.
36.Drachev, L. A., Kaulen, A. D., and Skulachev, V.
P. (1978) FEBS Lett., 87, 161-167.
37.Drachev, L. A., Kaulen, A. D., Skulachev, V. P.,
Khitrina, L. V., and Chekulaeva, L. N. (1981) Biokhimiya,
46, 897-903.
38.Drachev, L. A., Kaulen, A. D., Skulachev, V. P.,
Khitrina, L. V., and Chekulaeva, L. N. (1981) Biokhimiya,
46, 998-1004.
39.Drachev, L. A., Kaulen, A. D., Khitrina, L. V.,
and Skulachev, V. P. (1981) Eur. J. Biochem., 117,
461-470.
40.Khitrina, L. V., Drachev, L. A., Kaulen, A. D.,
and Chekulaeva, L. N. (1982) Biochemistry, 47,
1763-1772.
41.Drachev, A. L., Drachev, L. A., Kaulen, A. D.,
and Khitrina, L. V. (1984) Eur. J. Biochem., 138,
349-356.
42.Skulachev, V. P., Drachev, L. A., Kaulen, A. D.,
Khitrina, L. V., Zorina, V. V., and Danshina, S. V. (1987) Proc.
Int. Conf. Retinal Proteins (Ovchinnikov, Yu. A., ed.) VNU Science
Press, Utrecht, The Netherlands, pp. 531-552.
43.Subramaniam, S., and Henderson, R. (2000)
Nature, 406, 653-657.
44.Luecke, H., Schobert, B., Richter, H.-T.,
Cartailler, J., and Lanyi, J. K. (1999) J. Mol. Biol.,
291, 899-911.
45.Belrhali, H., Nollert, P., Royant, A., Menzel,
C., Rosenbuch, J. P., Landau, E. M., and Pebay-Peyroula, E. (1999)
Structure (London), 7, 909-917.
46.Pebay-Peyroula, E., Rummel, G., Rosenbuch, J. P.,
and Landau, E. M. (1997) Science, 277, 1676-1681.
47.Grigorieff, N., Ceska, T. A., Downing, K. H.,
Baldwin, J. M., and Henderson, R. (1996) J. Mol. Biol.,
259, 393-421.
48.Kochendoerfer, G. G., and Mathies, R. A. (1995)
Isr. J. Chem., 35, 211-226.
49.Mathies, R. A., Lin, S. W., Ames, J. B., and
Pollard, W. T. (1991) Ann. Rev. Biophys. Biophys. Chem.,
20, 491-518.
50.Edman, K., Nollert, P., Royant, A., Belrhali, H.,
Pebay-Peyroula, E., Hajdu, J., Neutze, R., and Landau, E. M. (1999)
Nature, 401, 822-826.
51.Luecke, H. (2000) Biochim. Biophys. Acta,
1460, 133-156.
52.Harbison, G. S., Smith, S. O., Pardoen, J. A.,
Courtin, J. M. L., Lugtenburg, J., Herzfeld, J., Mathies, R. A., and
Griffin, R. G. (1985) Biochemistry, 24, 6955-6962.
53.Lugtenburg, J., Muradin-Szweykowska, M.,
Heermans, C., Pardoen, J. A., Harbison, G. S., Herzfeld, J., Smith, S.
O., Griffin, R. G., Smith, S. O., and Mathies, R. A. (1986) J. Am.
Chem. Soc., 108, 3104-3105.
54.Harbison, G. S., Smith, S. O., Pardoen, J. A.,
Winkel, C., Lugtenburg, J., Herzfeld, J., Matheis, R., and Griffin, R.
G. (1984) Proc. Natl. Acad. Sci. USA, 81, 1706-1709.
55.Van der Steen, R., Biessheuvel, P. L., Matheis,
R. A., and Lugtenburg, J. (1986) J. Am. Chem. Soc., 108,
6410-6411.
56.Hu, J. G., Griffin, R. G., and Herzfeld, J.
(1997) J. Am. Chem. Soc., 199, 9495-9498.
57.Seltzer, S. (1992) J. Am. Chem. Soc.,
114, 3516-3520.
58.Seltzer, S. (1994) J. Am. Chem. Soc.,
116, 9383-9384.
59.Seltzer, S. (1987) J. Am. Chem. Soc.,
109, 1627-1631.
60.Ormos, P., Reinisch, L., and Kesztheyi, L. (1983)
Biochim. Biophys. Acta, 722, 471-479.
61.Kaulen, A. D., Drachev, L. A., Khitrina, L. V.,
and Zorina, V. V. (1986) Abst. Int. Conf.: Retinal
Proteins,Academy of Sciences of USSR-FEBS, Irkutsk, p. 74.
62.Maeda, A. (1995) Isr. J. Chem., 35,
387-400.
63.Balashov, S. P., Imasheva, E. S., Govindjee, R.,
and Ebrey, T. G. (1996) Biophys. J., 70, 473-481.
64.Braiman, M. S., Dioumaev, A. K., and Lewis, J. R.
(1996) Biophys. J., 70, 939-947.
65.Richter, H.-T., Brown, L. S., Needleman, R., and
Lanyi, J. K. (1996) Biochemistry, 35, 4054-4062.
66.Imasheva, E. S., Balashov, S. P., Ebrey, T. G.,
Chen, N., Crouch, R. K., and Menick, D. R. (1999) Biophys. J.,
77, 2750-2763.
67.Kandori, H. (2000) Biochim. Biophys. Acta,
1460, 177-191.
68.Zscherp, C., Schlesinger, R., Tittor, J.,
Oesterhelt, D., and Heberle, J. (1999) Proc. Natl. Acad. Sci.
USA, 96, 5498-5503.
69.Balashov, S. P. (2000) Biochim. Biophys.
Acta, 1460, 75-94.
70.Skulachev, V. P. (1992) Proc. V Int. Conf.:
Structures and Functions of Retinal Proteins (Dourdan) (Rigaud, J.
L., ed.)Vol. 221,Collogue INSERM/John Libbey Eurotext Ltd., Montrouge,
France, pp. 167-170.
71.Danshina, S. V., Drachev, L. A., Kaulen, A. D.,
Korana, Kh. G., Marti, T., Mogi, T., and Skulachev, V. P. (1992)
Biokhimiya, 10, 1574-1585.
72.Skulachev, V. P. (1993) Quart. Rev.
Biophys., 26, 177-199.
73.Kaulen, A. D., and Drachev, L. A. (1988) Abst.
Soviet-Czech Seminar on the Dynamics and Activities of Biological
Macromolecules: the Laser and Computerized Experiment, Yerevan, pp.
28-29.
74.Kaulen, A. D., Drachev, L. A., and Zorina, V. V.
(1989) Biol. Membr. (Moscow), 6, 149-152.
75.Drachev, L. A., Kaulen, A. D., and Zorina, V. V.
(1989) FEBS Lett., 243, 5-7.
76.Dencher, N. A., Dresselhaus, D., Zaccai, G., and
Buldt, G. (1989) Proc. Natl. Acad. Sci. USA, 86,
7876-7879.
77.Varo, G., and Lanyi, J. K. (1995)
Biochemistry, 34, 12161-12169.
78.Subramaniam, S., Gerstein, M., Oesterhelt, D.,
and Henderson, R. (1993) EMBO J., 12, 1-8.
79.Vonk, J. (2000) EMBO J., 19,
2152-2160.
80.Subramaniam, S., and Henderson, R. (2000)
Biochim. Biophys. Acta, 1460, 157-165.
81.Radionov, A. N., and Kaulen, A. D. (1996)
Biochemistry (Moscow), 61, 1539-1553 (Russ.).
82.Radionov, A. N., and Kaulen, A. D. (1996) FEBS
Lett., 387, 122-126.
83.Radionov, A. N., and Kaulen, A. D. (1997) FEBS
Lett., 409,137-140.
84.Radionov, A. N., Klyachko, V. A., and Kaulen, A.
D. (1999) Biochemistry (Moscow), 64, 1210-1214.
85.Radionov, A. N. (1999) Studies on the
Reprotonation Mechanism of the Schiff Base during the Mutant
Bacteriorhodopsin D96N Photocycle:Author's abstract of Candidate's
dissertation [in Russian], Moscow State University, Moscow.
86.Radionov, A. N., and Kaulen, A. D. (1999) FEBS
Lett., 451, 147-151.
87.Drachev, L. A., Kaulen, A. D., and Komrakov, A.
Y. (1992) FEBS Lett., 313, 248-250.
88.Zimanyi, L., Varo, G., Chang, M., Ni, B.,
Needleman, R., and Lanyi, J. K. (1992) Biochemistry, 31,
8535-8543.
89.Cao, Y., Brown, L. S., Sasaki, J., Maeda, A.,
Needleman, R., and Lanyi, J. K. (1995) Biophys. J., 68,
1518-1530.
90.Sasaki, J., Shichida, Y., Lanyi, J. K., and
Maeda, A. (1992) J. Biol. Chem., 267, 20782-20786.
91.Rodig, C., and Siebert, F. (1999) FEBS
Lett., 445, 14-18.
92.Sass, H. J., Schachowa, I. W., Rapp, G., Koch, M.
H. J., Oesterhelt, D., Dencher, N. A., and Buldt, G. (1997) EMBO
J., 16, 1484-1491.
93.Komrakov, A. Y., and Kaulen, A. D. (1995)
Biophys. Chem., 56, 113-119.
94.Komrakov, A. Yu., Radionov, A. N., and Kaulen, A.
D. (1995) Mol. Biol. (Moscow), 29, 1368-1375.
95.Danshina, S. V., Drachev, L. A., Kaulen, A. D.,
and Skulachev, V. P. (1992) Biokhimiya, 57, 738-748.
96.Danshina, S. V., Drachev, L. A., Kaulen, A. D.,
and Skulachev, V. P. (1992) Photochem. Photobiol., 55,
735-740.
97.Balashov, S. P., Lu, M., Imasheva, E. S.,
Govindjee, R., Ebrey, T. G., Othersen, B., III, Chen, Y., Crouch, R.
K., and Menick, D. R. (1999) Biochemistry, 38,
2026-2039.
98.Mirsa, S., Govindjee, R., Ebrey, T. G., Chen, N.,
Ma, J.-X., and Crouch, R. K. (1997) Biochemistry, 36,
4875-4883.
99.Brown, L. S., Sasaki, J., Kandori, H., Maeda, A.,
Needleman, R., and Lanyi, J. K. (1995) J. Biol. Chem.,
270, 27122-27126.
100.Balashov, S. P., Imasheva, E. S., Ebrey, T. G.,
Chen, N., Menick, D. R., and Crouch, R. K. (1997) Biochemistry,
36, 8671-8676.
101.Kalaidzidis, I. V., Belevich, I. N., and
Kaulen, A. D. (1998) FEBS Lett., 434, 197-200.
102.Tanio, M., Tuzi, S., Yamaguchi, S., Kawaminami,
R., Naito, A., Needleman, R., Lanyi, J. K., and Saito, H. (1999)
Biophys. J., 77, 1577-1584.
103.Dioumaev, A. K., Richter, H.-T., Brown, L. S.,
Tanio, M., Tuzi, S., Saito, H., Kimura, Y., Needleman, R., and Lanyi,
J. K. (1998) Biochemistry, 35, 2496-2506.
104.Rammelsberg, R., Huhn, G., Lubben, M., and
Gerwert, K. (1998) Biochemistry, 37, 5001-5009.
105.Provencher, S. W. (1976) Biophys. J.,
16, 27-50.
106.Brown, A. O. (1965) J. Mol. Biol.,
12, 491-508.
107.Govindjee, R., Balashov, S. P., and Ebrey, T.
G. (1990) Biophys. J., 58, 597-608.
108.Liu, S. Y. (1990) Biophys. J.,
57, 943-950.
109.Drachev, A. L., Zorina, V. V., Khitrina, L. V.,
Mitsner, B. I., Khodonov, A. A., and Chekulaeva, L. N. (1987)
Biokhimiya, 52, 1559-1569.
110.Hendler, R. W., Drachev, L. A., Bose, S., and
Joshi, M. K. (2000) Eur. J. Biochem., 19, 5879-5890.
