Conformational Changes and Inactivation of Bovine Carbonic Anhydrase II in 2,2,2-Trifluoroethanol Solutions
Xiang Wei, Sheng Ding, Yan Jiang, Xian-Gang Zeng*, and Hai-Meng Zhou*
Laboratory of Molecular Enzymology, Department of Biological Sciences and Biotechnology, Tsinghua University, Beijing 100084, China; fax: +86-10-6277-2245; E-mail: zhm-dbs@mail.tsinghua.edu.cn* To whom correspondence should be addressed.
Received May 13, 2005; Revision received July 14, 2005
Changes in unfolding and enzymatic activity of bovine carbonic anhydrase II (BCA II) in different concentrations of 2,2,2-trifluoroethanol (TFE) were investigated by 1-anilino-8-naphthalenesulfonate (ANS) fluorescence emission spectra, far-UV CD spectra, and enzyme activity. The results showed that the activity and conformation of BCA II changed according to the concentration of TFE. Significant aggregation was observed when BCA II was denatured at TFE concentrations between 10 and 35% (v/v). When the concentration of TFE exceeded 40%, the aggregation of BCA II was not very obvious. The activity of BCA II decreased almost to zero as the TFE concentration reached 26%. The ANS fluorescence spectra indicated the tertiary conformations of BCA II were more stable in solutions with TFE concentrations lower than 15% (v/v) and higher than 40% (v/v). Far-UV CD spectra showed that high concentrations (higher than 25%) of TFE could induce BCA II to form more alpha-helix structures and caused these structures to be in relatively stable states. The native conformation of BCA II being destroyed after its inactivity indicated that the active sites of BCA II is situated in a limited region and has more flexibility than the whole enzyme molecule.
KEY WORDS: bovine carbonic anhydrase II, 2,2,2-trifluoroethanol, structure, activity, intermediatesDOI: 10.1134/S000629790613013X
Abbreviations: BCA II) bovine carbonic anhydrase II; pNPA) p-nitrophenyl acetate; TFE) 2,2,2-trifluoroethanol; ANS) 1-anilino-8-naphthalenesulfonate.
Carbonic anhydrase (CA, carbonate hydrolyase, carbonate dehydratase, EC
4.2.1.1) is widely distributed in mammalian tissues and participates in
physiological systems such as respiration, acid-base balance, ion
transport, bone resorption, signal transduction, ureagenesis,
gluconeogenesis, and lipogenesis [1-4]. It is a zinc-containing enzyme that catalyzes the
reversible hydration of carbon dioxide with high efficiency:
CO2 + H2O <-->
HCO3- + H+. There are many
isozymes of CA, eleven of which are known as active types [5, 6]. The enzyme bovine carbonic
anhydrase II is a single-chain enzyme of 259 amino acid residues
without any cysteines, and its molecular weight is 29,097 daltons. It
has been a widely used model protein in the investigation of the
protein folding process [7-9].
One of the most interesting issues in protein folding is how structures can form in the absence of many of the interactions that stabilize a protein's native state, and the significance of these structures for the process of folding. 2,2,2-Trifluoroethanol (TFE) has been widely used as a structure-inducing co-solvent [10, 11]. Numerous investigations, using peptides and proteins, have established a strong correlation between TFE-induced structures and native protein structures [12-14]. TFE solutions have also been used to study partially folded states and equilibrium intermediates [15, 16]. TFE-H2O mixtures are known to stabilize secondary structures, especially alpha-helixes, and the state of a protein or peptide that is stabilized by TFE has been called the TFE state in some studies. The denaturation and unfolding process of several proteins in TFE solutions have been studied previously [17-22].
The main methods to detect changes in proteins and polypeptides are far-UV CD spectroscopic detection, thermodynamic parameters, fluorescence spectra, nuclear magnetic resonance spectroscopy, and site directed mutagenesis. Here we report some experiments exploring the kinetic property of the structure and activity of bovine carbonic anhydrase II (BCA II) in TFE-buffer solutions.
MATERIALS AND METHODS
Reagents. Bovine carbonic anhydrase II (Mr 29,097, from bovine erythrocytes), p-nitrophenyl acetate (pNPA, Mr 181.1), TFE, 1-anilino-8-naphthalenesulfonate (ANS), and Tris were obtained from Sigma (USA). All other reagents used were local products of analytical grade.
Sample preparation and activity measurement. The enzyme concentrations were determined by measuring the absorbance at 280 nm and using the absorption coefficient A1cm, 1mg/ml = 1.83 [7].
BCA II was denatured in solutions containing different concentrations of TFE in 50 mM Tris-H2SO4 buffer (pH 7.5) for 12 h. The concentration of TFE was varied between 0 and 60% (v/v).
A stock solution of pNPA was prepared by dissolving 108.6 mg of pNPA in 3 ml acetone, then adjusting the volume to 100 ml with deionized water, and the saturated pNPA solution was obtained after filtration.
The BCA II activity was measured by following the increasing absorbance at 348 nm accompanying the hydrolysis of pNPA [23] during 1 min. The kinetics of activity was continued for 5 min. For the activity measurement, 20 µl of a sample solution was added to 580 µl substrate solution containing 200 µl of the pNPA stock solution and 50 mM Tris-H2SO4 buffer (pH 7.5), which was prepared just before measurement. The final concentration of BCA II was 0.1 mg/ml. The increase in absorbance at 348 nm was continuously measured with a Perkin Elmer Lambda Bio UV spectrophotometer.
The kinetic analysis of the substrate reaction during irreversible inhibition of BCA II was studied using the progress-of-substrate-reaction method previous described by Tsou [24].
Aggregation during the unfolding course of BCA was followed by recording the turbidity of the sample mixture solutions, i.e., the apparent absorbance at 400 nm in the Perkin Elmer Lambda Bio UV spectrophotometer.
Spectroscopic measurements. The samples were treated for 12 h in buffers containing different concentrations of TFE. After incubating the enzyme solutions with 0.0667 mg/ml ANS for 30 min, the ANS binding fluorescence changes were measured at the excitation wavelength of 350 nm and the emission wavelength from 400 to 600 nm using an F-2500 fluorescence spectrophotometer with 1-cm path-length cuvettes [25-27].
The far-UV CD spectra were recorded on a Jasco 750 spectropolarimeter from 190 to 250 nm with a 1 mm path-length cell [28].
All reactions and measurements were carried out in 50 mM Tris-H2SO4 buffer (pH 7.5) at 25°C. The final enzyme concentration was 0.1 mg/ml except for the activity kinetics (0.033 mg/ml) and far-UV CD spectra (1 mg/ml).
RESULTS
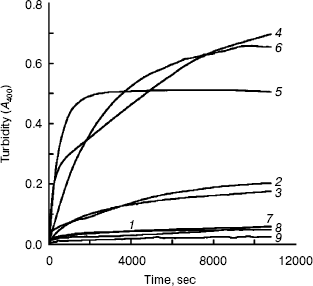
Aggregation of the unfolding BCA in TFE solutions with different concentrations. Slight aggregation occurred with BCA II in TFE solutions of low concentrations (less than 20%, v/v). When the TFE concentration reached 25%, significant aggregation was observed until the concentration of TFE was increased to 35%. Almost no aggregation was found during the unfolding of BCA II in solutions with 40% (or more) TFE (shown in Fig. 1).
The result showed that hydrophobic surface was exposed during the unfolding of BCA II in TFE solutions with suitable concentrations (between 20 and 35%, v/v), since it is generally believed that aggregation occurs when too much hydrophobic surface is exposed. But higher concentrations of TFE can disrupt the hydrophobic clusters of BCA II.Fig. 1. Aggregation process of BCA II in different concentrations of TFE: BCA II was dissolved in 50 mM Tris-H2SO4 (pH 7.5) for the measurement. The final carbonic anhydrase concentration was 0.1 mg/ml. All the measurements were carried out at 25°C. The TFE concentrations for curves 1-9 were 0, 10, 20, 25, 30, 35, 40, 50, and 60% (v/v), respectively.
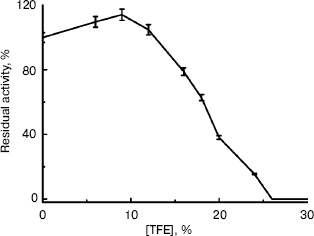
Changes in activity of BCA II in solutions with different concentrations of TFE. BCA II was added to buffers with 0-60% TFE. The enzymatic activities were measured after incubation for 12 h (Fig. 2). Figure 2 shows that low concentrations of TFE (below 10%, v/v) had little influence on the activity of BCA II; there was even a slight increase with increasing TFE concentration. But the BCA II activity decreased sharply as TFE concentrations increased further. BCA II lost almost all of its activity when the TFE concentration was increased to 26% (v/v).
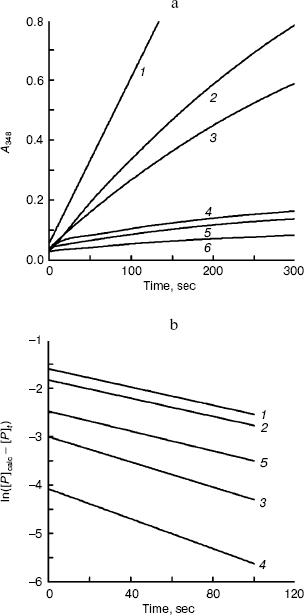
The kinetics of activity of BCA II is shown in Fig. 3. Figure 3a shows the temporal variation of the absorbance at 348 nm for different TFE concentrations within 5 min, which reflects the product concentration during substrate hydrolysis. From these curves, the kinetic course of the substrate reaction approached a nearly straight line for each TFE concentration within 5 min. The slope decreased with the increase in TFE concentration. When the TFE concentration reached 60% (v/v), the denatured BCA II retained very little activity compared to that of the native enzyme. Figure 3b shows the semilogarithmic plots of activity versus time, which correspond to the lines in Fig. 3a. According to Tsou [24], the irreversible substrate reaction can be written as:Fig. 2. BCA II activity. Measurements were taken after the BCA II was treated for 12 h in TFE solutions of different concentrations at 25°C. The activity of the native state was used as 100%. The BCA II concentration was 3.0 mg/ml when treated with TFE, and the final concentration was 0.1 mg/ml. All the measurements were carried out at 25°C.
where [P]t is the concentration of the product formed at time t, and [Y] is the concentration of the inhibitor. The apparent rate constant for the inactivation reaction is , where and are the microscopic rate constants for inhibition of the free enzyme and for the enzyme-substrate complex, respectively, [S] is the concentration of the substrate, is the Michaelis constant, and a and b are constants. At sufficiently long reaction time, Eq. (1) can be written in the following form:
Combining Eqs. (1) and (2) gives:
Plots of ln([P]calc - [P]t) versus t give a series of straight lines for different concentration of alcohol, each with slope of -A[Y]. That means the reaction of BCA II and alcohol is a non-complexation reaction but a first-order reaction [29].
Conformation changes of BCA II in solutions with different TFE concentrations. The unfolding courses of BCA II in the TFE solutions of different concentrations were followed by changes in fluorescence and the far-UV CD spectra.Fig. 3. Time courses of substrate hydrolysis in the presence of TFE. The measurement conditions were as for Fig. 2 except that the final concentration of enzyme was 0.033 mg/ml. a) Activation course of BCA II in TFE solutions. TFE concentrations for curves 1-6 were 0, 2, 5, 10, 15, and 20% (v/v), respectively. b) ln([P]calc - [P]t) versus time of BCA II. ln([P]calc - [P]t) was calculated as a function of time from the data shown in (a). TFE concentrations for curves 1-5 were 2, 5, 10, 15, and 20% (v/v), respectively.
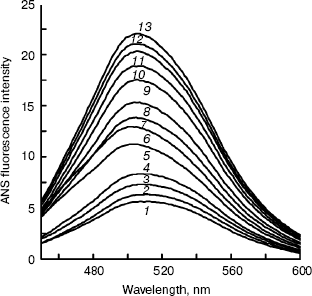
BCA II was added to buffers including TFE for 12 h, and then the ANS binding fluorescence spectra were measured. The results of ANS fluorescence spectra are shown in Fig. 4. Increases in the TFE concentration caused the fluorescence intensity to increase gradually. The whole curve in Fig. 4 demonstrates a nearly “S” shape that indicates the molecule was operative throughout the unfolding process.
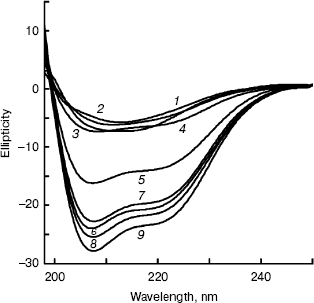
Far-UV CD spectra of BCA II were recorded after BCA II was incubated in buffers with different concentrations of TFE for 12 h (Fig. 5). The molecular average ellipticity at 222 nm represents the amount of helix in the protein molecule. According to Fig. 5, no obvious changes in secondary structure were observed with TFE solutions below 25% (v/v), while the molecular average ellipticity, that is the negative value at 222 nm, increased significantly with increasing concentrations of TFE solutions between 25 and 40%, v/v. When the concentrations were above 40% (v/v), the molecular average ellipticity at 222 nm remained at a high plateau.Fig. 4. ANS binding fluorescence emission spectra of BCA II in solutions of different TFE concentrations. ANS was added to each sample after incubation at different TFE concentrations for 12 h. The reactivation time of BCA II and ANS was 30 min. The final BCA II and ANS concentrations were 0.1 and 0.04 mg/ml, respectively. The excitation wavelength was 350 nm. BCA II fluorescence emission spectra were measured over the wavelength range 400-600 nm. All the measurements were carried out at 25°C. TFE concentrations for curves 1 to 13 were 0, 5, 10, 15, 20, 25, 30, 35, 40, 45, 50, 55, and 60% (v/v), respectively.
The kinetics of CD spectra at 222 nm were recorded as soon as BCA II samples were added to 5 and 50% (v/v) TFE solutions, respectively. From the results (not showed), we found that theta222 of BCA II in the 5% (v/v) TFE solution was also very small (staying around -20°), and it changed little throughout the whole duration. However, theta222 of BCA II in the 50% (v/v) TFE solution were larger (reaching nearly -75°) than the former and a clear change was detected at the beginning of the time period, especially during the first 20 sec.Fig. 5. Far-UV CD spectra of BCA II in solutions of different TFE concentrations. Measurements were taken after the BCA II was treated for 12 h in solutions of different TFE concentrations at 25°C. The concentrations of TFE for curves 1-9 were 0, 10, 20, 30, 35, 40, 50, 55, and 60% (v/v), respectively.
DISCUSSION
The relation between structural changes and activity of enzymes has been extensively investigated in the literature. In the present study, we mainly focused on the change in BCA II structure and activity in TFE solutions. Our results showed that the activity and structure altered significantly with the change in TFE concentrations.
The major effects of TFE on protein structures have been shown to decrease the strength of hydrophobic interactions, disrupt water structure, and increase intramolecular hydrogen bonds [30]. The TFE-water solution could destroy the tertiary structure of protein [31-33] and protect its secondary structure. During the denaturation of BCA II in TFE concentrations between 0 and 35% (v/v), one possible explanation for the observed aggregation is that the number of TFE molecules in this concentration range is not sufficient to disrupt the hydrophobic core and/or any hydrophobic clusters of the induced partly unfolded intermediates. At concentrations greater than 40% (v/v), enough TFE molecules are present to prevent intermolecular condensation of the unfolding state. What is more, when TFE concentrations were above 40% (v/v), BCA II underwent significant changes in the secondary structure and its tertiary structure changed in a different way from those in the TFE solutions with lower concentrations. It has been suggested [34] that the hydrogen bonds between alcohol-rich medium and protein became weaker, making the hydrogen bonds within the polypeptide chain comparatively stronger. Many studies have also showed that TFE induces helical conformation in only those parts of proteins that were either helical in the native state or had a propensity to adopt helical conformations [9, 20, 35].
The conformational changes of protein are more complex in TFE solution than those in guanidine hydrochloride or urea. Different proteins undergo three transitional processes during unfolding in denaturants, mainly pre-transition (examples of this types include the B (1-36) fragment of Barnase, disulfide-reduced hen lysozyme, low pH alpha-lactalbumin, and cytochrome c), transition (such as BPTI, ubiquitin, and myoglobin), and post-transition (such as lysozyme and acylphosphatase) in TFE solutions [31].
The results of our work show that the helical structure of BCA II can be induced by TFE with relatively high concentrations (above 30%, v/v) but not with low concentrations. That means 0-30% TFE affected BCA II activity by destroying mainly its three-dimensional structure but not the secondary structure. When the TFE concentration changed to between 40 and 55% (v/v), the line of theta222 tended to be flat. With the further increase in TFE concentration, the secondary structure of BCA II changed further. These results can be proved further by the results of the kinetic courses of BCA secondary and tertiary structure changes (data not shown), and they accord with the “post-transition” model mentioned above.
The results of the aggregation and activity assays indicated that medium concentration (between 20 and 30%, v/v) TFE solutions caused both obvious aggregation and significant loss of activity. Meanwhile, at low and high concentrations of TFE, no obvious aggregation occurred. This result resembles the effect of TFE on creatine kinase [36].
Comparing Figs. 2 and 4, the enzyme activity of BCA II almost disappeared when the TFE concentration increased to 26% (v/v), while its tertiary structure was not completely destroyed when the TFE concentration reached 60% (v/v). This result indicates that the active site of the enzyme is situated in a limited and flexible region of the molecule, and is more flexible than the whole enzyme molecule. This result is coincident with the hypothesis of conformational flexibility of enzyme active sites suggested by Tsou et al. [37, 38]. Another possible explanation is that the alcohol might preferentially bind to the active site, and therefore the enzyme is inactivated before the whole molecule is unfolded. Of course, further studies should be made to test this hypothesis.
Previous research in our laboratory has indicated that arginine kinase is completely inactivated by only 6% TFE, whereas BCA II preserves its activity at this TFE concentration. The enhanced stability of BCA II might be explained by the fact that it contains Zn2+, which helps to keep the conformation of the active site in the compact state required for catalysis [39].
The authors thank Mrs. Xiao-Lan Ding (Tsinghua University) for her expert technical assistance.
REFERENCES
1.Deutsch, H. F. (1987) Int. J. Biochem.,
19, 101-113.
2.Wistrand, P. J., and Knuuttila, K. G. (1989)
Kidney Int., 35, 851-859.
3.Tashian, R. E. (1992) Ad. Gen., 30,
321-356.
4.Sly, W. S., and Hu, P. Y. (1995) Ann. Rev.
Biochem., 64, 375-401.
5.Hewett-Emmett, D., and Tashian, R. E. (1996)
Mol. Phylogen. Evol., 5, 50-77.
6.Fujikawa-Adachi, K., Nishimori, I., Taguchi, T.,
and Onishi, S. (1999) Genomics, 61, 74-81.
7.Wong, K. P., and Tanford, C. (1973) J. Biol.
Chem., 248, 8518-8523.
8.Henkens, R. W., Kitchell, B. B., Lottich, S. C.,
Stein, P. J., and Williams, T. J. (1982) Biochemistry,
21, 5918-5923.
9.Dyson, H. J., Merutka, G., Waltho, J. P., Lerner,
R. A., and Wright, P. E. (1992) J. Mol. Biol., 226,
795-817.
10.Nelson, J. W., and Kallenbach, N. R. (1989)
Biochemistry, 28, 5256-5261.
11.Russ Lehman, S., Tuls, J. L., and Lund, M. (1990)
Biochemistry, 29, 5590-5596.
12.Kemmink, J., and Creighton, T. E. (1995)
Biochemistry, 34, 12630-12635.
13.Yang, J. J., Buck, M., Pitkeathly, M., Kotik, M.,
Haynie, D. T., Dobson, C. M., and Radford, S. E. (1995) J. Mol.
Biol., 252, 483-491.
14.Itzhaki, L. S., Neira, J. L., Gay, J. R. G. P.,
and Fersht, A. R. (1995) J. Mol. Biol., 254, 289-304.
15.Schonbrunner, N., Wey, J., Engels, J., Georg, H.,
and Kiefhaber, T. (1996) J. Mol. Biol., 260, 432-445.
16.Hamada, D., and Goto, Y. (1997) J. Mol.
Biol., 269, 479-487.
17.Buck, M., Radford, S. E., and Dobson, C. M.
(1993) Biochemistry, 32, 669-678.
18.Narhi, L. O., Philo, J. S., Li, T., Zhang, M.,
Samal, B., and Arakawa, T. (1996) Biochemistry, 35,
11447-11453.
19.Gast, K., Zirwer, D., Muller-Frohne, M., and
Damaschun, G. (1999) Protein Sci., 8, 625-634.
20.Zhang, Y. X., Yan, S. L., and Zhou, H. M. (1996)
J. Protein Chem., 15, 631-637.
21.Chen, Q. X., Zhang, R. Q., Yang, P. Z., Li, Y.,
Chen, S. L., Li, S., Yang, Y., and Zhou, H. M. (1999) Int. J. Biol.
Macromol., 26, 103-107.
22.Yang, Y., Zhang, X. S., and Zhou, H. M. (1998)
Biochemistry (Moscow), 63, 1307-1311.
23.Ikai, A., Tanaka, S., and Nada, H. (1978)
Arch. Biochem. Biophys., 190, 39-45.
24.Tsou, C. L. (1988) Adv. Enzymol. Relat. Areas.
Mol. Biol., 61, 381-436.
25.Meng, F. G., Hong, Y. K., He, H. W., Lyubarev, A.
E., Kurganov, B. I., Yan, Y. B., and Zhou, H. M. (2004) Biophys.
J., 87, 2247-2254.
26.Ou, W. B., Park, Y. D., and Zhou, H. M. (2002)
Int. J. Biochem. Cell Biol., 34, 136-147.
27.Pan, J. C., Yu, Z., Su, X. Y., Sun, Y. Q., Rao,
X. M., and Zhou, H. M. (2004) Protein Sci., 13,
1892-1901.
28.Xie, Q., and Zhou, H. M. (2004) Int. J.
Biochem. Cell Biol., 36, 1332-1340.
29.Zhou, H. M., and Tsou, C. L. (1986) Biochim.
Biophys. Acta, 869, 69-74.
30.Buck, M. (1998) Quart. Rev. Biophys.,
31, 297-355.
31.Barker, S., and Mayo, K. H. (1991) J. Am.
Chem. Soc., 113, 8199-8203.
32.Miranker, A., Radfors, S. E., Karplus, M., and
Dobson, C. M. (1991) Nature, 349, 633-636.
33.Radford, S. E., Dobson, C. M., and Evans, P. A.
(1992) Nature, 358, 302-307.
34.Thomas, P. D., and Dill, K. A. (1993) Protein
Sci., 2, 2050-2065.
35.Segawa, S., Fukuno, T., Fujiwara, K., and Noda,
Y. (1991) Biopolymers, 31, 497-509.
36.Huang, K., Park, Y. D., Cao, Z. F., and Zhou,
H. M. (2001) Biochim. Biophys. Acta, 1545,
305-313.
37.Tsou, C. L. (1998) Ann. N. Y. Acad. Sci.,
864, 1-8.
38.Zhang, Y. X., Zhu, Y., and Zhou, H. M. (2000)
Int. J. Biochem. Cell Biol., 32, 887-894.
39.Vallee, B. L., and Willians, R. J. P. (1968)
Proc. Natl. Acad. Sci. USA, 59, 498-505.