Proteins and Peptides of the Salivary Gland Secretion of Medicinal Leeches Hirudo verbana, H. medicinalis, and H. orientalis
I. P. Baskova1*, E. S. Kostrjukova2, M. A. Vlasova3, O. V. Kharitonova1, S. A. Levitskiy2, L. L. Zavalova4, S. A. Moshkovskii3, and V. N. Lazarev2
1Biological Faculty, Lomonosov Moscow State University, 119991 Moscow, Russia; fax: (495) 939-4309; E-mail: saliva1@yandex.ru2Research Institute of Physico-Chemical Medicine, ul. Malaya Pirogovskaya 1a, 119992 Moscow, Russia; fax: (495) 246-4501; E-mail: lazar0@newmail.ru
3Orekhovich Institute of Biomedical Chemistry, Russian Academy of Medical Sciences, ul. Pogodinskaya 10, 119992 Moscow, Russia; fax: (495) 245-0857; E-mail: smosh@mail.ru
4Shemyakin and Ovchinnikov Institute of Bioorganic Chemistry, Russian Academy of Sciences, ul. Miklukho-Maklaya 16/10, 119997 Moscow, Russia; fax: (495) 330-6538; E-mail: leech@humgen.siobc.ras.ru
* To whom correspondence should be addressed.
Received June 13, 2007; Revision received October 8, 2007
The protein and peptide composition of medicinal leech salivary gland secretion (SGS) was analyzed in preparations obtained in July from three species--Hirudo verbana, H. medicinalis, and H. orientalis. Two-dimensional electrophoresis (molecular mass 10-150 kD and pI 3-10) revealed no distinctions in the distribution of over 100 silver-stained proteins. Differences were noted only in intensity of 10 protein spots at 30-90 kD and pI 4.7-7.5. Mass spectrometric profiling of SGS of the three leech species using the Zip-Tip/golden chip scheme and cation-exchanging chips CM-10 revealed over 50 components in SGS of each of the three leech species. It was noted that 30-40% of the individual masses of the SGS of each leech species fall within the masses present in SGS of at least one of the two other species. This rather small part of the total mass may be indicative of a high polymorphism of amino acid sequences or a high frequency of posttranslational modifications of the SGS proteins and peptides. Calculation of Jacquard's coefficient showed that H. medicinalis and H. orientalis are closest to each other in SGS composition, which is consistent with data in the literature on the phylogenetic relationship between these two species of medicinal leech. Comparison of detected molecular masses with those of six known biologically active compounds produced by medicinal leeches revealed their uneven distribution in SGS of each of the three medicinal leech species. This opens prospects for using certain species of medicinal leech for targeted therapy of various pathologies.
KEY WORDS: proteomic analysis, two-dimensional electrophoresis, SELDI mass spectrometry, salivary gland secretion, medicinal leech, Hirudo verbana, H. medicinalis, H. orientalisDOI: 10.1134/S0006297908030127
Abbreviations: DTT) dithiothreitol; MS) mass spectrometry; SELDI-MS) surface-enhanced laser desorption-ionization mass spectrometry; SGS) salivary gland secretion.
At the present time therapy using medicinal leeches of the genus
Hirudo (hirudotherapy) is actively used in clinical practice in
Russia and countries of former Soviet Union as well in USA, Canada,
France, Germany, Holland, etc. The salivary gland secretion (SGS) of
medicinal leeches is a humoral agent of hirudotherapy and its
composition defines the therapeutic effect of this method in different
diseases. Analysis of composition of the medicinal leech SGS allowed us
to identify in it eight biologically active compounds [1] out of 13 described as being produced by medicinal
leeches [2]. No doubt, these do not cover the whole
arsenal of biologically active compounds of SGS, which provide for
positive effects of hirudotherapy in treatment of a broad spectrum of
diseases in different fields of medicine (cardiology, gynecology,
urology, surgery, stomatology, ophthalmology, etc.) [2]. Proteomic analysis detected over 100 proteins with
molecular mass from 10 to 97 kD in SGS [1]. It
was shown that their distribution on electrophoregrams varies depending
on the season [3]. Heterogeneous also are doses of
secretion which are injected into the wound caused by the animal's bite
during the whole time of blood suction by the leech [4]. Owing to the absence of information concerning the
genome of medicinal leeches, it is impossible now to identify proteins
and peptides revealed by proteomic analysis. The problem is even more
complicated because doctors use different medicinal leech species
(Hirudo verbana, H. medicinalis, and H.
orientalis). We have used methods of proteomic analysis such as
two-dimensional electrophoresis and SELDI-MS and tried to determine how
much species peculiarities of medicinal leech, determined by analyses
at the molecular level [5], affect the SGS
composition in general and the distribution in it of individual
biologically active compounds in particular.
MATERIALS AND METHODS
SGS was obtained as described in [4] from medicinal leeches of species H. verbana, H. medicinalis, and H. orientalis supplied by the factory for biological preparations “Girud I. N.” (Balakovo, Saratov Region) after starvation for no less than four months. To level temporal changes in the leech secretion composition, SGS of all three leech species were taken for three days in July. Each pool corresponded to a single leech species and contained SGS of no less than 60 individual leeches.
Two-dimensional electrophoresis. Each SGS preparation was dissolved in a buffer containing 8 M urea, 2 M thiourea, 5% ampholines (pH 3.0-10.0), 80 mM dithiothreitol (DTT), 30 mM Chaps (all from Amersham, USA), and 10% NP-40 and sonicated in an ultrasound bath for 5 min. Samples were centrifuged at 13,000 rpm for 15 min. Protein concentration in the samples was determined according to Bradford using the Quick Start Bradford dye reagent (BioRad, USA). Isoelectrofocusing was carried out in 18 cm glass tubes in 4% polyacrylamide gel (water for chromatography Merck, Germany), 8 M urea, 4% acrylamide/methylene-bis-acrylamide, 1.75% ampholines (pH 3.0-10.0), 3.5% ampholines (pH 5.0-8.0), 65 mM Chaps, 10% NP-40, 0.1% TEMED, 0.02% ammonium persulfate (all from Amersham). Focusing was carried out under the following conditions: 100, 200, 300, 400, 500, and 600 V for 45 min each, 700 V for 10 h, 900 V for 1-2 h. When isoelectrofocusing was finished, tubes were equilibrated in a buffer containing 6 M urea, 30% glycerol, 62.5 mM Tris-HCl (all from Amersham), pH 6.8, 2% SDS (BioRad), bromophenol blue (Sigma, USA), and 20 mM DTT for 30 min. Then tubes were transferred onto the surface of a gradient polyacrylamide gel (9-16%) and fixed with 0.9% agarose with bromophenol blue. Electrophoresis was carried out in Tris-glycine buffer with cooling under the following conditions: 20, 40, and 35 mA per gel for 20 min, 2 h, and 2.5 h, respectively. When electrophoresis was complete, gels were marked and stained by silver with thiosulfate [6]. The data were analyzed using the PDQest 8.0 program (BioRad). Two-dimensional electrophoregrams of SGS from each species were obtained six times.
SELDI-MS. Obtaining mass spectra using the Zip-Tip/golden chip scheme. A 12-µl sample of leech SGS was desalted using Zip-Tip C18 tips (Millipore, USA) according to the manufacturer's protocol (www.millipore.com). A 1-µl sample of desalted sample was applied onto the protein chip, air-dried, then the matrix solution was applied twice, 0.5 µl each. Solution of alpha-cyano-4-hydroxycinnamic acid (Bruker, Germany) (2.5 g/liter) in 50% (v/v) acetonitrile containing 0.5% (v/v) trifluoroacetic acid was used as matrix.
Samples were profiled using a SELDI-TOF Protein Biology System II (PBS II) mass spectrometer (Ciphergen, USA). Spectra were registered automatically. In this case two protocols were used: one optimized for peptides and low-molecular proteins (up to 20 kD) and the other for proteins with molecular mass of 6-60 kD. In the first protocol laser intensity was 190, in the second one it was 195. Detector sensitivity was 8, and 90 laser pulses fell on each spot. Calibration was carried out with external calibration standards using the Protein Calibration Standard I (Bruker Daltonics, Germany) that included insulin (5734 daltons), ubiquitin (8566 daltons), horse cytochrome c (12,361 daltons), and the sperm whale myoglobin (16,952 daltons). Three spectra of each SGS preparation were taken.
Obtaining mass spectra using CM-10 cation-exchange chips. Aliquots of the medicinal leech SGS were diluted twice with 50 mM ammonium acetate, pH 4.5, containing 0.02% Triton X-100, then 3-µl aliquots were applied onto a mild cation-exchange chip CM-10 (activated in advance with 10 mM HCl and equilibrated with the above-described buffer) and incubated for 30 min at room temperature in a humid chamber. Then spots on the chip were washed five times with buffer and twice with deionized water and then air-dried. Matrix was applied and spectra were taken as described for the Zip-Tip/golden chip scheme. Spectra of each SGS preparation were taken three times.
Data processing. Peaks of mass spectra from 2300 to 12,500 daltons on peptide mass spectra and from 4000 to 34,200 daltons on protein mass spectra were analyzed. Peak were detected automatically using the Ciphergen ProteinChip Software program. Minimal signal/noise ratio for detected peaks was 5. Peak masses and their intensities were exported into MS Excel tables. Data processing using the program options of Ciphergen ProteinChip software 3.1 revealed multiple-charge ions. When the number of peaks corresponding to individual molecular masses was calculated, those corresponding to the multiple-charge ions and/or to dimers or polymers were subtracted from the total number of peaks.
Data for the different types of protein chips (golden chip and cation-exchange chip) and different spectral protocols (2000-20,000 and 4000-60,000 daltons) are shown in Tables 1S-5S in the Supplement. Tables 1S-4S include m/z values, ion charges, and mean intensities for each of the three species of medicinal leech. Masses that are overlapping in analysis of peptide and protein mass spectra are given in italics. Overlaps on the golden and cation-exchange chips are shown in bold. The number of overlapping peaks is shown in Table 5S. Jacquard's coefficient was calculated to evaluate phylogenetic relationship between the medicinal leech species as the ratio of the number of mass peaks, detected on the SGS mass spectra, which intersect in different leech species, to total number of mass peaks [7].
RESULTS
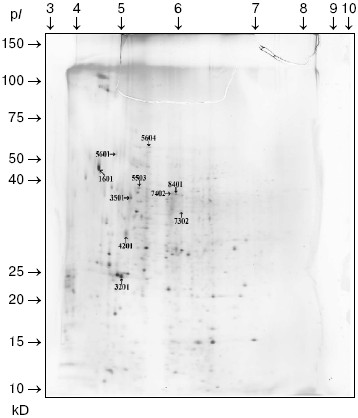
Comparison of two-dimensional electrophoregrams of SGS from H. verbana, H. medicinalis, and H. orientalis leeches. Two-dimensional electrophoresis of SGS of each of the three leech species was carried out no less that six times. Analysis using the PDQest 8.0 program (BioRad) shows full identity of protein distribution by molecular mass and isoelectric points for two-dimensional electrophoresis of SGS of the three analyzed leech species. Differences were noted only in intensity of 10 protein spots at molecular masses of 30-90 kD and pI 4.7-7.5 (Fig. 1). Figure 1 shows silver-stained two-dimensional electrophoregrams characteristic of each of the three leech species. Protein spots that differ no less than twice by intensity are marked by conventional figures related to our personal database. Quantitative distinctions in the spot intensities are shown as a histogram (Fig. 2). It is seen in Fig. 2 that the ratio of proteins characterized by high, medium, and low intensity is approximately the same in SGS of each leech species.
Fig. 1. Two-dimensional electrophoregram of SGS of medicinal leech H. verbana.
Results of SELDI-MS analysis of SGS of three medicinal leech species. Mass spectra obtained for SGS of three species of medicinal leech were analyzed using the Zip-Tip/golden chip scheme and cation-exchange chip CM-10 under two conditions. Under conditions optimized for peptides and low molecular weight proteins peaks corresponding to molecular masses from 2408 to 17,235 daltons were registered, whereas peaks corresponding to molecular mass from 4047 to 34,127 daltons were registered under conditions optimized for proteins. Figure 3 shows examples of mass spectra obtained for three species of medicinal leech using the two different chips.Fig. 2. Intensities of protein spots identified on two-dimensional electrophoregram of SGS of three species of medicinal leech and designated with numbers in Fig. 1.
Tables in the Supplement show results of analysis of peptide and protein mass spectra of the three leech species, including intensity levels of each peak (in three repeats). Table 1 of the article shows total number of individual mass peaks revealed using golden and cation-exchange chips taking into account peaks overlapping during analysis of peptide and protein mass spectra as well as those detected both on golden and cation-exchange chips. The extent of common character of SGS composition in the three species of medicinal leech was evaluated by revealing both mass-spectrometry peaks and molecular masses identical for at least one of the two other leech species upon taking mass spectra under conditions optimized for peptides and low-molecular-weight proteins and under conditions optimized for proteins (Table 2).Fig. 3. Examples of mass spectra obtained for three species of medicinal leech under conditions optimized for peptides and low molecular weight proteins using the Zip-Tip/golden chip scheme (a) and CM-10 cation-exchange chips (b).
Table 1. Total number of individual mass
peaks of SGS of three species of medicinal leech
Table 2. Number of individual mass peaks
identical with at least one of the other two species of medicinal
leach
*Accounting molecular mass values repeated in MS-spectrograms
during analysis on two different chips.
An illustrative notion concerning the extent of common character of the SGS peptide and protein composition in the three leech species for molecular masses from 2356 to 34,127 daltons is presented by Euler diagrams (Fig. 4) showing the number of individual mass peaks detected by mass spectrometer SELDI on a golden chip (a), cation-exchange chip (b), and on both these chips (c) in SGS of each of the three leech species. Each circle corresponds to one species, in fields of overlapping there are mass numbers found simultaneously in two or three species.
Results shown in Euler diagrams were used for evaluation of phylogenetic relationship between the three leech species using Jacquard's coefficients for the three pairs of leeches from different species. Thus, coefficients 0.095, 0.087, and 0.135 were obtained for pairs H. medicinalis-H. verbana, H. verbana-H. orientalis, and H. orientalis-H. medicinalis. This means that the closest relationship is observed between species H. orientalis and H. medicinalis.Fig. 4. Euler diagrams. The number of individual masses determined in SGS of the three species of medicinal leech on golden (a), cation-exchange (b), and on both chips (c).
DISCUSSION
Comparison of two-dimensional electrophoresis of SGS from three different species of medicinal leech in a broad range of molecular mass (10-150 kD) and isoelectric points (3-10) is indicative of the presence of approximately 100 protein spots detected by silver staining (Fig. 1). These data correlate with former results on evaluation by the same technique of the composition of SGS obtained from medicinal leeches without accounting for their species affiliation [1, 3].
In the absence of differences in the protein spot positions on two-dimensional electrophoregrams, species distinctions were revealed in the intensity of 10 protein spots in the molecular mass range from 23 to 52 kD and pI 4.8-6.2, in this case the ratio of proteins characterized by high, medium, and low intensity is almost the same in SGS of each medicinal leech species (Fig. 2). Euler diagrams produce a concept of common character of protein and peptide SGS components in the three species of medicinal leeches (Fig. 4). About 30-40% of sum of the SGS molecular mass of each leech species are shared with SGS of another species.
Data of mass spectrometry are indicative of high polymorphism of amino acid sequences of the SGS proteins and peptides. The existence of posttranslational modifications in the SGS proteins is also not excluded [8]. The absence of differences in the spot positions on electrophoregram is explained by impossibility to detect slight distinctions in molecular mass (10-20 daltons) by electrophoresis. At the same time they are well resolved on mass spectra. For example, proteins differing from one another by a single amino acid are detected by mass spectrometry as two different peaks, whereas on electrophoregram they are seen as one spot.
Jacquard's coefficients calculated from data of mass spectrometry for three pairs of leech species show that SGS of H. orientalis and H. medicinalis exhibit the highest similarity. The results with data from the literature concerning phylogenetic closeness of H. orientalis and H. medicinalis species, which were obtained by analysis of nuclear and mitochondrial DNA [9].
The total number of detected individual mass peaks in the H. medicinalis SGS exceeds by 20% that in SGS of other two leech species (Table 2). Distinctions were also revealed upon comparison of our data on molecular mass values with data from the literature about molecular mass of known proteins produced by medicinal leeches and serving as carriers of certain biological functions (Table 3). Thus, inhibitor of tryptase (a unique enzyme of mast cells which plays an important role in allergic and inflammatory states associated with dysfunction of these cells [10]) exists in SGS of H. verbana and H. orientalis. At the same time hirustasin, an antiinflammatory agent (inhibitor of tissue kallikrein, trypsin, chymotrypsin, and cathepsin of G neutrophils [12]) is found only in SGS of H. verbana and H. medicinalis. Destabilase-lysozyme (a bifunctional enzyme carrying out glycosidase and isopeptidase functions [15, 16]) and eglins exhibiting antiinflammatory functions (inhibitors of chymotrypsin, chymase, subtilisin, and neutrophil proteinases elastase and cathepsin G [14]) are present in secretions of all three species under study. Both bdellins A and B (powerful inhibitors of trypsin-like enzymes [11, 13]) are present only in one of two medicinal leech species. The list of detected molecular mass values does not contain a value corresponding to hirudin, the best known SGS component, because we analyzed secretion obtained in July, when activity of this anticoagulant is practically absent from the secretion [3]. Our results show for the first time uneven distribution of biologically active SGS components in the three leech species under study. Previously differences in protein distribution in winter and summer secretions were demonstrated by two-dimensional electrophoresis but without considering species distinctions between medicinal leeches [3].
Table 3. Molecular masses of protein
components of SGS of three species of medicinal leach revealed by
SELDI-MS (CM-10 and golden chip) and literature data on molecular mass
values of proteins produced by medicinal leaches
Note: Number in parentheses (1)-(3) correspond to H. verbana, H. medicinalis, and H. orientalis.
Identification of peptides and proteins in SGS of medicinal leeches now depends on the state of works concerning the genome of this invertebrate. Owing to the absence of such data there is only a more complicated way for gradual solution of this problem, by creation of a cDNA library of one species of medicinal leech. Results of this work, for the first time showing the ratio of peptide and protein components in SGS of three species of European medicinal leech, are a basis for further investigations in this direction.
This work was supported by the Russian Foundation for Basic Research (grant 06-04-48611) and INTAS (grant 05 1000008-8147).
REFERENCES
1.Baskova, I. P., Zavalova, L. L., Basanova, A. V.,
Moshkovskii, S. A., and Zgoda, V. G. (2004) Biochemistry
(Moscow), 69, 770-775.
2.Baskova, I. P., and Isakhanyan, G. S. (2004)
Hirudotherapy. Science and Practice [in Russian], Monolit,
Moscow.
3.Baskova, I. P., Zavalova, L. L., Kostryukova, E.
S., Titova, G. A., Lazarev, V. N., and Zgoda, V. G. (2007)
Biochemistry (Moscow), 72, 219-225.
4.Baskova, I. P., Zavalova, L. L., Basanova, A. V.,
and Sass, A. V. (2001) Biochemistry (Moscow), 66,
1368-1373.
5.Siddall, M. E., Trontelj, P., Utevsky, S. Y.,
Nkamany, M., and Macdonald, K. S. (2007) Proc. Biol. Sci.,
274, 1481-1487.
6.Blum, H., Beier, H., and Gross, H. J. (1987)
Electrophoresis, 8, 93-99.
7.Magarran, E. (1992) Ecological Variability and
Its Estimation [Russian translation], Mir, Moscow.
8.Moshkovskii, S. A., Vlasova, M. A., Pyatnitskiy, M.
A., Tikhonova, O. V., Safarova, M. R., Makarov, O. V., and Archakov, A.
I. (2007) Proteomics. Clinical Applications, 1,
107-117.
9.Utevsky, S. Y., and Trontelj, P. (2005)
Parasitol. Res., 98, 61-66.
10.Stubbs, M. T., Morenweiser, R., Stuzebecher, J.,
Bauer, M., Bode, W., Huber, R., Piechottka, G. P., Matschiner, G.,
Sommerhoff, Ch. P., Fritz, H., and Auerswald, E. (1997) J. Biol.
Chem., 272, 19931-19937.
11.Fritz, H., Gebhardt, M., Meister, R., and Fink,
E. (1971) in Proc. Int. Conf. Proteinase Inhibitors, Munich,
1970 (Fritz, H., and Tschesche, H., eds.) Walter de Gruyter, Berlin,
pp. 271-280.
12.Sollner, Ch., Mentele, R., Eckerskorn, Ch.,
Fritz, H., and Sommerhoff, Ch. (1994) Eur. J. Biochem.,
219, 937-943.
13.Moser, M., Auerswald, E., Mentele, R.,
Eckerskorn, Ch., Fritz, H., and Fink, E. (1998) Eur. J.
Biochem., 253, 212-220.
14.Seemuller, U., Dodt, J., Fink, E., and Fritz, H.
(1986) in Proteinase Inhibitors (Barret, A. J., and Salvesen,
G., eds.) Elsevier, Amsterdam-New York-Oxford, pp. 337-359.
15.Zavalova, L. L., Artamonova, I. I., Berezhnoy, S.
N., Tagaev, A. A., Baskova, I. P., Andersen, J., Roepstorff, P., and
Egorov, Ts. A. (2003) Biochem. Biophys. Res. Commun.,
603, 318-323.
16.Zavalova, L., Lukyanov, S., Baskova, I.,
Snezhkov, E., Akopov, S., Berezhnoy, S., Bogdanova, E., Barsova, E.,
and Sverdlov, E. (1996) Mol. Gen. Genet., 253, 20-25.
SUPPLEMENT
The tables below present mass-spectrometric data characterizing peptides and proteins of salivary gland secretion of the three species of medicinal leech identified using the Zip-Tip/golden chip scheme and cationexchange CM-10 chips.
Table 1S. Peaks on mass spectra obtained on golden chip
under conditions optimized for masses up to 20,000 daltons
Table 2S. Peaks on mass spectra obtained on a cation-exchange
chip under conditions optimized for mass up to 20,000 daltons
Table 3S. Peaks on mass-spectrograms obtained on golden chip
under conditions optimized for masses 6000-60,000 daltons
Table 4S. Peaks on mass spectrograms obtained on cation-exchange
chip under conditions optimized for masses 6000-60,000 daltons
Table 5S. Number of overlapping peaks