Changes in Physicochemical Parameters and α-Crystallin Expression in the Lens during Cataract Development in OXYS Rats
Yu. V. Rumyantseva, A. Zh. Fursova, L. A. Fedoseeva, and N. G. Kolosova*
Institute of Cytology and Genetics, Siberian Branch of the Russian Academy of Sciences, pr. Akademika Lavrentieva 10, 630090 Novosibirsk, Russia; E-mail: kolosova@bionet.nsc.ru* To whom correspondence should be addressed.
Received April 15, 2008; Revision received April 22, 2008
The pathogenesis of cataract is associated with oxidative stress and with altered crystallin expression but it is still understood incompletely. In this study, the senescence-accelerated OXYS rats were used as a model. The first biomicroscopic signs of cataract in OXYS rats were registered at the age of 1.5 months; at 3 months morbidity reached 90%, and at 6 months it reached 100%. Cataract manifestation progresses: at 24 months mature cataract was detected in 90% of eyes of OXYS rats, whereas in 80% of Wistar rat eyes only initial signs of this disease were detected. Analysis of lens redox-parameters has shown that in OXYS rats the intensity of tryptophan fluorescence is higher, the GSH content being higher at 2 months but during formation of mature cataract at 13, 18, and 24 months being lower than in Wistar rats. Decrease in solubility of OXYS rat lens proteins was observed at the age of 13 months. At the age of 3 months gene expression of αA-crystallin and αB-crystallin was 3-fold and 25% lower, respectively, than in Wistar rats. At the age of 14 months there was a 27-fold decrease in expression of αB-crystallin in OXYS rats and it became 21-fold lower than in control. Proteins are synthesized in lens epithelial cells and dystrophic changes in senile cataract result in decrease in structural protein expression. The changes observed in OXYS rats are evidently associated with the dystrophic changes in lens epithelium, which we have described earlier, and are consistent with the model of senile cataract.
KEY WORDS: cataract, oxidative stress, α-crystallin expression, senescence-accelerated OXYS ratsDOI: 10.1134/S0006297908110023
Abbreviations: LPO) lipid peroxidation; MDA) malondialdehyde.
Cataract is the most frequent cause of impairment and loss of vision in
elderly people; the etiology of this disease is still not well
understood [1]. Detected clinical changes usually
correspond to the irreversible stage of this disease, when therapeutic
treatments are basically ineffective. There are no possibilities to
investigate early stages of the development of cataract in humans. One
approach employed for studies of etiology and pathogenesis of human
diseases and also to the development of new approaches for their
treatment and prophylaxis consists in the development of biological
models. Cataract has been modeled for many years, but most of these
models cannot be considered as really senile pathology: very often
lenticular opacities are caused by chemical or irradiation treatments.
In humans cataract represents a manifestation of aging and frequently
cataract development is associated with complex manifestations
accompanying its changes and diseases [2]. Several
models are widely used: Emory mouse strain [3], the
SAM-R/3 substrain of prematurely aging SAM mice [4], and also UPL Sprague-Dawley [5] and SCR (Shumiya Cataract Rat) rats [6]. Recent studies have shown that the strain of
senescence-accelerated OXYS rats meet the main requirements for the
model senile cataract; this strain was developed more then 30 years ago
at the Institute of Cytology and Genetics, Siberian Branch of the
Russian Academy of Sciences by selection and inbreeding of Wistar rats
susceptible to the cataractogenic effect of galactose [7]. Only in the first five generations the development
of cataract was provoked by galactose enriched diet. We now have the
82nd generation of OXYS rats with spontaneously developed cataract and
associated premature aging. At clinical and morphological levels, it
was shown that changes in OXYS rat lens are similar to those in humans
with developed senile cataract [8-10], and these rats react to the standard therapy [11]. This model is successfully used for estimation
of efficiency of new approaches for prophylaxis and treatment of
cataract [12].
Besides cataract, senescence-accelerated OXYS rats are characterized by retinal dystrophy, arterial hypertension, osteoporosis, and also cognitive and emotional changes typical for aging people and animals. Their pathogenesis is associated with oxidative stress, which includes imbalance in the systems of generation and detoxification of reactive oxygen species. However, these signs are formed prior registration of the increased level of oxidative damage of macromolecules in tissues of OXYS rats [8, 13-15]. Certain evidence exists that oxidative stress can be both the cause and the consequence of age-related changes in the organism. It is known that cataract development is closely associated with decreased metabolic activity, increase in the number of disulfide bonds, accumulation of oxidative damage, and decrease in protein solubility. Age-related changes in lens are accompanied by significant change in tryptophan content and its derivatives playing the role of UV-filters in the mammalian eye lens [16]. Recent data suggest that cataractogenesis is accompanied by the change in expression of genes encoding the main lens crystallin proteins, which may be significantly altered in senile cataract [17]. All these parameters have not been investigated in the OXYS rats so far. In this study, we have compared the clinical pattern of cataract development in OXYS rats with changes in the redox-dependent physicochemical characteristics of lens and expression of α-crystallin using Wistar rats as control. We have also evaluated the content of lipid peroxidation products (LPO) in blood serum, which is traditionally used in clinical practice and in experiment as the marker of oxidative stress for diagnostics of systemic changes of its parameters at the level of the whole organism [18].
MATERIALS AND METHODS
This study was carried out using generations 74-80 of OXYS rats and Wistar rats (as controls) on the basis of the Breeding Laboratory of the Institute of Cytology and Genetics, Siberian Branch of the Russian Academy of Sciences. Ophthalmoscopic examinations were carried out using a Betta direct ophthalmoscope (Germany) equipped with a slit lamp, after dilatation with 1% tropicamide. In total 726 animals from 20 days to 24 months of age were examined. Lens state was evaluated using the AREDS Lens Opacity Grading protocol: 0 - transparent lens; 1 - very light cortical or nuclear opacity in the lens (corresponding to the decimal scale of the standard 1-4); 2 - opacity zones (corresponding to the decimal scale of the standard 5-8); 3 - intensive cortical or nuclear opacity of the lens (corresponding to the decimal scale of the standard 9-10). Biochemical studies of lens and serum employed 152 rats of different age.
Preparation of lens homogenates. Lenses were removed from the eyeball right after decapitation of animals (which was carried out under light ether anesthesia) via a cut along the equatorial region for removal of cornea and vitreous body. The isolated lenses were initially placed into liquid nitrogen and then kept at -70°C; before analysis, lenses were homogenized in 1 ml of cold (0°C) 0.01 M phosphate buffer (pH 7.4).
Determination of GSH content in lenses. GSH content was determined by the method of Ellman [19] using 76 lenses from Wistar and OXYS rats at the age of 2, 6, 13, 18, and 24 months. The number of animals in each group varied from 4 to 10. Homogenate was deproteinized by precipitation in 20% TCA followed by centrifugation at 6600g for 15 min. Protein free supernatant (600 µl) was mixed with 300 µl of 0.4 M Tris-HCl buffer, pH 8.9, and then 60 µl of 0.01 M 5,5´-dithiobis-2-nitrobenzoic acid in ethanol was added. Changes in optical density were registered at 412 nm versus a reagent control 30 min after addition of the Ellman reagent. GSH concentration was determined using a calibration plot obtained using standard GSH solutions. Data are expressed per mg of protein.
Determination of total and insoluble protein content in lenses. Protein was determined by the method of Bradford using BSA as a standard. Insoluble lens proteins were obtained by centrifugation of homogenate at 6600g (4°C) for 60 min. Supernatant was removed, and the sediment was resuspended in 0.01 M phosphate buffer (pH 7.4). This suspension was centrifuged as above but for 30 min. Supernatant was controlled for absence of protein by measuring absorption at 280 nm, and the sediment was assumed to consist of insoluble proteins. Ratio of insoluble protein concentration in homogenate to total protein concentration was considered as a proportion of insoluble proteins.
Determination of tryptophan fluorescence of lens soluble proteins. Lens homogenates were centrifuged for 60 min at 6600g, 4°C. Supernatant (100 µl) was mixed with 900 µl of 0.01 M phosphate buffer, pH 7.4. Fluorescence intensity of the resulting solution was registered at excitation and emission wavelengths of 295 and 330 nm, respectively. The were expressed per gram of protein. These experiments were carried out using 52 Wistar and OXYS rats at the age of 3, 13, and 24 months. The number of animals in each group varied from 6 to 10.
Study of crystallin gene expression. This work involved 39 Wistar and OXYS rats at the age of 3 and 14 months. The number of animals in each group varied from 6 to 10.
RNA isolation. Total cell RNA was isolated from rat lens by the phenol-chloroform method. A tissue sample was placed into water-saturated phenol (pH 7.0; 10 volumes/g tissue) with addition of 0.5% SDS (five volumes/g tissue); then the tissue was homogenized for 15 min. After addition of 0.1 volume of 2 M Na-acetate, pH 4.2, the tissue was homogenized again, left for 10 min, and the chloroform extraction was carried out. Supernatant was mixed with 2.5 volumes of 96% ethanol and kept at -70°C for 2 h. Then the mixture was centrifuged (15 min at 13,000 rpm in an Eppendorf 5414 centrifuge (Germany)), and the sediment was dried and dissolved in 25 µl of H2O. The amount of isolated RNA was evaluated by means of electrophoresis of 1 µl of RNA in 1% agarose gel. RNA content was determined in each sample spectrophotometrically at 260 nm and also by absorbance ratios 260/280 nm and 260/320 nm. RNA was kept at -70°C. Contaminations of genomic DNA were removed by treatment with DNase I (Promega, USA) following supplier's recommendations and then repeated RNA extraction by the phenol-chloroform mixture and pure chloroform followed by subsequent sedimentation with ethanol as described.
Reverse transcription. RNA (10 µg) and random hexamer primers (0.5 µg) were mixed in 11 µl of water. After RNA denaturation (65°C for 5 min) and primer annealing (37°C for 5 min) a mixture with reverse transcriptase (19 µl) was added. The final solution contained a buffer for reverse transcriptase (20 mM Tris-HCl, pH 8.3, 10 mM DTT, 100 mM KCl, 5 mM MgCl2), 500 µM deoxynucleoside triphosphates, and 40 U of MoMLV reverse transcriptase (Biosan, Russia). cDNA synthesis was carried out at 37°C for 1 h, 42°C for 30 min, 50°C for 10 min. The enzyme was inactivated by heating this mixture at 75°C for 5 min. For subsequent PCR we used of 0.25-0.50 µl of the resulting cDNA.
Preparation of “standard” cDNA. Aliquots (3 µl) from all cDNA samples were mixed and the “average” solution was used for preparation of calibration curves, which were used for determination of relative cDNA level for genes of interest and a reference gene in experimental samples.
Real time PCR. Expression of cryaa and cryab genes was determined by real time PCR in the presence of the SYBR Green I dye (Molecular Probes, USA) using an iCycler iQ4 real-time PCR detection system (Bio-Rad Laboratories, USA). The housekeeping gene Rpl 30 (encoding large ribosomal subunit protein 30) was used as a reference gene. The following primers were used: Rpl-30 5´-ATG GTG GCT GCA AAG AAG AC-3´ and 5´-CAA AGC TGG ACA GTT GTT GG-3´; Cryaa 5´-AGC CGA CTG TTC GAC CAG TTC-3´ and 5´-AAC TTG TCC CGG TCA GAT CG-3´; Cryab 5´-CTT CGG AGA GCA CCT GTT GG-3´ and 5´-GAG AGA AGT GCT TCA CGT CCA-3´. The reaction mixture (final volume of 20 µl) contained the standard PCR buffer (67 mM Tris-HCl, pH 8.9, 16 mM (NH4)2SO4, 0.01% Tween-20, 10 mM â-mercaptoethanol), 3 mM MgCl2, 0.2 mM dNTPs, SYBR Green I (1 : 20,000 dilution), 150 nM primers, and 0.4 U of Taq polymerase (Institute of Cytology and Genetics).
Reaction was carried out under the following conditions: heating at 95°C for 3 min, five “long” cycles: denaturation at 95°C, 30 sec, annealing - 30 sec, elongation at 72°C - 60 sec; then there were 35 main cycles: denaturation - 20 sec, annealing - 20 sec, elongation at 72°C - 30 sec, data collection by fluorescence for Rpl30 at 84°C - 30 sec, data collection by fluorescence for genes of interest (Cryaa and Cryab at 87°C) - 10 sec. After completion of PCR, the melting curves for specificity control were recorded. In each experiment samples of investigated cDNA were placed with primers for a gene of interest (four repeats per cDNA sample) on one plate; similar samples with primers for the reference gene (also four repeats); “standard” cDNA diluted from 1 : 3 to 1 : 243 with the same primers (2-3 repeats). For each cDNA sample, PCR was repeated at least twice. Initial level of investigated cDNA was determined by standard calibration curves (versus “standard” cDNA) and this value obtained for each gene of interest was referred to the amount of the reference gene cDNA; thus differences in expression of investigated genes between strains of rats and also age-related differences were determined [20].
The content of secondary LPO products (MDA and other ketone compounds) was determined spectrophotometrically by reaction with 2-thiobarbituric acid [21] in blood serum of 52 Wistar and OXYS rats at the age of 2, 6, 13, and 24 months.
Statistical treatment of results. All statistical calculations were made using the software package Statistica 6.0 (Statsoft, USA) using factor dispersion analysis (ANOVA/MANOVA) and Newman-Keul's post hoc test for comparison of group mean values. Genotype and age of animals were considered as independent factors. In all cases, results were considered as statistically significant at p < 0.05.
RESULTS
Biomicroscopic analysis of age related changes in lenses. Ophthalmoscopic examinations have shown that at the age of 6 months 5% of Wistar rats have weak lens opacity, and at the age of 12 and 24 months 20 and 80% of animals, respectively, have cataract. Changes in 65% of eyes of two-year-old Wistar rats corresponded to grade 1 (very light cortical or nuclear opacity in the lens). In 15% of eyes, there were marked zones of opacity corresponding to grade 2 (Fig. 1a).
No pathological changes were found in lenses of 3-week-old OXYS rats, but 20% of 1.5-month-old animals had initial signs of cataract (Fig. 1b). At the age of 3 months, changes in lenses were found in 90% of OXYS rats, and in 6-month-old animals morbidity reached 100%; however, more than half of the animals were characterized by lens changes corresponding to grade 1 and manifested by zonal cortical or nuclear opacities. At the age of 12 months, the number of animals with marked pathological changes increased, but only in individual cases we observed grade 3 cataract with opacity of all lens layers. These changes increased with age and in 24-month-old rat lens changes corresponded to grade 1 in 11% of animals, grade 2 in 47% of animals, and grade 3 changes with total loss of lens transparency were found in 42% of animals.Fig. 1. Distribution of eyes of Wistar (a) and OXYS (b) rats depending on age and manifestation of pathological changes in lenses: 1) without changes; 2-4) grades 1, 2, and 3, respectively.
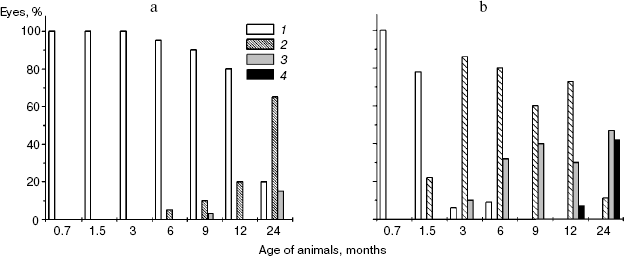
Thus, the dynamic changes of lens transparency suggest that manifestation of initial stages of cataract appears in OXYS rats in the period from 1.5 to 3 months. The development of later stages of cataract predominates in rats from 12 months and older.
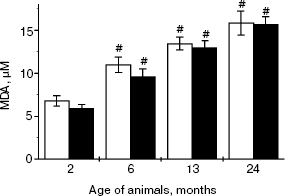
Content of lipid peroxidation products in blood serum of OXYS and Wistar rats. Dispersion analysis has shown age related increase in the content of LPO products in rat serum (F3,49 = 67.35, p < 0.000). In 24-month-old rats of both strains, the content of LPO products was more than 2-fold higher than in 2-month-old rats (Fig. 2). This parameter did not depend on genotype. In this study, we did not find any interstrain differences in content of serum LPO products either at the period of appearance of first cataract signs or at the period of marked pathological changes.
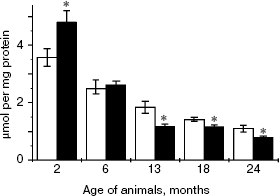
GSH content in lenses of OXYS and Wistar rats. Figure 3 shows the age-related decrease in lens GSH content in rats of both strains (F5,66 = 51.8, p < 0.001). At the age of 2 years, it becomes 4.5-fold lower than at the age of 2 months. Dispersion analysis did not reveal genotype effect on the GSH content in lenses of these animals, but there was interaction between the factors “age” and “genotype” (F5,66 = 5.04, p = 0.0005). Planned comparisons have shown that interactions between these factors are determined by age-related changes in the GSH content between Wistar and OXYS rats. At the age of 2 months the GSH content was 33% lower in OXYS rats than in control Wistar rats (p < 0.020). Interstrain differences were absent in 6-month-old rats, whereas at the age of 13, 18, and 24 months the GSH content was lower in OXYS rats compared with Wistar rats (p < 0.001).Fig. 2. Content of lipid peroxidation products in serum of Wistar and OXYS rats of various age. # Statistically significant differences versus 3-month-old animals of the same strain.
Thus, in OXYS rat appearance of the first clinical signs of cataract occurs under conditions of increased GSH content. The stages of developed cataract are characterized by decreased GSH content.Fig. 3. Content of reduced glutathione in lenses of Wistar (white columns) and OXYS (black columns) rats of various age. * Statistically significant interstrain differences.
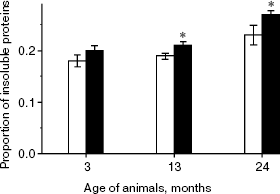
Oxidative modification of lens proteins of OXYS and Wistar rats. The decrease in solubility of lens protein associated with their oxidative modification is a typical sign of age-related changes and the development of cataract. Our studies have shown (Fig. 4) an age-related increase in the proportion of lens insoluble proteins in rats of both strains (F2,40 = 10.77, p < 0.0002). In 24-month-old Wistar rats it was 18% higher than in 3-month-old rats of the same strain (F2,14 = 5.22, p < 0.038), and in the corresponding groups of OXYS rats it was higher in the older group by 26% (F2,14 = 8.11, p < 0.013). However, insoluble protein content also depended on genotype, and proportion of insoluble proteins was higher in OXYS rat than in Wistar rats lenses (F2,40 = 10.50, p < 0.002). Nevertheless, paired comparison revealed statistical significance of these interstrain differences only in 13- and 24-month-old rats, when the proportion of insoluble proteins in OXYS rat lenses was 15% (p < 0.041) and 19% (p < 0.026) higher than in Wistar rats.
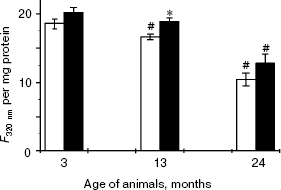
One reason related to oxidative stress-associated lens protein aggregation and the decrease in their solubility is the decrease in ultraviolet filtration efficiency, which is determined by tryptophan and its derivatives. Our studies have shown age-related decrease in the level of tryptophan fluorescence of soluble proteins (F2,40 = 32.8, p > 0.000). At the age of 2 years, it was 44% lower in Wistar rats and 36% lower in OXYS rats than in corresponding 3-month-old animals. The parameter depends on genotype: dispersion analysis has shown that in OXYS rats the level of soluble protein tryptophan fluorescence is higher than in Wistar rats (F1,40 = 6.93, p = 0.012). However, paired comparisons showed statistical significance of changes only at the age of 13 months (Fig. 5).Fig. 4. Content of insoluble proteins in lenses of Wistar (white columns) and OXYS (black columns) rats of various age. * Statistically significant interstrain differences.
Thus, at the age of 3 months, when lens changes become notable in 90% of OXYS rat eyes, the proportion of insoluble proteins and intensity of tryptophan fluorescence of soluble lens proteins remains the same as in Wistar rats. Moreover, in 13-month-old OXYS rats with developed stages of cataract the intensity of tryptophan fluorescence was even higher than in Wistar rats of the same age.Fig. 5. Intensity of tryptophan fluorescence of soluble lens proteins of Wistar (white columns) and OXYS (black columns) rats of various age. Here and in Fig. 6: #, statistically significant differences versus 3-month-old animals of the same strain; *, statistically significant interstrain differences.
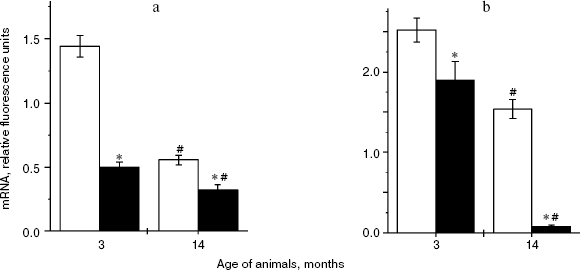
Changes in lens α-crystallin gene expression in Wistar and OXYS rats. There was an age-related decrease in αA-crystallin gene expression in both strains of rats (F1,33 = 101.2, p < 0.001). At the age of 14 months, this parameter was 2.9-fold (p < 0.001) and 1.7-fold (p < 0.001) lower in Wistar and OXYS rats, respectively, compared with corresponding 3-month-old animals. However, in the period of active cataractogenesis at the age of 3 months αA-crystallin gene expression in OXYS rats was 3-fold lower than in corresponding Wistar rats, and at the age of 14 months expression of this gene was 1.7-fold lower in OXYS rats than in Wistar rats of the same age (Fig. 6a). Thus, our study has demonstrated significant interstrain differences in αA-crystallin gene expression (F1,33 = 101.2, p < 0.001).
αB-crystallin gene expression (Fig. 6b) also exhibited age-related decrease (F1,22 = 106.0, p < 0.000) and genotype dependence: in OXYS rats this parameter was lower than in Wistar rats (F1,33 = 58.6, p < 0.000). In Wistar rats αB-crystallin gene expression was 1.6-fold lower in 14-month-old animals than in 3-month-old animals (p < 0.003), whereas in 14-month-old OXYS rats this parameter was 27-fold lower than in 3-month-old rats of the same strain (p = 0.000). At the age of 3 months, the interstrain difference was only 25% (p = 0.051), whereas at the age of 14 months αB-crystallin gene expression in OXYS rat lenses was 21-fold lower than in Wistar rats (p = 0.000).Fig. 6. Age-related changes in expression of αA-crystallin (a) and αB-crystallin (b) in lenses of Wistar (white columns) and OXYS (black columns) rats.
DISCUSSION
Our ophthalmoscopic examinations revealed two critical periods in the cataract development of OXYS rats. The first one (age from 1.5 to 3 months) is associated with appearance of primary changes. During this period cataract morbidity in OXYS rats increases from 20 to 90%, but manifestations of pathological changes in lenses correspond to early stages of this disease, when people do not notice changes in the acuteness of vision. In Wistar rats, such stage of morbidity was detected at the age of 24 months (Fig. 1). In OXYS rats cataract actively developed and at the age of 12-14 months it reached stages suggesting significant deterioration in the acuteness of vision. Thus, formation of well-developed pathological changes occurs during the age period of 12-14 months, and we consider it as the second critical period in the cataract development in OXYS rats.
Senile cataract is a multifactorial disease; it pathogenesis is closely associated with oxidative stress followed by accumulation of oxidative damage to macromolecules, which occur under conditions of reduced GSH content in lenses [22]. In this connection our results appear to be rather unexpected (at first glance): in OXYS rats active cataractogenesis occurs at higher levels of lens GSH and soluble protein tryptophan fluorescence than in Wistar rats. No interstrain changes (Wistar versus OXYS rats) were found in serum content of LPO products; this parameter is commonly used in clinical practice and experimental studies as the marker of oxidative stress for diagnostics of systemic changes of oxidative stress parameters in the whole body. Interestingly, the content of LPO products directly assayed in lenses of 3-month-old Wistar and OXYS rats was also indistinguishable [23].
Thus, at the early stages we did not observe any signs of exhaustion of the antioxidant system; moreover, we did observe its activation (before subsequent decrease). The increase in GSH level accompanied by its subsequent decrease was also demonstrated in the case of cataract induced by whole-body irradiation [24, 25]. The lens is characterized by a high level of antioxidants and GSH and enzymes of the glutathione system are the most important antioxidants. The GSH content in lens epithelium is 10-fold higher than in other mammalian tissues. Long-term exposure of the antioxidant defense system to oxidative stress may cause its exhaustion (and the decrease of GSH level) [26]. No data are available on the human antioxidant defense system in human lenses during early stages of cataract development. Most studies consider only two lens states: transparent and cataract (very often without indications of degree and localization of opacity). Analysis of our data and results obtained by other authors suggests that in human lenses the decrease of antioxidant system resources is a consequence but not a cause of this disease.
Thus, being a pathogenetic factor for the development of cataract, oxidative stress is not an etiological factor for cataract in OXYS rats: oxidative stress manifestation is typical for the progressing stages of this disease. The development of clinical manifestations at early stages of cataract is associated with changes in crystallin gene expression. Our experiments have shown that early stages of cataract development are characterized by significant reduction in αA- and αB-crystallin gene expression in OXYS rat lenses, which becomes more pronounced during disease progression. At the age of 3 months αA- and αB-crystallin gene expression was 3-fold and 25% lower than in corresponding control, respectively, whereas at the age of 14 months a 21-fold decrease in αB-crystallin gene expression was observed. Association of early signs of cataract development with the decrease in crystallin gene expression can be supported by the fact that cataract development in humans is accompanied by the decrease in expression of more than 1300 genes and more than 5-fold increase of expression in 241 genes. These include genes encoding structural proteins, chaperones, and proteins involved into cell cycle control [17].
Crystallins are the major structural lens proteins; they represent more than 90% of water-soluble proteins. High concentrations of these proteins determine high refractive index required for transparency of eye lens. Besides their structural role, α-crystallins also act as chaperones; they also prevent apoptosis and possibly regulate lens cell differentiation. The decrease in their expression may result in impairments of their density and structure of their packing; uneven crystallin packing may result in appearance of direct light scattering and aggregation of other crystallins, which are maintained the unoxidized state due to chaperone activity of α-crystallins [27].
Changes in gene expression during cataract development are associated with damage to lens epithelial cell layer or its enzymatic system. This is typical for senile cataract. Earlier using methods of light and electron microscopy it was demonstrated that cataract development in OXYS rats is also associated with dystrophic and atrophic changes in lens epithelium, insufficiency of its drainage and plasticity function [8]. Summarizing all the data obtained in this study as well as previous results, we conclude that cataract development in OXYS rats can occur due to changes in lens epithelium. Although reasons underlying these changes remain unknown, they cause the decrease in α-crystallin gene expression and possibly expression of other genes encoding lens proteins. These (still unknown) reasons also result in biochemical changes determining manifestation of oxidative stress observed at later stages of this disease.
This work was supported by the Russian Foundation for Basic Research (grants 08-04-00722 and 07-03-00253).
REFERENCES
1.Truscott, R. J. (2006) in Prevention and
Treatment of Age-Related Diseases (Rattan, S., and Kassem, M.,
eds.) Springer, N.Y., pp. 159-174.
2.Shinohara, T., White, H., Mulhern, M. L., and
Maisel, H. (2007) Medical Hyp., 69, 669-677.
3.Shang, F., Nowell, T., Jr., Gong, X., Smith, D. E.,
Dallal, G. E., Khu, P., and Taylor, A. (2002) Exp. Eye Res.,
5, 109-111.
4.Nishimoto, H., Uga, S., Miyata, M., Ishikawa, S.,
and Yamashita, K. (1993) Graefes Arch. Clin. Exp. Ophthalmol.,
231, 722-728.
5.Noriaki, N., Noriko, T., Akira, K., and Yoshimasan,
I. (2006) Biol. Pharm. Bull., 29, 236-248.
6.Mori, M., Li, G., and Abe, I. (2006) J. Clin.
Invest., 116, 395-404.
7.Solov'eva, N. A., Morozkova, T. S., and Salganik,
R. I. (1975) Genetika, 11, 63-71.
8.Kolosova, N. G., Lebedev, P. A., Aidagulova, S. V.,
and Morozkova, T. S. (2003) Byul. Eksp. Biol. Med., 136,
467-471.
9.Kolosova, N. G., Lebedev, P. A., Fursova, A. Zh.,
Morozkova, T. S., and Gusarevich, O. G. (2003) Usp. Gerontol.,
12, 143-148.
10.Marsili, S., Salganik, R. I., Albright, C. D.,
Freel, C. D., Johnsen, S., Peiffer, R. L., and Costello, M. J. (2004)
Exp. Eye Res., 79, 595-612.
11.Gusarevich, O. G., Kolosova, N. G., and Fursova,
A. Zh. (2005) Rus. Med. Zh., 4, 186-189.
12.Kolosova, N. G., Trofimova, N. A., Shcheglova, T.
V., and Sergeeva, S. V. (2005) Byul. Eksp. Biol. Med.,
139, 397-999.
13.Bobko, A. A., Sergeeva, S. V., Bagryanskaya, E.
G., Markel, A. L., Khramtsov, V. V., Reznikov, V. A., and Kolosova, N.
G. (2005) Biochem. Biophys. Res. Commun., 330,
367-370.
14.Sergeeva, S. V., Bagryanskaya, E. G., Korbolina,
E. E., and Kolosova, N. G. (2006) Exp. Gerontol., 41,
141-150.
15.Kolosova, N. G., Shcheglova, T. V., Sergeeva, S.
V., and Loskutova, L. V. (2006) Neurobiol. Aging,
27, 1289-1297.
16.Tsentalovich, Y. P., Snytnikova, O. A., Forbes,
M. D. E., Chernyak, E. I., and Morozov, S. V. (2006) Exp. Eye
Res., 83, 1439-1445.
17.Hawse, J. R., Hejtmancik, J. F., Huang, Q.,
Sheets, N. L., Hosack, D. A., Lempicki, R. A., Horwitz, J., and
Kantorow, M. (2003) Molecular Vision, 9, 515-537.
18.Babizhayev, M. A., Deyev, A. I., Yermakova, V.
N., Brikman, I. V., and Bours, J. (2004) Drugs R. D., 5,
125-139.
19.Ellman, G. L. (1959) Arch. Biochem.
Biophys., 82, 70-77.
20.Esterbauer, H., and Cheeseman, K. H. (1990)
Meth. Enzymol., 186, 407-420.
21.Nolan, T., Hands, R. E., and Bustin, S. A. (2006)
Nature Protocols, 1, 1559-1582.
22.Vinson, J. A. (2006) Pathophysiology,
13, 151-162.
23.Kolosova, N. G., Fursova, A. Zh., Lebedev, P. A.,
and Gusarevich, O. G. (2004) Oftalmol. Zh., 3,
237-242.
24.Aseychev, A. V., Sitarchuk, I. A., Deev, A. I.,
Aitmagambetov, M. T., and Vladimirov, Yu. A. (1994) in Study of
Kinetics of Accumulation and Molecular Mass of Lens Fluorophores during
Periods Preceding Cataract Development (Tikhonov, A. N.,
Sadovnichiy, V. A., et al., eds.) MSU Press, Moscow, pp. 22-27.
25.Deyev, A. I., Aseychev, A. V., Sitartchuk, I. A.,
Fedorenko, B. S., and Vladimirov, Yu. A. (1999) in Ocular Radiation
Risk Assessment in Population Exposed to Environmental Radiation
Contamination (Junk, A. K., et al., eds.) Kluwer Academic
Publishers, Dorbrecht-Boston-London, pp. 81-88.
26.Ferrer, V., Gasca, E., Sastre, J., and Pallardo,
F. V. (1990) Biochem. J., 269, 531-534.
27.Andley, U. P. (2007) Progr. Retinal Eye
Res., 26, 78-98.