T-Cadherin Activates Rac1 and Cdc42 and Changes Endothelial Permeability
E. V. Semina1, K. A. Rubina2*, P. N. Rutkevich1, T. A. Voyno-Yasenetskaya3, Y. V. Parfyonova1, and V. A. Tkachuk2
1Institute of Experimental Cardiology, Cardiology Research Center, 3-ya Cherepkovskaya ul. 15a, 121552 Moscow, Russia; fax: (495) 414-67122Faculty of Fundamental Medicine, Lomonosov Moscow State University, Lomonosovskii pr. 31, Build. 5, 117192 Moscow, Russia; fax: (495) 932-9904; E-mail: rkseniya@mail.ru
3Department of Pharmacology, Illinois University, Chicago, USA; fax: (312) 996-1225
* To whom correspondence should be addressed.
Received October 2, 2008; Revision received November 20, 2008
In the present study, expression of T-cadherin was shown to induce intracellular signaling in NIH3T3 fibroblasts: it activated Rac1 and Cdc42 (p < 0.01) but not RhoA. T-Cadherin overexpression in human umbilical vein endothelial cells (HUVEC) using adenoviral constructs induced disassembly of microtubules and polymerization of actin stress fibers, whereas down-regulation of endogenous T-cadherin expression in HUVEC using lentiviral constructs resulted in microtubule polymerization and a decrease in the number of actin stress fibers. Moreover, suppression of the T-cadherin expression significantly decreased the endothelial monolayer permeability as compared to the control (p < 0.001).
KEY WORDS: T-cadherin, Rho GTPases, endothelial cell permeability, microtubules, actinDOI: 10.1134/S0006297909040026
Abbreviations: α-GAPDH, glyceraldehyde phosphate dehydrogenase; GFP, green fluorescent protein; HUVEC, human umbilical vein endothelial cells; shRNA, short hairpin RNA; siRNA, small interfering RNA; SRE, serum response element.
Cadherins form a superfamily of molecules responsible for
Ca2+-dependent homophilic cell–cell adhesion.
“Classical” cadherins have an extracellular part with a
specific five-domain organization and transmembrane and cytoplasmic
parts, the cytoplasmic part interacting with components of the
cytoskeleton and providing for formation of strong cell–cell
contacts [1]. T-Cadherin is an atypical member of
the cadherin superfamily. The T-cadherin structure includes an
extracellular part specific for “classical” cadherins [2], but lacks transmembrane and cytoplasmic domains,
and T-cadherin is membrane-anchored via glycosylphosphatidylinositol
[3]. The absence of a cytoplasmic part and
T-cadherin localization in lipid rafts [4] suggest
that T-cadherin is unlikely to mediate formation of stable
cell–cell contacts, but rather is involved in intercellular
signaling [4-6].
Because T-cadherin is located on the leading edge of migrating endothelial cells [7], in the growth cone of motoneuronal axons spreading towards their targets [8, 9], and also is involved in the growth of small vessels and capillaries in the course of neoangiogenesis and tumor angiogenesis [10, 11], it was suggested to be a navigating receptor. The mechanism responsible for the oriented growth of vessels and nerves and for cell migration is based on a homophilic binding of T-cadherin molecules on the surface of migrating cells interacting with their environment [3, 10, 12].
In model in vitro experiments the interaction of T-cadherin molecules on the surface of endothelial cells resulted in activation of RhoA and Rac1 signaling pathways, changes in the actin cytoskeleton organization, and replacement of the normal cellular phenotype by a promigrating one [13]. Moreover, the ability of T-cadherin-overexpressing endothelial cells to adhere and spread over a substrate containing recombinant T-cadherin was significantly decreased compared to the control [12]. But it should be noted that these data were mainly obtained in studies of the influence of T-cadherin on in vitro migration, proliferation, and adhesion of endothelial cells.
Based on earlier results obtained in our laboratory, it was suggested that T-cadherin should be involved not only in the de novo growth of vessels and migration of endothelial cells. Normally, T-cadherin is expressed in endothelial and smooth muscular cells and pericytes of small and large vessels [14], thus T-cadherin is likely to also play an important role in functioning of mature stable vessels. In the present work the role of T-cadherin in the functional activity of endothelial cells and changes in the cell phenotype during formation of the endothelial monolayer was studied. The expression of T-cadherin was found to influence permeability of the endothelial monolayer, and T-cadherin was shown to be involved in activation of intracellular signaling via LIMK1, Rac1, and Cdc42 GTPases, whereas changes in the T-cadherin expression led to reorganization of the actin and microtubular cytoskeleton.
MATERIALS AND METHODS
Human umbilical vein endothelial cells (HUVEC) of the 2nd passage (Cambrex, USA) and the mouse fibroblast cell line NIH3T3 (ATCC No. CRL-1658) were used. HUVEC were cultured in complete EGM-2 medium (Cambrex); the NIH3T3 cells were cultured in DMEM medium (Gibco, USA) supplemented with penicillin (0.1 mg/ml), streptomycin (0.1 mg/ml), and 10% fetal calf serum. Electrophoresis and immunoblotting were performed using reagents from Bio-Rad Laboratories (USA). Primary antibodies to T-cadherin (ProSci, USA), phosphorylated LIMK1 kinase (Cell Signaling Technology, USA), c-Myc epitope (Santa Cruz Biotechnology, USA), α-tubulin (Sigma, USA), RhoA, Rac1, and Cdc42 GTPases (Santa Cruz Biotechnology), and glyceraldehyde phosphate dehydrogenase (α-GAPDH) (Sigma) were used, as well as secondary antibodies conjugated with fluorochrome AlexaFluor594 or AlexaFluor488, and phalloidin conjugated with AlexaFluor594 (Molecular Probes, UK).
Cultivation and transfection of eucaryotic cells. Cells were plated into culture flasks (104 cells/cm2) and cultured in a CO2 incubator at 37°C. To overexpress T-cadherin in the NIH3T3 cells, a plasmid containing T-cadherin cDNA (pcDNA3.1/T-cad) created earlier in our laboratory [15] or a control plasmid pcDNA3.1 (Invitrogen, USA) were used. On determination of SRE (serum response element) activity, the NIH3T3 cells were transfected with plasmids pcDNA3.1/T-cad and pcDNA3.1, with pCMV-β-Gal plasmid (Clontech, USA) to express β-galactosidase, and with a plasmid to express luciferase and SRE-SRE.L (Stratagene, USA). On determination of SRE activation, a plasmid containing the p114RhoGEF gene, which controls guanidine metabolism and activates Rho GTPases, was used as a positive control. Activities of Rho GTPases were suppressed using plasmids carrying dominant negative constructs RhoN17, RacN17, and Cdc42N19 for RhoA, Rac1, and Cdc42, respectively. To assess the activation of Rho GTPases by pull-down assay with Sepharose, the NIH3T3 cells were transfected with plasmids carrying the genes of stably active GTPases: for RhoA – RhoV12, for Rac1 – RacV12, and for Cdc42 – Cdc42V12. To assess the influence of T-cadherin overexpression on LIMK1 activation, the NIH3T3 cells were co-transfected with plasmid pcDNA3.1/T-cad and a myc-LIMK1 plasmid encoding LIMK1 and c-myc-epitope to enhance endogenous expression of LIMK1 and to monitor the presence of the transgene in the transfected cells; the control cells were transfected with plasmids pcDNA3.1 and myc-LIMK1. The NIH3T3 cells were transfected using Lipofectamine2000TM reagent (Invitrogen) as recommended by the producer. To assess the influence of T-cadherin overexpression on organization of microtubules, HUVEC were co-transfected with pcDNA3.1/T-cad plasmid and a plasmid containing the gene encoding the green fluorescent protein (GFP) for visualization of transfected cells (pcDNA3.1/GFP); in control the cells were transfected with pcDNA3.1 and pcDNA3.1/GFP plasmids. To suppress the T-cadherin expression, the endothelial cells were co-transfected with small interfering RNAs (Dharmacon, USA) (siRNA/T-cad) and pcDNA3.1/GFP plasmid for visualization of the transfected cells; pcDNA3.1/GFP plasmid was used as a control. The endothelial cells were transfected with CytoPure-huv (Qbiogen, USA) according to the producer’s instructions. Expressions of T-cadherin, RhoA, Rac1, Cdc42, LIMK1, c-Myc, α-GAPDH, β-catenin, and VE-cadherin were assessed by immunoblotting using cell lysates as described in [6].
In vitro determination of endothelial monolayer permeability. The endothelial permeability was assessed as described in [16]. HUVEC of the 2nd passage were plated (105 cells per well) into the upper chamber onto a semipermeable membrane of transwell wells (Transwell®; Corning, USA) with pores 0.4 µm in diameter and membrane radius of 6.5 mm. Seventy-two hours later, on production of the cell monolayer, the upper chamber of the transwell wells was supplemented with a solution of dextran conjugated with fluorescent dye FITC (FITC-dextran; Sigma) at the final concentration of 10 µg/ml. After 60 min, a 20 µl aliquot was taken from the lower chamber, and intensity of the FITC fluorescence was measured at 525 nm. Samples for all subsequent determinations were taken every 60 min. The experiment was performed in four parallels and repeated five times. Data are presented as the mean ± standard error of the mean, p < 0.001.
Immunofluorescent staining of endothelial cells. HUVEC of the 2nd passage were cultured in a CultureSlideTM plate (Becton Dickinson, USA) up to monolayer formation and transferred onto serum-free medium EGM-2 4 h before the experiment. To stabilize microtubules, the HUVEC were stained with antibodies to α-tubulin along with an additional incubation in 2 µM taxol. The cells were fixed in 0.1% glutaraldehyde supplemented with 0.1 M sodium cacodylate. After several washings in Hanks’ buffer, the cells were incubated in 0.25% Triton X-100. Then the cells were incubated successively in 10% serum of the second antibody donor for 30 min to prevent nonspecific binding, then in solution of primary and secondary antibodies conjugated with AlexaFluor594 or AlexaFluor488 fluorochrome. After the washing, the cells were mounted on glasses in Mounting Medium VectashieldTM medium (Vector Laboratories Inc, USA). The staining was visualized with an inverted confocal microscope (Zeiss Axiovert LSM 200M) supplemented with an AxioCam HRc digital camera, and the image was analyzed using programs LSM Image Browser (Zeiss, Germany), MetaMorph 5.0 (Universal Imaging, USA), and Scion Image 4.0 (Scion Corporation, USA).
Measurement of SRE activity. Influence of the T-cadherin expression on activation of Rho GTPases was studied using NIH3T3 cells, which did not express T-cadherin. The NIH3T3 cells were co-transfected with plasmids pcDNA3.1/T-cad (to overexpress T-cadherin), SRE.L (to assess the SRE activation), and pCMV-β-Gal (to normalize to the transfection level). The activation of Rho GTPases in the cytoplasm (RhoA, Rac1, and Cdc42) is associated with SRE complex activation in the nucleus [17]. Transfection with a SRE.L plasmid carrying the genes of SRE and luciferase under the same promoter allowed us to assess activation of Rho GTPases by measuring the luciferase activity. The control cells were co-transfected with pcDNA3.1, SRE.L, and pCMV-β-Gal plasmids. The cells co-transfected with plasmids pcDNA3.1/T-cad, SRE.L, pCMV-β-Gal, and p114RhoGEF (a plasmid carrying the gene encoding a stably active factor of nucleotide metabolism responsible for activation of Rho GTPases) were used as a positive control. To suppress T-cadherin-mediated activation of SRE, the NIH3T3 cells were co-transfected with plasmids pcDNA3.1/T-cad, SRE.L, and pCMV-β-Gal, and with a plasmid carrying a negative dominant construct for inactivation of Rho GTPases (RhoN19, Rac1N17, and Cdc42N19 for RhoA, Rac1, and Cdc42, respectively). Twenty-four hours after the transfection, the cells were deprived for 4 h, lysed, and activities of luciferase and β-galactosidase were determined in the resulting lysates according to instructions of the producer (Promega, USA). The experiment was performed in five parallels and repeated five times. Data are presented as the means ± standard error of the mean, p < 0.01.
Isolation of active Rho GTPases (pull-down assay). Active Rho GTPases were isolated using Sepharose precipitation of glutathione-S-transferase (GST-pull-down assay) with subsequent immunoblotting of precipitated protein as described in [18]. The GST-pull-down assay is based on immobilization of GST-containing proteins (GST-proteins) onto glutathione-Sepharose. We have used proteins which are effectors of Rho GTPases and capable of binding active GTP-containing Rho GTPases. Based on the expressing vector pGEX-2T, two plasmids containing the PAK-binding domain (PBD) for active Rac1 and Cdc42 GTPases and the Rho-binding domain (RBD) for binding an active RhoA GTPase were created in the laboratory of Dr. M. A. Schwartz (Scripps Research Institute, La Jolla, CA, USA) [19]. During the subsequent transformation of the E. coli strain DH5 with corresponding plasmids, GST-proteins containing the PBD (GST-PBD) and RBD (GST-RBD) domains were isolated and purified. GST-proteins were immobilized overnight onto glutathione-Sepharose (Amersham, USA) at 4°C. The NIH3T3 cells were transfected with pcDNA3.1 and pcDNA3.1/T-cad plasmids, and also with plasmids expressing active Rho GTPases (RhoV12, RacV12, and Cdc42V12) as a positive control. Forty-eight hours after the transfection, the cells were lysed in lysing buffer (50 mM Tris (pH 7.4), 1% Triton X-100, 0.5% sodium deoxycholate, 500 mM NaCl, 10 mM MgCl2, protease inhibitors), and the lysates were incubated with GST-RBD- or GST-PBD-Sepharose at 4°C for 60 min. The Sepharose was precipitated by centrifugation, and the precipitates were incubated in a standard lysing Laemmli buffer to remove Sepharose. Active RhoA, Rac1, and Cdc42 GTPases were determined by electrophoresis in 14% polyacrylamide gel with subsequent immunoblotting in the presence of monoclonal antibodies specific for each GTPase. The total level of GTPases was determined in the lysate prepared as usual. Results of three independent experiments are presented.
Overexpression of T-cadherin in endothelial cells using adenovirus transduction. Overexpression of T-cadherin in HUVEC was obtained with constructs created by us on the basis of the AdEasyTM expressing system (Quantum Biotechnologies, USA). The resulting adenoviral construct provided highly efficient overexpression of T-cadherin in HUVEC. The T-cadherin overexpression in the transduced HUVEC was assessed by immunofluorescent staining and immunoblotting with antibodies to human T-cadherin. In the experiments, HUVEC of the 2nd passage were transduced with a virus encoding cDNA of human T-cadherin (pAd-T-cad) or with a control virus (pAd).
Suppression of T-cadherin expression in endothelial cells by siRNA using lentivirus transduction. The expression of T-cadherin in HUVEC was suppressed by siRNA using a pSIH1‑H1‑CopGFP lentiviral vector (System Bioscience, USA) prepared for expression of short hairpin RNAs (shRNA) and carrying the GFP-encoding gene as a marker of transduction. The sequence GGTGAGTGTCTTAGCATAT located in the 3′-non-translatable region of human T-cadherin mRNA and capable of being used as an effective target for RNA interference was chosen using a test-system from Mona Firm (Moscow, Russia). The pSIH1‑H1‑CopGFP‑shRNA/T-cad lentiviral construct encoding the hairpin RNA directed against T-cadherin mRNA (shRNA/T-cad) was packed into VSV‑G pseudotyped lentiviral particles (System Bioscience) and used for infecting HUVEC cells. The pSIH1‑H1‑CopGFP‑shRNA/Luc vector encoding shRNA against luciferase (shRNA/Luc) was used as a control construct. Down-regulation of the T-cadherin expression was confirmed by immunoblotting. The data were normalized by the α-GAPDH content in the cell.
Statistical processing of results. The data were analyzed using the Statistica 6.0 program. Results are presented as the mean values ± standard error of the mean. The differences were considered significant at p < 0.05.
RESULTS
T-Cadherin influences endothelial monolayer permeability. The influence of T-cadherin on in vitro endothelial permeability was assessed by measurement of the cell monolayer permeability for FITC-dextran molecules. Endogenous expression of T-cadherin in HUVEC was suppressed using siRNA. A lentiviral construct encoding shRNA against mRNA of T-cadherin (shRNA/T-cad) and a control construct (shRNA/Luc) encoding shRNA against mRNA of luciferase were packed in pseudoviral particles that were used for transducing HUVEC. Suppression of the T-cadherin expression (of both the mature form, Mr 95 kDa, and the precursor, Mr 130 kDa) was confirmed by immunoblotting 72 h later. The expression of T-cadherin in HUVEC transduced by the control construct shRNA/Luc was unchanged with respect to native HUVEC (Fig. 1a). Upon transduction, HUVEC were cultured up to monolayer formation, and then FITC-dextran solution was introduced into the upper chamber of transwell wells. Aliquots of the medium were taken from the lower chamber every 60 min, and the FITC fluorescence was measured. Two hours later, the permeability of the endothelial monolayer with the down-regulated T-cadherin expression (shRNA/T-cad) was 30% lower than in controls (shRNA/Luc and control) (Fig. 1b). During the experiment, the endothelial monolayer permeability displayed significant differences, and 4 h later the difference was 40%.
It was suggested that the decrease in endothelial monolayer permeability associated with the down-regulation of T-cadherin expression should be mediated by changes in the expression and/or location of VE-cadherin and β-catenin proteins responsible for the strong cell–cell adhesion of endothelial cells, because disorders in location of these proteins are known to destroy intercellular adhesion and enhance the endothelial monolayer permeability [16, 20].Fig. 1. Influence of T-cadherin on endothelial permeability. a) Analysis of T-cadherin expression in endothelial cells by immunoblotting: 130 kDa is a T-cadherin precursor, 95 kDa is mature T-cadherin. b) Assessment of the endothelial cell monolayer permeability by determination of FITC-dextran (FITC) fluorescence intensity. shRNA/T-cad are HUVEC transduced with a lentiviral construct down-regulating the T-cadherin expression; shRNA/Luc are HUVEC transduced with a control construct. Control are non-transduced HUVEC; p < 0.001.
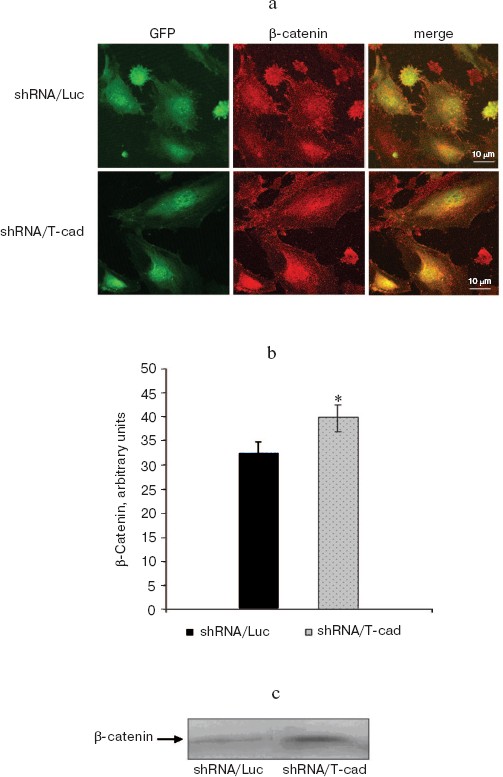
T-Cadherin changes expression of β-catenin but not of VE-cadherin. This hypothesis was tested on HUVEC with down-regulated endogenous expression of T-cadherin by lentiviral transduction. Locations and expressions of VE-cadherin and β-catenin were assessed by immunofluorescent staining combined with confocal microscopy (Fig. 2a; see color insert) and immunoblotting. A semiquantitative evaluation of the fluorescence intensities revealed (Fig. 2, a and b) a significant difference between the staining intensity with antibodies to β-catenin in the control (shRNA/Luc) and experimental cells (shRNA/T-cad). This difference was due to increased contents of β-catenin in the nucleus and cytoplasm of cells with the suppressed T-cadherin expression. These data were confirmed by immunoblotting (Fig. 2c): in lysates prepared from the HUVEC with the suppressed T-cadherin expression (shRNA/T-cad) the β-catenin content was higher than in the control cells (shRNA/Luc). The data were normalized by the total protein level. Thus, down-regulation of the T-cadherin expression (shRNA/T-cad) resulted in increase in the β-catenin content in the HUVEC.
However, no significant difference was found between the expression and location of VE-cadherin in the control HUVEC (shRNA/Luc) and HUVEC with the suppressed T-cadherin expression (shRNA/T-cad), although a semiquantitative analysis of fluorescence upon the staining with antibodies to VE-cadherin in these cells revealed a tendency for increase in its content in the zone of adhesive contacts (p > 0.05, data not presented).Fig. 2. T-Cadherin changes the expression of β-catenin. a) Immunofluorescent staining of HUVEC with antibodies to β-catenin. shRNA/T-cad are HUVEC transduced with a lentiviral construct to suppress the T-cadherin expression; shRNA/Luc are HUVEC transduced with a control construct. Both constructs contain the GFP-encoding gene (green fluorescence). The scale is 10 µm. b) Assessment of β-catenin fluorescence intensity in the cells transduced with shRNA/T-cad construct and in the control cells shRNA/Luc, p < 0.05. c) Assessment of the β-catenin content by immunoblotting in the control cells (shRNA/Luc) and the cells transduced with a lentiviral construct to suppress the T-cadherin expression (shRNA/T-cad).
T-Cadherin activates GTPases Rac1 and Cdc42 but fails to influence RhoA activity. Activation of Rho GTPases (RhoA, Rac1, and Cdc42) is known to regulate the endothelial barrier permeability, and this in turn influences the strength of cell–cell adhesion contacts, cytoskeleton condition, and activity of actomyosin complex [19, 21]. Based on data on the influence of T-cadherin on endothelial monolayer permeability, it was suggested that the T-cadherin effect should be mediated through activation of Rho GTPases. This hypothesis was tested by measuring SRE activity reflecting activation of Rho GTPases, and the activation of Rho GTPases was also determined by isolation of active Rho GTPases. The expression of T-cadherin was confirmed by immunoblotting, and its absence in the control cells was shown (Fig. 3a).
To detect the T-cadherin-mediated activation of SRE, NIH3T3 cells were co-transfected with plasmids pcDNA3.1/T-cad, SRE.L, and pCMV-β-Gal (pcDNA3.1/T-cad in Fig. 3b); the control cells were co-transfected with plasmids pcDNA3.1, SRE.L, and pCMV-β-Gal (pcDNA3.1). Activation of SRE on T-cadherin expression in the cells was comparable with that in the positive control (p114RhoGEF) (Fig. 3b); on co-expression of plasmids carrying the T-cadherin and p114RhoGEF genes the effect was additive—the SRE expression was 1.57-fold higher than on expression of each of these plasmids separately.Fig. 3. T-Cadherin activates SRE. a) Analysis of T-cadherin expression by immunoblotting in NIH3T3 cells transfected with pcDNA3.1/T-cad plasmid to express T-cadherin and with a control plasmid pcDNA3.1. b) Effect of T-cadherin overexpression in NIH3T3 cells (pcDNA3.1/T-cad) on SRE activation and activity of Rho GTPases; positive control (p114RhoGEF); dominant negative constructs (RacN17, Cdc42N19, and RhoN17), p < 0.01. Designations: Luc, luciferase; β-Gal, β-galactosidase.
All Rho proteins (RhoA, Rac1, and Cdc42) are known to influence SRE activity [19]. To determine the role of T-cadherin in the activation of each of these GTPases, we used plasmids carrying dominant negative constructs RhoN17, RacN17, and Cdc42N19 that specifically suppressed activities of RhoA, Rac1, and Cdc42, respectively. The co-expression of T-cadherin and RacN17 and of T-cadherin and Cdc42N19 was associated with partial suppression of SRE activation, as compared with the expression of T-cadherin alone. However, on co-expression of plasmids carrying the RhoN17 and T-cadherin genes the SRE activation corresponded to that on expression of T-cadherin alone and was comparable to the positive control (p114RhoGEF).
Based on these data, it was suggested that T-cadherin expression in NIH3T3 cells should mediate SRE activation, and this indicated that T-cadherin contributed to intracellular signaling with involvement of Rho GTPases and also that T-cadherin expression activated Rac1 and Cdc42 but failed to influence the RhoA signaling pathway.
To further confirm the specificity of the observed T-cadherin effects on activation of Rac1 and Cdc42, active forms of Rho GTPases were isolated using lysates of the NIH3T3 cells transfected with the T-cadherin-containing plasmid (pcDNA3.1/T-cad) or with the control plasmid (pcDNA3.1) by precipitation with Sepharose. The cells transfected with plasmids carrying genes of stably active forms of Rho GTPases (RhoV12, RacV12, and Cdc42V12) were used as a positive control. Upon isolation of active Rho GTPases, the T-cadherin expression was found to activate Rac1 and Cdc42 to the level comparable to that of the positive control (RacV12 and Cdc42V12) (Fig. 4, a and b), whereas no activation of RhoA was observed (Fig. 4c). And on the expression of T-cadherin in the NIH3T3 cells, the total protein content of Rac1, Cdc42, and RhoA was unchanged as supported by immunoblotting data. Thus, the T-cadherin expression in the NIH3T3 cells was shown to activate Rac1 and Cdc42 GTPases, but not influence the RhoA activity.
T-Cadherin phosphorylates LIMK1 and influences organization of microtubules in HUVEC. LIMK1 is an important component of signaling pathways with involvement of Rho GTPases, which regulates organization of microtubules and actin cytoskeleton and influences the endothelial monolayer permeability [22-24]. Inactive form of LIMK1 is co-located with microtubules in endothelial cells. Phosphorylation (activation) of LIMK1 is associated with dissociation of the LIMK1 complex with microtubules, disassembly of the microtubules, and formation of stress fibers, which leads to contraction of endothelial cells and increase in the endothelial barrier permeability [24].Fig. 4. Isolation of active forms of Rho GTPases by precipitation with Sepharose: a) Rac1; b) Cdc 42; c) RhoA.
To assess the influence of T-cadherin on the LIMK1 activity, NIH3T3 cells were co-transfected with pcDNA3.1/T-cad plasmid to express T-cadherin (or with pcDNA3.1 in the control) and with myc-LIMK1 plasmid to increase expression of LIMK1 kinase. The LIMK1 activity was assessed by immunoblotting. The T-cadherin expression in the NIH3T3 cells led to increase in the content of phosphorylated form of LIMK1 as compared to the control cells, whereas the total amount of LIMK1 assessed by content of the protein c-Myc was unchanged (Fig. 5a; see color insert).
Influence of T-cadherin on the microtubular cytoskeleton in HUVEC was studied using two models: the T-cadherin overexpression was obtained by transfecting HUVEC with pcDNA3.1/T-cad plasmid, and the T-cadherin native expression was suppressed by siRNA with short RNA oligonucleotides (siRNA/T-cad). Suppression of the T-cadherin expression in HUVEC was assessed by immunoblotting. Expression of both mature T-cadherin (Mr 95 kDa) and its precursor (Mr 130 kDa) was virtually completely suppressed 48 h later by 100 nM siRNA/T-cad (Fig. 5b).Fig. 5. T-Cadherin activates LIMK1 and changes polymerization of microtubules. a) NIH3T3 cells were co-transfected with pcDNA3.1/T-cad plasmid to express T-cadherin and with myc-LIMK1 plasmid to enhance LIMK1 expression, the control cells being transfected with pcDNA3.1 and myc-LIMK1 plasmids. The level of phosphorylated LIMK1 (p-LIMK) in the lysates was assessed by immunoblotting using antibodies to p-LIMK1, the transfection efficiency and total amount of LIMK1 protein were assessed using antibodies to c-Myc epitope. b) HUVEC were transfected with RNA oligonucleotides (in concentrations of 50 and 100 nM) to suppress the T-cadherin expression (siRNA/T-cad), and this suppression was confirmed by immunoblotting. c) Immunofluorescent staining of HUVEC with antibodies to α-tubulin (red fluorescence). HUVEC were co-transfected with pcDNA3.1/T-cad plasmid (to overexpress T-cadherin) and pcDNA3.1/GFP plasmid (to visualize transfected cells by green fluorescence) or with siRNA/T-cad (to suppress T-cadherin expression) and pcDNA3.1/GFP. The scale is 10 µm. d) Assessment of staining with antibodies to α-tubulin by the fluorescence intensity in HUVEC cells transfected with DNA3.1/T-cad plasmid to overexpress T-cadherin (to the left) or with siRNA/T-cad to suppress T-cadherin native expression (to the right); p < 0.05.
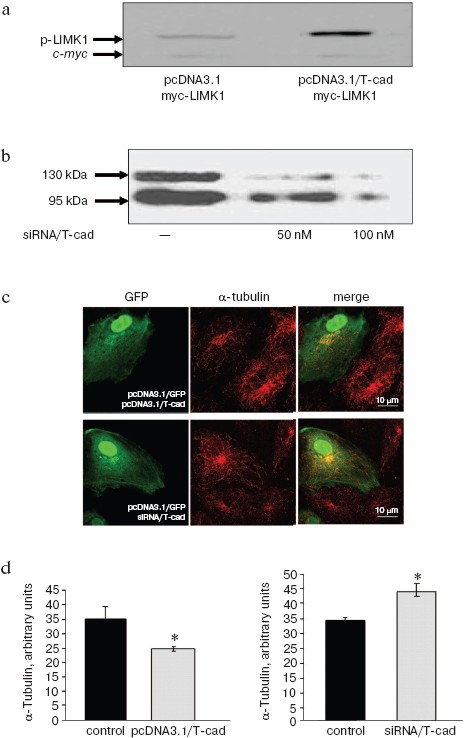
The effect of T-cadherin on the microtubular cytoskeleton in HUVEC was assessed by immunofluorescent staining of the microtubules with antibodies to α-tubulin. To enhance the native expression of T-cadherin, HUVEC were co-transfected with pcDNA3.1/T-cad and pcDNA3.1/GFP plasmids. In the GFP-expressing HUVEC, the staining intensity with antibodies to α-tubulin was assessed under conditions of transient transfection. To down-regulate the T-cadherin expression, HUVEC were simultaneously transfected with 100 nM of pcDNA3.1/GFP and siRNA/T-cad plasmids. The transient transfection of a mammalian cell culture is associated with a simultaneous occupation of transfected cell by many molecules of plasmid DNA – up to 100,000 molecules. Therefore, on co-transfection with a mixture of plasmids virtually any transfected cell displays a mixture of initial plasmids in the same proportion [25]. The immunofluorescent staining of HUVEC assessed with confocal microscopy revealed the influence of T-cadherin on organization of the microtubules: the T-cadherin overexpression caused disassembly of the microtubules, whereas down-regulation of the T-cadherin expression induced their polymerization. Figure 5c (upper panel) presents a characteristic pattern of the staining: the transfected cell displays expression of GFP (green fluorescence) and overexpression of T-cadherin, along with a decreased intensity of staining with antibodies to α-tubulin (red fluorescence) and lowered number of microtubules as compared to the surrounding non-transfected cells. A semiquantitative analysis of the fluorescence intensity using the MetaMorph program revealed that the T-cadherin overexpression was associated with a significantly decreased staining with antibodies to α-tubulin (Fig. 5d, to the left, p < 0.05). The lower panel in Fig. 5c presents the HUVEC cells, and one of the cells shows the T-cadherin expression suppressed using siRNA/T-cad (green fluorescence of GFP). This cell displays higher staining intensity with antibodies to α-tubulin (red fluorescence) and greater number of microtubules than the surrounding non-transfected cells. Semiquantitative analysis of the fluorescence intensity using the MetaMorph program revealed that down-regulation of the T-cadherin expression was associated with a significantly more intensive staining with antibodies to α-tubulin than in the control (Fig. 5d, to the right, p < 0.05).
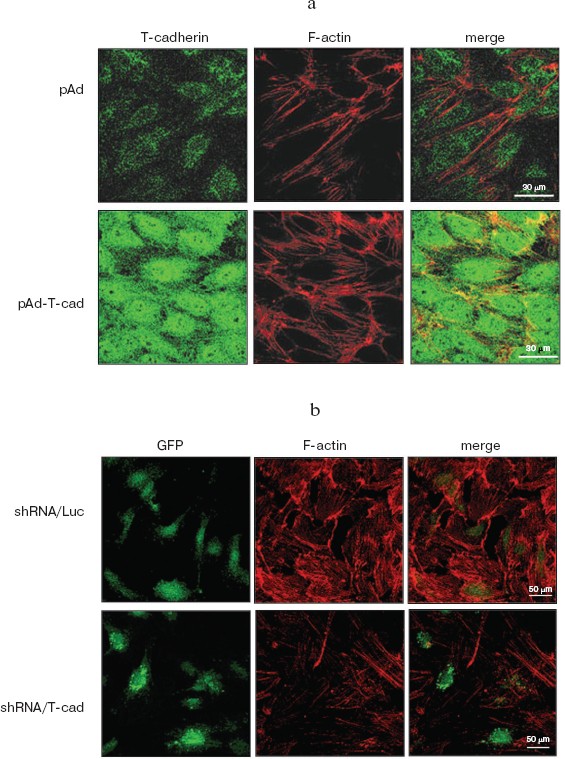
T-Cadherin influences assembly of actin stress fibers in HUVEC. The endothelial monolayer permeability directly depends on condition of the actin cytoskeleton—polymerization of actin stress fibers leads to activation of actomyosin complex, cell reduction, decrease in the strength of cell–cell contacts, and increase in the endothelial monolayer permeability [24]. To assess the influence of T-cadherin on the actin cytoskeleton in HUVEC, T-cadherin was overexpressed using adenovirus transduction or suppressed using lentivirus transduction. Immunofluorescent staining with fluorescein-labeled phalloidin, which detects actin filaments, allowed us to show that overexpression of T-cadherin (pAd-T-cad) in HUVEC increased polymerization of actin and formation of stress fibers as compared to the control cells (pAd) (Fig. 6a; see color insert), whereas suppression of the T-cadherin expression (shRNA/T-cad) lowered the number of actin stress fibers as compared to the control (shRNA/Luc) (Fig. 6b).
Thus, our data indicated that the T-cadherin expression influenced the endothelial monolayer permeability, and T-cadherin overexpression was associated with activation of the Rac1 and Cdc42 signaling pathways, phosphorylation of LIMK1 kinase, depolymerization of microtubules, and assembly of actin stress fibers, whereas suppression of T-cadherin expression induced polymerization of microtubules, disassembly of actin stress fibers, and decrease in the endothelial monolayer permeability.Fig. 6. Influence of T-cadherin expression on organization of the actin cytoskeleton in endothelial cells. Immunofluorescent staining of actin filaments in HUVEC with a fluorochrome-labeled phalloidin (red fluorescence). a) HUVEC were transduced with adenovirus to overexpress T-cadherin (pAd-T-cad) or with a control virus (pAd). The T-cadherin expression was assessed by immunofluorescent staining with antibodies to T-cadherin (green fluorescence). The scale is 30 µm. b) HUVEC were transduced with a lentiviral construct to suppress T-cadherin expression (shRNA/T-cad) or with a control construct (shRNA/Luc). Both constructs expressed GFP (green fluorescence). The scale is 50 µm.
DISCUSSION
The main function of endothelial cells is to maintain a selective permeability of the vascular wall that limits free exchange between blood and surrounding tissues. Such vasoactive substances as thrombin and histamine increase the endothelial monolayer permeability both in vivo and in vitro due to activation of intracellular signaling mediated by Rho GTPases that results in formation of actin stress fibers, phosphorylation of myosin light chains, activation of actomyosin contraction in endothelial cells, and disorders in the organization or functioning of adhesive cell–cell contacts [16, 19, 21, 23].
To elucidate a possible role of T-cadherin in regulation of the barrier function of endothelium a siRNA method was used, and down-regulation of the expression of T-cadherin in HUVEC was found to significantly decrease in vitro the endothelial monolayer permeability. It was suggested that this decrease upon suppression of the expression of T-cadherin in HUVEC should be associated with activation of the intracellular signaling mediated by Rho GTPases. Rho GTPases are signaling molecules responsible for regulation of many processes in the cell, including dynamic changes in the cytoskeleton, cell adhesion and mobility, permeability of the endothelial barrier, and integrity of cell–cell contacts, as well as gene transcription and cell proliferation [22, 23]. The hypothesis of involvement of Rho GTPases in T-cadherin-mediated signaling was tested using the NIH3T3 fibroblast cell line, which does not express T-cadherin, and the SRE activity was measured before and after the expression of T-cadherin in these cells. Because activation of Rho proteins (RhoA, Rac1, and Cdc42) in the cytoplasm is associated with activation of SRE complex in the nucleus [17], changes in the SRE activity allowed us to assess activation of Rho GTPases. We revealed SRE activation in the NIH3T3 cells upon the expression of T-cadherin, and this suggested activation of Rho GTPases. To assess a specific influence of T-cadherin on activity of each Rho GTPase, active forms of Rac1, Cdc42, and RhoA were isolated, and the T-cadherin expression in the NIH3T3 cells was shown to activate Rac1 and Cdc42 but fail to influence the RhoA signaling pathway. The literature data on the involvement of Rac1, Cdc42, and RhoA in regulation of the endothelial monolayer permeability are contradictory. On one hand, a certain level of Rac1 activity was shown to be necessary for maintaining stable cell–cell adhesion mediated by tight and cadherin-containing contacts [23]. On the other hand, although the Rac1 activation prevented assembly of actin stress fibers, it also caused disorders in the cell–cell adhesion in the endothelial cell monolayer [20, 23]. The activation of RhoA in endothelial cells led to formation of actin stress fibers, actomyosin contraction, and disassembly of cadherin contacts [23]. However, the activation of RhoA by bacterial toxins or a stably active RhoA form (RhoAV14) was insufficient for effective destruction of cell–cell contacts, and this indicated existence of additional signaling pathways regulating endothelial permeability [24]. The role of Cdc42 in regulation of the endothelial barrier permeability also remains unclear, although some literature data suggest that changes in the activity of Cdc42 do not influence the barrier function of the endothelium [23]. It seems that activation of specific GTPases and the further intracellular signaling depend on the cell type, experimental conditions, state of cells (either as a dense monolayer or producing new contacts), or whether cell adhesion processes or formation of cell–cell contacts is under study. For example, adhesion of the T-cadherin overexpressing HUVEC on a substrate containing recombinant T-cadherin was associated with intracellular signaling pathways through Rho/ROCK and Rac1 GTPases, and this resulted in changes in organization of the cytoskeleton, cell phenotype, and the cell de-adhesion from the substrate [12]. However, in the present work we have found that the expression of T-cadherin induces activation of Rac1 and Cdc42 but fails to influence the RhoA signaling pathway.
The strength of the endothelial barrier is known to directly depend on the condition of the cytoskeleton: depolymerization of microtubules is accompanied by polymerization of actin and formation of stress fibers, which increases the endothelial barrier permeability [22, 23, 26-28]. Endothelial cells possess a common mechanism for regulation of actin polymerization and depolymerization of microtubules: serine-threonine LIMK1 kinase is an important connecting link between Rho GTPases, actin cytoskeleton, and microtubules [22-24]. Inactive form of LIMK1 is co-located with microtubules. Phosphorylation of LIMK1 results in its deactivation, and this is accompanied by dissociation of the LIMK1 complex from microtubules, disassembly of microtubules, stabilization of actin, and formation of stress fibers. These changes in the cytoskeletal organization of endothelial cells are accompanied by changes in the cell phenotype, cell contraction, and increase in the endothelial barrier permeability [26]. Using the NIH3T3 cell line, we for the first time have shown that the expression of T-cadherin leads to activation of LIMK1. These results are in correlation with our data obtained on HUVEC. The overexpression of T-cadherin in HUVEC is associated with an increased formation of actin stress fibers and depolymerization of microtubules, whereas suppression of the T-cadherin expression is associated with reduction in the number of actin stress fibers, enhancement of polymerization of microtubules, and decrease in the endothelial monolayer permeability. Our data on the influence of T-cadherin expression on microtubules, actin stress fibers, and regulation of the endothelial permeability are consistent with data of A. Verin et al. that the endothelial monolayer strength directly depends on the microtubular and actin cytoskeleton of endothelial cells, which is physiologically important for functioning of vessels [27, 28].
To better elucidate mechanism of the influence of T-cadherin on the endothelial monolayer permeability, we have analyzed expression and location of VE-cadherin and β-catenin proteins that are responsible for a strong cell–cell adhesion in endothelial cells. VE-Cadherin is a specific protein of adhesive contacts in endothelial cells that provides for relations with the actin cytoskeleton via interaction with catenins [16]. Destruction of the VE-cadherin complex with β-catenin by phosphorylation of proteins within the complex or due to affecting their location in the places of cell–cell contacts results in destruction of the intercellular adhesion and increase in the endothelial monolayer permeability [16, 20]. The results of the present work have shown that suppression of the expression of T-cadherin in HUVEC associated with a decrease in the endothelial monolayer permeability for FITC-dextran molecules leads to a significant increase in the β-catenin content in the nucleus and cytoplasm of the cells. It seems that down-regulation of the expression of T-cadherin in endothelial cells is associated with activation of intracellular signaling pathways with involvement of β-catenin. The hypothesis about the involvement of β-catenin in T-cadherin-mediated signaling is in correlation with data obtained in the laboratory of Dr. T. Resink that have shown that, although T-cadherin overexpression does not change the total content of β-catenin in endothelial cells, it enhances the level of active β-catenin and its accumulation in the nucleus, where the latter interacts with Lef/Tcf transcription factors and activates expression of genes responsible for cell proliferation and regulation of the cell cycle [13].
Despite changes in the β-catenin content in HUVEC upon suppression of the expression of T-cadherin, we have not found significant differences in the content and location of VE-cadherin. Possibly, changes in the monolayer permeability in a dense culture of endothelial cells are regulated not by changes in the VE-cadherin location in the contact zone on the membrane surface but by changes in the functional activities of these contacts. This hypothesis is supported by data on the influence of activation of Rho/Rac proteins on location and maturation of cell–cell contacts during formation of endothelial and epithelial cell monolayers [21]. As differentiated from E-cadherin in epithelial cells, Rho/Rac proteins fail to influence the location of VE-cadherin in endothelial cells, although activation of Rho/Rac proteins results in rearrangements in the cytoskeleton. However, the endothelial monolayer permeability upon suppression of the expression of T-cadherin can be also changed via changes in organization of tight contacts.
The results of the present work are summarized in the scheme (Fig. 7; see color insert), and T-cadherin is concluded to be involved in activation of the intracellular signaling systems. Overexpression of T-cadherin activates Rac1 and Cdc42 GTPases, does not influence the Rho activity, but increases phosphorylation of LIMK1 kinase, which induces rearrangements of actin and microtubular cytoskeleton that in turn influences the endothelial monolayer permeability.
This work was supported by the Welcome Trust grant No. 075154 and by the Federal Purpose Program “Studies and Elaborations in Priority Lines of the Russian Complex in Science and Technology for 2007-2012” (No. 8, code 2008-2-1.2-06-10), topic “Elaboration of approach for down-regulation of angiogenesis by expressing on cell surface of navigating receptor T-cadherin and other surface receptors inhibiting vascular growth in tumors” (State contract No. 02.512.11.2222).Fig. 7. T-Cadherin activates intracellular signaling with involvement of Rac1 and Cdc42 GTPases, phosphorylates LIMK1, influences polymerization of microtubules and assembly of actin stress fibers, and regulates endothelial permeability. The expression of T-cadherin does not influence expression and location of VE-cadherin in the zone of cell–cell contacts, but down-regulation of T-cadherin expression increases β-catenin content in HUVEC.
REFERENCES
1.Foty, R. A., and Steinberg, M. S. (2004) Intern.
J. Dev. Biol., 48, 397-409.
2.George, S. J., and Beeching, C. A. (2006)
Atherosclerosis, 188, 1-11.
3.Vestal, D. J., and Ranscht, B. (1992) J. Cell
Biol., 119, 451-461.
4.Philippova, M. P., Bochkov, V. N., Stambolsky, D.
V., Tkachuk, V. A., and Resink, T. (1998) FEBS Lett.,
129, 201-210.
5.Rubina, K. A., and Tkachuk, V. A. (2004) Russ.
J. Physiol., 90, 968-986.
6.Rubina, K., Talovskaya, E., Cherenkov, V., Ivanov,
D., Stambolsky, D., Storozhevykh, T., Pinelis, V., Shevelev, A.,
Parfyonova, Y., Resink, T., Erne, P., and Tkachuk, V. (2005) Mol.
Cell Biochem., 273, 33-41.
7.Ivanov, D., Philippova, M., Allenspach, R., Erne,
P., and Resink, T. (2004) Cardiovasc. Res., 64,
132-143.
8.Fredette, B. J., and Ranscht, B. (1994) J.
Neurosci., 14, 7331-7346.
9.Fredette, B. J., Miller, J., and Ranscht, B. (1996)
Development, 122, 3163-3171.
10.Rubina, K., Kalinina, N., Potekhina, A.,
Efimenko, A., Semina, E., Poliakov, A., Wilkinson, D. G., Parfyonova,
Y., and Tkachuk, V. (2007)
[javascript:AL_get(this,%20'jour',%20'Angiogenesis.');
Angiogenesis], 10, 183-195.
11.Wyder, L., Vitaliti, A., Schneider, H., Hebbard,
L. W., Moritz, D. R., Wittmer, M., Ajmo, M., and Klemenz, R. (2000)
Cancer Res., 60, 4682-4688.
12.Philippova, M., Ivanov, D., Allenspach, I.,
Takuwa, Y., Erne, P., and Resink, T. (2005) FASEB J., 19,
588-590.
13.Ivanov, D., Philippova, M., Tkachuk, V., Erne P.,
and Resink, T. (2004) Exp. Cell Res., 293, 207-218.
14.Kudrjashova, E., Bashtrikov, P., Bochkov, V.,
Parfyonova, Y., Tkachuk, V., Antropova, J., Iljinskaya, O., Tararak,
E., Erne, P., Ivanov, D., Philippova, M., and Resink, T. J. (2002)
Histochem. Cell. Biol., 118, 281-290.
15.Philippova, M., Ivanov, D., Tkachuk, V., Erne,
P., and Resink, T. J. (2003) Histochem. Cell Biol., 120,
353-360.
16.Hordijk, P., Anthony, E., Mul, F., Rientsma, R.,
Oomen, L., and Roos, D. (1999) J. Cell Sci., 112,
1915-1923.
17.Hill, C. S., Wynne, J., and Treisman, R. (1995)
Cell, 81, 1159-1170.
18.Liu, G., and Voyno-Yasenetskaya, T. (2005) J.
Biol. Chem., 280, 39042-39049.
19.Ponimashkin, E. G., Profirovich, J., Vaskunaite,
R., Ritcher, D. W., and Voyno-Yasenetskaya, T. (2002) J. Biol.
Chem., 277, 20812-20819.
20.Braga, V. M., del Maschio, A., Machesky, L., and
Dejana, E. (1999) Mol. Biol. Cell, 10, 9-22.
21.Essler, M., Amano, M., Kruse, H.-J., Kaibuchi,
K., Weber, P., and Aepfelbacher, M. (1998) J. Biol. Chem.,
273, 21867-21874.
22.Bishop, A. L., and Hall, A. (2000) Biochem.
J., 348, 241-255.
23.Wojciak-Stothard, B., and Ridley, A. J. (2003)
Vasc. Pharmacol., 39, 187-199.
24.Vouret-Cravari, V., Bourcier, C., Boutler, E.,
and van Obberghen-Schilling, E. (2002) J. Cell Sci.,
115, 2475-2484.
25.Batard, P., Jordan, M., and Wurm, F. (2007)
Gene, 270, 61-68.
26.Gorovoy, M., Niu, J., Bernard, O., Profirovich,
J., Minshall, J., Neamu, R., and Voyno-Yasenetskaya, T. (2005) J.
Biol. Chem., 280, 26533-26542.
27.Birukova, A., Smurova, K., Birukov, K., Usatyuk,
P., Liu, F., Kaibuchi, K., Ricks-Cord, A., Natarajan, V., Alieva, I.,
Garcia, J. G. N., and Verin, A. D. (2004) J. Cell. Physiol.,
201, 55-70.
28.Bogatcheva, N., Adyshev, D., Mambetsariev, B.,
Moldobaeva, N., and Verin, A. (2007) Am. J. Physiol. Lung Cell. Mol.
Physiol., 292, 487-499.