Isotachophoresis of Nucleic Acids in Agarose Gel Rods
V. N. Kondratova, I. V. Botezatu, V. P. Shelepov, and A. V. Lichtenstein*
Blokhin Russian Cancer Research Center, Russian Academy of Medical Sciences, Kashirskoe Shosse 24, 115478 Moscow, Russia; fax: (495) 324-1205; E-mail: alicht@online.ru* To whom correspondence should be addressed.
Received April 8, 2009; Revision received May 15, 2009
A new method of electrophoresis (isotachophoresis in agarose gel rods) in which nucleic acid molecules are not separated but, oppositely, are brought together into one band, was elaborated. Heterogeneous in size DNA and RNA polymers present in a few milliliters of a solution at so low concentration that their isolation by other methods is hardly attainable and fraught with losses are brought together into one visible narrow band when put in a discontinuous electric field. Polynucleotides migrate in dilute (0.1%) semifluid agarose gel that permits easy quantitative isolation of the band of interest. Resulting DNA can be used directly in PCR. The suggested method for isolation of micro amounts of nucleic acids from dilute solutions can be applied to forensic and clinical research and cancer gene diagnostics by the analysis of fragmented circulating DNA from bodily fluids.
KEY WORDS: DNA isotachophoresis, circulating DNA, agarose gel, DNA isolation, PCRDOI: 10.1134/S0006297909110169
Abbreviations: BPB, bromophenol blue; ITP, isotachophoresis.
Recently DNA found in blood and urine as a result of cell demise has
become an object of genetic analysis [1]. The
investigation of circulating DNA has various diagnostic goals:
determination of mutant and aberrantly methylated specific sequences
indicating a growing tumor in an organism; monitoring disease progress
and sometimes therapeutic efficiency [2-6]; identification of embryo DNA in mother’s
blood or urine that can reveal the baby’s sex or congenital
defect at early stages of pregnancy [7, 8].
Gene diagnostics based on the circulating DNA is a promising and noninvasive approach [9-12]. The fact that this DNA is fragmented and in low concentration in biological fluids, however, is a problem for its isolation. At the same time, these factors have not been taken into account in the isolation methods (generally similar to isolation of high molecular weight tissue DNA). So, the common “glass milk” method of DNA sorption from solutions of chaotropic agents allows isolation of only a narrow spectrum of fragments (depending on the properties of the “glass”) because large molecules often bind irreversibly and small ones do not bind at all [10]. Another routine approach, ethanol precipitation, can lead to losses of small fragments. These problems can be more significant in the case of microRNA (22 nucleotides). They are also present in biological fluids and of great diagnostic significance as tumor markers [10, 13, 14].
The problem of quantitative isolation of the circulating DNA is particularly urgent in the light of attempts made today to identify their profile in healthy persons and in patients by full sequencing [15]. Some findings about differences in the sequences of the circulating and genomic DNA indicate nonrandom degradation of the genomic DNA in blood. This conclusion is valid, however, only when selective DNA losses during the isolation are excluded.
Since the content of nucleic acids in biological fluids varies over wide limits, a negative result in a search for specific sequences without adequate DNA output control can be either due to its absence in the analyzed sample or inefficiency of the isolation method. This diversity of problems on one hand and methods for their solution on the other hand [16] can explain, at least in part, significant differences in conclusions [17, 18].
The present work describes a method for quantitative isolation of micro amounts of nucleic acids (independent of their size) from dilute solutions that also allows visual control over the process.
MATERIALS AND METHODS
Clinical samples. Blood (~5 ml) and urine (~50 ml) of healthy controls and cancer patients (colorectal and pancreatic carcinomas) were obtained from Blokhin Cancer Research Center of the Russian Academy of Medical Sciences. To isolate plasma, blood was centrifuged for 10 min at 1500g at room temperature. EDTA was added to 10 mM concentration to the urine samples, and, to remove cells, they were centrifuged under the same conditions. Blood and urine plasma aliquots were kept at –60°C.
Sample preparation. Blood plasma was incubated overnight at 50°C with proteinase K (0.5 mg/ml) in solution of 1% sarcosyl, 1 mM Tris-HCl, pH 8.0, 5 mM EDTA and subjected to phenol deproteinization until the interphase was absent. Then the water phase was dialyzed against 10 mM Tris-HCl, pH 6.7, 1 mM EDTA (using dialysis tubing permeable for 14-16 kDa molecules) overnight. The urine was dialyzed without deproteinization under the conditions described above.
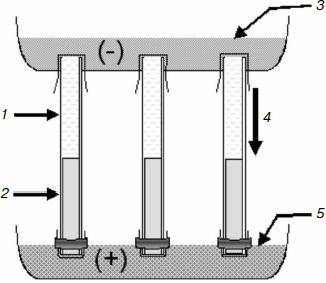
Isotachophoresis of nucleic acids in agarose gel rods. A BioRad (USA) Model 155 vertical electrophoresis apparatus designed for 18 rods was used. The upper chamber was filled with cathode buffer (12 mM Tris-β-alanine, pH 8.6, 1 mM EDTA) and the lower chamber was filled with anode buffer (200 mM Tris-HCl, pH 6.7, 1 mM EDTA) (Fig. 1). Quartz glass tubes (diameter 5 mm, length 12.5 cm) transparent for ultraviolet light were filled with 1.0-1.5 ml of 0.1% agarose gel (agarose UltraPure; Gibco, BRL, USA) prepared on anode buffer with ethidium bromide (0.5 µg/ml). The lower opening of the tube was closed with dialysis membrane and hermetically sealed with melted 1% agarose. About 0.5-1.5 ml of the dialyzed sample (deproteinized blood plasma or urine) containing 1/10 volume of loading buffer (120 mM Tris-β-alanine, pH 8.6, 0.03% bromophenol blue (BPB), and 5 µg/ml ethidium bromide) was layered on the semifluid gel. After fully filling the tube, the upper opening of the tube was closed with dialysis membrane to avoid the formation of air bubbles, and the tube was fixed in the vertical electrophoresis apparatus (Fig. 1). During electrophoresis that was carried out at 200 V and room temperature the BPB marker rapidly formed a narrow band in the gel (the process usually takes 30-40 min). Nucleic acids migrate just before the marker band. UV irradiation of the tube permits visualizing the band of interest, evaluating its intensity, and quantitatively isolating it under visual control. The semifluid consistency of the gel allows isolation of the band using a long needle, but extrusion of the gel from the tube by water pressure and cutting the slice (40-50 µl volume) appeared to be more useful. The gel slice was placed into a test tube, several times pipetted, and kept at –20°C. Before use, the sample was thawed for 5 min at 40°C and aliquots (5-10 µl) were added directly to the PCR reaction mixture in which the final agarose concentration was 0.01%.
Polymerase chain reaction. Because circulating DNA obtained from blood plasma is fragmented, short amplicons were studied. Amplification of protooncogene K-RAS2 fragments containing frequently mutating codons 12 and 13, i.e. the 87-bp-long (sense primer 5′-actgaatataaacttgtggtagttggacct, antisense primer 5′-gtccacaaaatgattctgaattagc; 35 cycles) and 157-bp-long (sense primer 5′-actgaatataaacttgtggtagttggacct, antisense primer 5′-tcaaagaatggtcctgcacc; 35 cycles), was performed in Mastercycler Gradient system (Eppendorf AG, Germany). The reaction was carried out in 25 µl of medium containing 5 µl DNA, 5 pmol of each primer (Syntol, Moscow), 200 µM of each dNTP, 1 unit Taq polymerase in buffer containing 16.6 mM (NH4)2SO4, 2 mM MgCl2, 67 mM Tris-HCl, pH 8.8, 0.1% Tween 20 (Dialat, Moscow). Amplification conditions: 95°C for 30 sec, 58°C for 20 sec, 72°C for 20 sec.Fig. 1. Scheme of isotachophoresis in agarose gel rods. 1) DNA solution; 2) agarose gel; 3) cathode buffer; 4) direction of molecular migration; 5) anode buffer.
Electrophoresis in polyacrylamide gel. Amplification products were analyzed by electrophoresis in 8% polyacrylamide gel prepared in TBE buffer (45 mM Tris-borate, pH 8.0, 1 mM EDTA) at 100 V for 6 h with water cooling.
RESULTS AND DISCUSSION
Difficulty in isolation of circulating DNA affects the efficiency of the search for tumor markers in biological fluids. In developing a method for quantitative (independent of fragment size) isolation of nucleic acids from dilute solutions, we considered it necessary to exclude such uncontrolled stages as ethanol DNA precipitation and sorption on “glass milk” and to ensure visual control of DNA recovery. With these requirements, the most adequate method is isotachophoresis (ITP), a method for separating charged molecules (usually proteins) in a discontinuous electric field in accordance with their electrophoretic mobility [19, 20]. In a buffer system with a common cation (Tris+) and various anions (rapid, Cl–, in anode buffer, and slow, β-alanine–, in cathode buffer), the analyzed components migrate immediately one after another as highly concentrated bands [21]. They are located in the order of decreasing electrophoretic mobility in the interval between the mobilities of the leading and trailing anions (in this case, between Cl– and β-alanine–, correspondingly).
Isotachophoresis has not been applied to the investigation of nucleic acids because it cannot fractionate them by size: the negative charge of the phosphate groups is evenly located over the polynucleotide and consequently, without resistance of the medium (i.e. agarose or polyacrylamide gel), all the molecules of this type move with the same rate independently of their length. Under specific ITP conditions, all of the polynucleotides present in a solution should be brought together into one narrow band located at the moving border of leading and trailing anions. This property of ITP, eliminating its application for nucleic acid fractionation, appears to be very useful when their concentration is needed. We showed earlier that this possibility really comes true [22], but the media used for ITP (porous membranes or horizontal 1% agarose gel) proved to be unsuitable in practice.
In the present work, ITP was adapted for routine application by: first, using agarose gels of low concentration (0.1%) to isolate DNA easily and use it directly in enzymatic reactions [23]; second, visual control of the process; third, electrophoresis in glass tubes securely protects the biological samples and minimizes the possibility of cross-contamination.
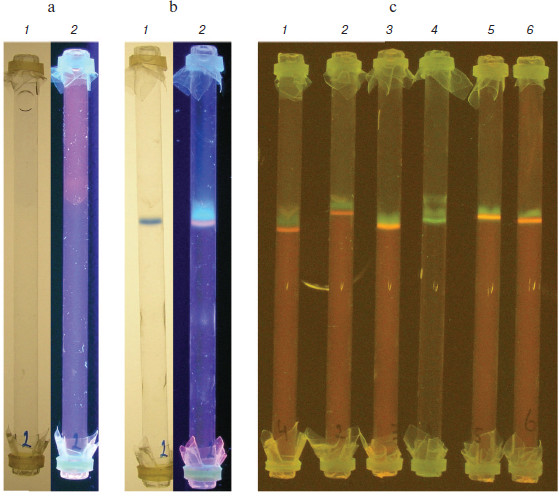
Agarose gel rods (1.2 ml of deproteinized and dialyzed plasma containing BPB marker and ethidium bromide placed above the gel) before and after ITP are shown in Figs. 2a and 2b, respectively (see color insert). During 30-40 min of electrophoresis at 200 V and room temperature, easily visible bands of BPB (lanes 1, visible light) and nucleic acids (lanes 2, UV irradiation) are formed. The latter is sensitive to DNase treatment (not shown here) and evidently represents circulating DNA.
As shown in Fig. 2c, isotachophoretic migration of nucleic acids of various origin and sizes is, as expected, the same (all of them move as a concentrated band directly before BPB). Circulating DNA of patients (lanes 1-4), molecular weight markers (DNA ladder; Fermentas, Lithuania) (lane 5), salmon sperm DNA (Sigma, USA) (lane 6) as well as yeast tRNA (not presented here) behave as shown above. According to preliminary data, intensity of the DNA staining (i.e. content of circulating DNA in blood plasma) of various cancer patients significantly differs (e.g. lanes 1-3), which could serve as a diagnostic sign [18].Fig. 2. Isotachophoresis of DNA from different samples in agarose gel rods. a, b) Rods with deproteinized and dialyzed plasma before and after ITP, correspondingly: 1) visible light; 2) UV irradiation (the band stained with ethidium bromide is circulating DNA). c) Comparison of DNA of various origin (UV irradiation, yellow light filter): 1-3) blood plasma of cancer patients; 4) similar to the 3, but stained with SYBR Gold instead of ethidium bromide; 5) DNA markers of molecular weight (DNA ladder, 100-1000 bp; Fermentas, Lithuania); 6) salmon sperm DNA.
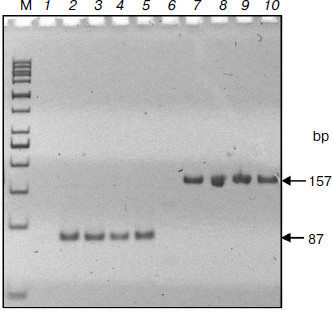
Advantages of DNA separation in agarose gel of low concentration were demonstrated in a recent work [23]. This possibility was used in the suggested method: ITP was carried out in 0.1% agarose gel allowing the fraction of interest to be easily isolated and used for subsequent PCR analysis. The results of amplification of two K-RAS protooncogene fragments (87 and 157 bp) of the circulating DNA of cancer patients shown in Fig. 3 indicate the suitability of described ITP method for genetic analyses.
The described method can be used in clinical and forensic studies, i.e. when there are only micro amounts of fragmented nucleic acids in dilute solutions. Although it is more labor-consuming than the “glass milk” sorption method, ITP has a number of advantages such as avoidance of selective losses, quantitative recovery, and the possibility for visual control. The method is likely to be scaled easily, i.e. adapted to working with significantly larger volumes of biological samples than were used in the present study.Fig. 3. Polymerase chain reaction of circulating DNA isolated by ITP. DNA samples from blood plasma of cancer patients were studied by PCR using primers to fragments of K-RAS protooncogene of 87 (lanes 2-5) and 157 bp (lanes 7-10). M, markers; lanes 1 and 6, controls without DNA.
This work was supported by the Russian Foundation for Basic Research (grant No. 07-04-00049).
REFERENCES
1.Anker, P., Mulcahy, H., Chen, X. Q., and Stroun, M.
(1999) Cancer Metastasis Rev., 18, 65-73.
2.Nawroz, H., Koch, W., Anker, P., Stroun, M., and
Sidransky, D. (1996) Nat. Med., 2, 1035-1037.
3.Botezatu, I., Serdyuk, O., Potapova, G., Shelepov,
V., Alechina, R., Molyaka, Y., Anan’ev, V., Bazin, I., Garin, A.,
Narimanov, M., Knysh, V., Melkonyan, H., Umansky, S., and Lichtenstein,
A. (2000) Clin. Chem., 46, 1078-1084.
4.Sidransky, D. (2002) Nat. Rev. Cancer,
2, 210-219.
5.Diehl, F., Schmidt, K., Choti, M. A., Romans, K.,
Goodman, S., Li, M., Thornton, K., Agrawal, N., Sokoll, L., Szabo, S.
A., Kinzler, K. W., Vogelstein, B., and Diaz, L. A., Jr. (2008) Nat.
Med., 14, 985-990.
6.Garcia, V., Garcia, J., Silva, J., Pena, C.,
Dominguez, G., Lorenzo, Y., Diaz, R., Alonso, I., Colas, A., Hurtado,
A., Sanchez, A., and Bonilla, F. (2008) J. Cancer Res. Clin.
Oncol., 134, 1165-1171.
7.Wong, B. C., and Lo, Y. M. (2003) Expert. Rev.
Mol. Diagn., 3, 785-797.
8.Shekhtman, E. M., Anne, K., Melkonyan, H. S.,
Robbins, D. J., Warsof, S. L., and Umansky, S. R. (2009) Clin.
Chem., 55, 723-729.
9.Lofton-Day, C., Model, F., Devos, T., Tetzner, R.,
Distler, J., Schuster, M., Song, X., Lesche, R., Liebenberg, V., Ebert,
M., Molnar, B., Grutzmann, R., Pilarsky, C., and Sledziewski, A. (2008)
Clin. Chem., 54, 414-423.
10.Melkonyan, H. S., Feaver, W. J., Meyer, E.,
Scheinker, V., Shekhtman, E. M., Xin, Z., and Umansky, S. R. (2008)
Ann. N. Y. Acad. Sci., 1137, 73-81.
11.Kagan, J., Srivastava, S., Barker, P. E.,
Belinsky, S. A., and Cairns, P. (2007) Cancer Res., 67,
4545-4549.
12.Rago, C., Huso, D. L., Diehl, F., Karim, B., Liu,
G., Papadopoulos, N., Samuels, Y., Velculescu, V. E., Vogelstein, B.,
Kinzler, K. W., and Diaz, L. A., Jr. (2007) Cancer Res.,
67, 9364-9370.
13.Hunter, M. P., Ismail, N., Zhang, X., Aguda, B.
D., Lee, E. J., Yu, L., Xiao, T., Schafer, J., Lee, M. L., Schmittgen,
T. D., Nana-Sinkam, S. P., Jarjoura, D., and Marsh, C. B. (2008)
PLoS ONE, 3, e3694.
14.Mitchell, P. S., Parkin, R. K., Kroh, E. M.,
Fritz, B. R., Wyman, S. K., Pogosova-Agadjanyan, E. L., Peterson, A.,
Noteboom, J., O’Briant, K. C., Allen, A., Lin, D. W., Urban, N.,
Drescher, C. W., Knudsen, B. S., Stirewalt, D. L., Gentleman, R.,
Vessella, R. L., Nelson, P. S., Martin, D. B., and Tewari, M. (2008)
PNAS, 105, 10513-10518.
15.Beck, J., Urnovitz, H. B., Riggert, J., Clerici,
M., and Schutz, E. (2009) Clin. Chem., 55, 730-738.
16.Schmidt, B., Weickmann, S., Witt, C., and
Fleischhacker, M. (2005) Clin. Chem., 51, 1561-1563.
17.Herrera, L. J., Raja, S., Gooding, W. E., El
Hefnawy, T., Kelly, L., Luketich, J. D., and Godfrey, T. E. (2005)
Clin. Chem., 51, 113-118.
18.Sozzi, G., Conte, D., Leon, M., Ciricione, R.,
Roz, L., Ratcliffe, C., Roz, E., Cirenei, N., Bellomi, M., Pelosi, G.,
Pierotti, M. A., and Pastorino, U. (2003) J. Clin. Oncol.,
21, 3902-3908.
19.Abelev, G. I. (1979) Meth. Cancer Res.,
18, 2-38.
20.Abelev, G. I., and Karamova, E. R. (1996)
Biochemistry (Moscow), 61, 1413-1421.
21.Abelev, G. I., and Karamova E. R. (1982) Zh.
Vsesoyuz. Khim. O-va im. D. I. Mendeleeva, 27, 429-475.
22.Kondratova, V. N., Serd’uk, O. I.,
Shelepov, V. P., and Lichtenstein, A. V. (2005) Biotechniques,
39, 695-699.
23.Ma, H., and Difazio, S. (2008)
Biotechniques, 44, 921-923.