Synthesis, Characterization, and Studies on DNA Binding of the Complex Fe(Sal2dienNO3·H2O)
Cheng-Yong Zhou1*, Yan-Bo Wu2, and Pin Yang2
1Department of Chemistry, Changzhi University, Shanxi Changzhi 046011, PR China; fax: +86(355)220-5339; E-mail: zcy826@126.com2Key Laboratory of Chemical Biology and Molecular Engineering of the Ministry of Education, Institute of Molecular Science, Shanxi University, Taiyuan, Shanxi 030006, PR China
* To whom correspondence should be addressed.
Received July 8, 2009; Revision received October 15, 2009
A new metal complex, Fe(Sal2dienNO3·H2O) (where Sal is salicylaldehyde and dien is diethylenetriamine), has been synthesized and characterized. The interactions between the Fe(III) complex and calf thymus DNA has been investigated using UV and fluorescence spectra, viscosity, thermal denaturation, and molecular modeling. The cleavage reaction on plasmid DNA has been monitored by agarose gel electrophoresis. The experimental results show that the mode of binding of the complex to DNA is classical intercalation and the complex can cleave pBR322 DNA.
KEY WORDS: DNA binding, Fe(Sal2dienNO3·H2O), Fe(III) complex, calf thymus DNADOI: 10.1134/S0006297910040152
Abbreviations: CT DNA, calf thymus DNA; DFT, density functional theory; dien, diethylenetriamine; DMSO, dimethyl sulfoxide; EB, ethidium bromide; ESFF, extensive systematic force field; HRMS, high resolution mass spectrum; Sal, salicylaldehyde; TMS, tetramethylsilane; TS, transition states.
Various hereditary mechanisms (e.g. gene expression, DNA replication,
and DNA repair) in humans are based on the recognition of specific base
pairs in nucleic acids. Specific recognition, high affinity binding,
and cleavage of DNA sequences by small molecules have therefore always
been one of the main focuses of chemistry, biology, and pharmacology.
Inspired by natural products such as netropsin, distamycin [1], CC-1065 [2, 3], bleomycin [4, 5], and calicheamicin [6], among
others, chemists have for decades developed principles with the
ultimate goal of being able to design and synthesize compounds on
demand that recognize and bind to any desired sequence in double
stranded DNA [7, 8]. Artificial
oligonucleotides [9-11], PNA
(peptide nucleic acid) [12, 13], carbohydrates [14, 15], and proteins [16] have been
broadly studied for molecular recognition properties. These small
molecules are stabilized in binding to DNA through a series of weak
interactions, such as the π-stacking interactions associated with
intercalation of a planar aromatic group between the base pairs,
hydrogen-bonding and van der Waals interactions of functionalities
bound along the groove of the DNA helix [17, 18], and the electrostatic interaction of the cation
with phosphate group of DNA [18]. Studies directed
toward the design of site- and conformation-specific reagents provide
rationales for new drug design as well as a means to develop sensitive
chemical probes of nucleic acid structure.
Among small molecules, considerable attention has been given to polyamide complexes with metals due to their high affinity and specificity interactions to specific DNA regions [19-23]. Since these polyamides can permeate living cell membranes, they have the potential to control specific gene expression [24-28]. Furthermore, many useful complexes can be created by polyamides coordinating with other various molecules [29, 30]. The complex [Mg2(dien)Cl(OH)]Cl2·2H2O (dien is diethylenetriamine) was found to have high cleavage activity toward DNA [31]. A polyamine complex with glucoses synthesized by Liu et al. has great potential in curing congenital genetic and acquired immunity disease because it can transfer nucleic acid medicines safely, innocuously, and highly efficiently [32, 33].
In this work a new metal complex, Fe(Sal2dienNO3·H2O) (Sal is salicylaldehyde, dien is diethylenetriamine), has been synthesized and characterized. The aim was to discover a new DNA-binding reagent. The results should be valuable in understanding the nature of the complex with DNA as well as laying a foundation for rational design of novel, powerful agents for probing and targeting nucleic acids. These can also provide valuable information for exploiting and developing drugs and their application in the field of molecular biology.
MATERIALS AND METHODS
Materials. Calf thymus DNA (CT DNA) and pBR322 plasmid DNA were obtained from Sigma (USA). The ligand was synthesized with an efficient combination of the nucleophilic addition–dehydration reaction. Its purity was checked by MS, elemental analysis, FTIR, and 1H- and 13C-NMR. All other chemicals were of analytical reagent grade and used without further purification.
Methods of physicochemical characterization. Carbon, nitrogen, and hydrogen analyses were determined using a Perkin-Elmer (USA) 240C elemental analyzer. 1H-NMR and 13C-NMR spectra were measured on a Bruker (Germany) DRX-300 spectrometer in DMSO-d6 solution, with TMS (tetramethylsilane) as the internal standard. IR spectra were recorded on a Shimadzu (Japan) FT-IR-8300 instrument using KBr discs in the 400-4000 cm–1 region. Absorbance spectra were recorded on a Hewlett-Packard (USA) HP-8453 Chemstation spectrometer. A UV-Vis spectrometer was used to check DNA purity (A260/A280 > 1.80) and concentration (ε = 6600 M–1·cm–1 at 260 nm). Fluorescence was measured with a Perkin-Elmer LS-50B luminescence spectrometer equipped with quartz curettes of 1 cm pathlength at room temperature. The excitation and emission slit widths were 10 nm. Plasmid DNA cleavage products were analyzed with a UVP GDS8000 complete gel documentation and analysis system. Conductance was measured with a DDS-307 conductivity gauge (Jingke Rex, China). Viscosity was measured using an Ubbelohde viscosimeter maintained at 25.0 ± 0.1°C. Flow time was measured with a digital stopwatch; mean values of replicated measurements were used to evaluate the viscosity η of the samples. The data are reported as (η/η0)1/3 vs. the [ML]/[DNA] (ML is Fe(Sal2dienNO3·H2O)) ratio, where η0 is the viscosity of the DNA solution alone. The DNA melting experiments were carried out by controlling the temperature of the sample cell with a Shimadzu circulation bath, monitoring the absorbance at 260 nm.
Synthesis of the ligand. Diethylenetriamine (2.06 g, 0.02 mol) dissolved in 15 ml of methanol was dropwise added to a stirred solution of salicylaldehyde (4.88 g, 0.04 mol) in 80 ml of methanol. The solution turned yellow immediately and was allowed to stir at room temperature for 2 h. The reaction mixture was evaporated to 15 ml in vacuum. The resulting solution was placed in a refrigerator overnight, and yellow precipitate was formed. The precipitate was collected and washed three times with solution of methanol–ether (1 : 1). Drying in vacuum afforded a yellow solid. Yield was 5.49 g (88.3%). The synthetic route of the ligand and the Fe(III) complex is shown in Fig. 1. Anal. Calc. for C18H21N3O2: C, 69.43; N, 13.49; H, 6.80. Found: C, 69.39; N, 13.46; H, 6.83. 1H-NMR (300 MHz, DMSO-d6, δ, ppm): 8.14 (s, 2H, H8), 7.42 (d, 2H, H4), 7.14 (m, 2H, H6), 6.83 (m, 2H, H5), 6.76 (d, 2H, H7), 5.52 (s, 2H, H1), 3.69 (t, 4H, H9), 2.93 (t, 4H, H10), 2.05 (m, 1H, H11). 13C-NMR (300 MHz, DMSO-d6, δ, ppm), C2 161.2, C8 160.7, C6 132.7, C4 130.2, C3 124.6, C5 121.8, C7 116.2, C9 55.8, C10 50.5. IR (KBr): 3596.0, 3423.6, 3062.9, 3023.6, 2926.9, 1648.5, 1542.9, 1475.2, 1452.4, 1386.3, 1318.2, 1260.7, 1207.6, 1151.5, 1128.7, 1030.8, 902.6, 762.1, 601.7. HRMS: calculated for C18H21N3O2 311.3782; found 311.3778.
Synthesis of the complex. To the ligand (6.22 g, 0.02 mol) in methanol (100 ml) sodium methoxide (2.16 g, 0.04 mol) in methanol (50 ml) was added, and the mixture was stirred for 10 min. To this solution Fe(NO3)3·9H2O (8.08 g, 0.02 mol) in methanol (50 ml) was added dropwise, and the reaction mixture turned dark brown immediately. The solution was allowed to stir at room temperature for 2 h. The resulting solution was filtered, and the filtrate was evaporated to remove methanol in vacuum. The residue was dissolved in 250 ml of hot water. The aqueous solution was placed in a refrigerator overnight, and a brown precipitate was formed. The precipitate was collected and washed three times with water and ether respectively. Recrystallization from hot water and drying in vacuum afforded a brown solid. Yield was 7.72 g (84.8%). Anal. Calc. for C18H21FeN4O6: C, 48.56; N, 12.58; H, 4.75. Found: C, 48.52; N, 12.55; H, 4.79. 1H-NMR (300 MHz, DMSO-d6, δ, ppm): 8.42 (s, 2H, H8), 7.25 (d, 2H, H4), 7.02 (m, 2H, H6), 6.65 (m, 6H, H5), 6.53 (d, 2H, H7), 3.96 (t, 4H, H9), 3.01 (t, 4H, H10), 2.65 (m, 1H, H11). 13C-NMR (300 MHz, DMSO-d6, δ, ppm), C8 163.9, C2 159.4, C6 131.2, C4 128.8, C3 122.5, C5 119.4, C7 114.6, C9 56.3, C10 52.7. IR (KBr): 3421.5, 3060.8, 3022.2, 2925.8, 1625.9, 1542.9, 1469.7, 1446.5, 1384.8, 1315.4, 1249.8, 1201.6, 1149.5, 1126.4, 1029.9, 900.7, 758.0, 591.5. HRMS: calculated for C18H21FeN4O6 445.2275; found 445.2269. Conductance: the complex (solvent: anhydrous methanol): 2.7 s·cm2·mol–1, Fe(NO3)3 (solvent: anhydrous methanol): 263 s·cm2·mol–1, the solvent (anhydrous methanol): 2.5 s·cm2·mol–1.Fig. 1. Synthetic scheme of the complex Fe(Sal2dienNO3·H2O).
It can be seen from 1H-NMR data of the ligand and complex that the chemical shift value of the H8, H9, H10, and H11 of the Fe(III) complex clearly moved to low-field, which results from the decrease of electron density around them owing to forming of the complex. The chemical shift value of benzene protons clearly moved to high-field because of deshielding effect due to the magnetic anisotropy of the protons of benzene in the magnetic field.
It is concluded from comparing the IR spectra of the ligand and the complex that the Fe(III) complex was formed through Fe(III) coordinating two N atoms of C=N groups and two O atoms of the phenol hydroxyl groups. The peak (3596 cm–1, B) of O–H bond stretching vibration disappeared in the IR spectra of the complex, which indicates that the protons of the phenol hydroxyl groups have been substituted. In addition, the complex has no electrochemical signal in cyclic voltammetry monitoring, and the complex is hard to dissolve in water, which suggests the complex may be electrical neutral coordination. This can be confirmed further from comparing the conductance of Fe(NO3)3 and the Fe(III) complex. Finally, the structure of the Fe(III) complex can be conferred as shown in Fig. 2.
Computational details. The DFT (density functional theory) calculations were carried out by the unrestricted Hartree–Fock method using the Gaussian 03 system of programs [34]. The various possible starting structures were optimized at B3LYP/3-21g [35-37] level and imaginary frequencies were analyzed at the same theoretical level. In accordance with the experimental results, only a nonsymmetrical structure (Fig. 3) with hexacoordinate iron (III) center was confirmed to be a minimum during the calculation process. Other structures (such as those with tetracoordinate or pentacoordinate iron (III) center) were proved to be transition states (TS) or higher order saddle points. As shown in Fig. 3, the iron atom had a slightly distorted octahedral hexacoordination. The lengths of coordination bonds are labeled in the figure. It is worthy of note that, although there are five coordination points in the ligand, the coordination atom only contain two N atoms of C=N groups and two O atoms of the phenoxy anion, not including the middle N atom owing to the stereochemical effect. Moreover, the two benzene rings were perpendicular.Fig. 2. Conferred structure of the complex based on the experimental results.
Molecular modeling. The complex–DNA interactions were also studied by molecular modeling. All calculations were performed on an SGI workstation with the Insight II software package. The initial structure of the complex was that acquired by DFT calculation. Because the CT DNA as well as pBR322 DNA used in the experimental work were too large for current computational resources to model, the structure of the DNA d(CCGTCGACGG)2 (a familiar sequence used in oligodeoxynucleotide study) was constructed in the BIOPOLYMER Module of the Insight II package to study the DNA binding characteristics of the complex. The extensive systematic force field (ESFF) was used with its default parameters as it can deal with both DNA and metal complex. At the beginning of optimization, the Steepest Descent method was used until the root-mean-square (RMS) derivation was less than 5 kcal/mol. Then it was switched to the Conjugate Gradient method automatically by the DISCOVER 98 program. When the RMS derivation was less than 0.5 kcal/mol, optimization was stopped. The DNA–complex interactions were examined by comparing the potential energy differences among different binding sites of both minor and major grooves. All interaction systems were dealt with periodic boundary conditions (PBC, usually in a parallelepiped that preserves the shape of the unit cell) and the corresponding summation method was the group-based cut-off. All systems containing DNA were calculated in aqueous solution, while other systems in vacuum.Fig. 3. Optimized structure of the iron (III) complex with lengths of six coordination bonds.
Absorption and fluorescence measurements of solutions of the complex. Buffered aqueous solutions of DNA (0.6 mM) were prepared with water purified on a Millipore (France) apparatus. Phosphate (10 mM) buffer (pH 7.0) containing 1 mM EDTA was used. No added salt or support electrolyte was used. These solutions were dialyzed for three days with continuous agitation on a shaker bath at 30°C. Free complex concentrations were determined from the dialyzate by absorbance measurements at 279 nm (ε = 17,164 M–1·cm–1). Aqueous solution of the Fe(Sal2dienNO3·H2O) complex was prepared by dissolving it in water at a concentration of 1.0·10–4 M. The absorption was titrated by keeping the concentration of CT DNA (1.18·10–4 M) constant with varying concentration of the complex (for Fe(Sal2dienNO3·H2O), (0, 0.5, 1.0, 1.5, 2.0, 2.5, 3.0, 3.5)·10–6 M). The absorption was recorded after each addition of the complex. The fluorescence spectra (λex = 520 nm) were also recorded at room temperature. All solutions were allowed to equilibrate thermally for about 30 min before measurements.
Cleavage of pBR322 DNA by the Fe(III) complex was carried out with 10 µl reaction mixture containing of 10 mM Tris-HCl, pH 7.5, 5 mM NaCl, varying concentrations of complex, and 0.5 µl of pBR322 (0.5 µg/µl). After mixing, the DNA solutions were incubated at 37°C for 4 h. The reactions were quenched by the addition of EDTA and bromophenol blue. The gel was stained with ethidium bromide (EB) for 0.5 h after electrophoresis and then photographed.
RESULTS AND DISCUSSION
DNA binding studies are important for the rational design and construction of new and more efficient drugs targeted to DNA [38]. A variety of small molecules interact reversibly with double stranded DNA, primarily through three modes: (i) electrostatic interactions with the negatively charged nucleic sugar-phosphate structure, which are along the external DNA double helix and do not possess selectivity; (ii) binding interactions with two grooves of DNA double helix; and (iii) intercalation between the stacked base pairs of native DNA. Heterocyclic dyes, such as ethidium, anthracyclines, phenothiazines, and acridine derivatives interact through intercalation with the planar, aromatic group stacked between base pairs [39-41]. So as to explore the DNA binding and cleavage activity of the synthetic metal complex, the following experiments have been carried out.
Effect of the complex on UV spectra of DNA. “Hyperchromic” and “hypochromic” effects are spectra features of DNA concerning its double helix structure [42]. These spectral changes reflect the corresponding changes of DNA in its conformation and structures after the drug binds to DNA. Hypochromism results from the contraction of DNA along the helix axis, as well as from the change in conformation on DNA; in contrast, hyperchromism derives from the damage of the DNA double helix structure [42, 43]. As shown in Fig. 4, the absorption spectra of DNA increased with increasing Fe(III) complex concentration. This is a typical “hyperchromic effect”. Therefore, the result indicates the interaction between Fe(III) complex and DNA is not the electrostatic mode but the classical intercalation mode, namely, the DNA double helix structure is damaged after the complex bound to DNA.
Effect of the complex on fluorescence spectra of DNA–EB complex. To investigate the mode of binding of the Fe(III) complex to DNA, competitive binding has been studied. The fluorescent emission of EB (2 µM) bound to DNA (20 µM) in the absence and the presence of the complex is shown in Fig. 5. Ethidium bromide is a conjugated planar molecule. Its fluorescence intensity is very weak, but it is greatly increased when EB is specifically intercalated into the base pairs of double stranded DNA. When EB is free from DNA, the fluorescence of EB is quenched. Therefore, EB can be used as a probe for DNA structure detection [44]. Fe(Sal2dienNO3·H2O) itself does not show appreciable fluorescence in the spectral region studied, either free or bound to DNA, and does not quench the fluorescence of EB in the absence of DNA under the conditions of our experiments. The emission band at 590 nm of the DNA–EB system decreased in intensity on increasing the Fe(III) complex concentration. Since intercalated EB is the only fluorescent species, the observed fluorescence decrease indicates that the complex can replace EB inside the DNA cavities. Such a characteristic change is often observed in intercalative DNA interaction [45].Fig. 4. Absorption spectra of calf thymus DNA (1.2·10–4 M (1)) in Tris-HCl buffer upon addition of Fe(Sal2dienNO3·H2O) ((1, 2, 3, 4, 5, 6, 7) × 10–6 M (2-8), respectively). The arrow shows the absorbance changes with increasing Fe(Sal2dienNO3·H2O) concentration.
Scatchard plots. To get a better insight into the nature of complex–DNA binding, we use fluorescence to study EB binding to DNA in the presence of a competing metal complex. The characteristics of the binding of EB to DNA can be expressed by the Scatchard equation [44]:Fig. 5. Fluorescence emission spectra (excited at 520 nm) of EB–DNA complex in the absence (1) and presence (2-8) of increasing concentrations of the complex (2 mM, 1 µl per scan).
r/Cf = K(n – r),
where r is the ratio of bound EB to total nucleotide concentration, Cf is the concentration of free EB, n is the number of binding sites per nucleic acid, and K is the intrinsic binding constant for EB. Scatchard plots of fluorescence for the binding of EB to calf thymus DNA (1.18·10–6 M) in the absence and presence of the Fe(Sal2dienNO3·H2O) complex are given in Fig. 6. The change in K indicates that the complex binds to DNA by competitive inhibition [46]. This is due to the insertion of the planar benzene ring into DNA, blocking potential intercalation sites of EB and competing for the intercalative binding sites with EB.
Viscosity study. Hydrodynamic methods such as determination of viscosity, which is exquisitely sensitive to the change of length of DNA, can be a most effective means of studying of the binding mode of complexes to DNA in the absence of X-ray crystallographic or NMR structural data [47]. To further confirm the interaction mode of the Fe(III) complex with DNA, a viscosity study was carried out (Fig. 7). The viscosity measurement is based on the flow rate of a DNA solution through a capillary viscosimeter. The specific viscosity contribution (η) due to the DNA in the presence of a binding agent was obtained. The results indicate that the absence and the presence of the metal complex have a marked effect on the viscosity of the DNA. The specific viscosity of the DNA sample clearly increases with the addition of the complex. The viscosity studies provide a strong argument for intercalation [48, 49]. The viscosity increase of DNA is ascribed to the intercalative binding mode of the drug because this can cause the effective length of the DNA to increase [50, 51]. In essence, the length of the linear piece of B-form DNA is given by the thickness of the base pairs that are stacked along the helix axis in Van der Waals contact with each other. Introducing another aromatic molecule into the stack therefore increases the length. So, the viscosity increase of the DNA caused by the addition of the complex provides further support for the intercalative mode of interaction of the Fe(III) complex with DNA.Fig. 6. Scatchard plots of the fluorescence for the binding of EB to CT DNA in the absence (1) and the presence (2-4) of increasing concentrations of the complex ([Fe(Sal2dienNO3·H2O)]/[DNA] = 0, 0.25, 0.5, 1.0, respectively, from top to bottom). CDNA = 2.5·10–6 M.
Thermal denaturation experiments. Other strong evidence for the binding mode between the complex and DNA was obtained from melting studies of the DNA. The intercalation of small molecules into the double helix is known to significantly increase the helix melting temperature at which the double helix denatures into single stranded DNA [52, 53]. The extinction coefficient of DNA bases at 260 nm in the double helical form is much less than that in the single stranded form [54, 55]; hence, the melting of the helix leads to an increase in the absorption at this wavelength. Thus, the helix-to-coil transition temperature can be determined by monitoring the absorbance of DNA bases at 260 nm as a function of temperature (Tm). However, the Tm will increase slightly (Tm < 0.6°C) when interaction of small molecules with DNA through nonspecific electrostatic interactions with the phosphate backbone of DNA occurs [56]. The DNA melting curves in the absence and presence of the Fe(III) complex are presented in Fig. 8. The Tm of the DNA is 80°C in the absence of the Fe(III) complex and 85°C in the presence of the complex. Therefore, it can be concluded that Fe(III) complex interacts with DNA through the intercalative mode.Fig. 7. Effect of increasing concentrations of Fe(Sal2dienNO3·H2O) on relative viscosity of DNA. CFeL = 0, (0.5, 0.10, 0.15, 0.20) × 10–3 mM.
Molecular modeling. To give a clear observation of binding pattern between the complex and DNA, an intercalating interaction model of them was optimized using the Insight II package. Figure 9 shows the optimized structure of complex–DNA association in both front and side views. We find in the figure that a benzene ring of the complex has inserted into the DNA base stack and the other parts stayed at the minor groove. Remarkably, the iron (III) center of the complex is not at the middle location between two side chains, but near one of them, which facilitates further cleavage reactions.Fig. 8. Plot of the changes of absorbance at 260 nm of CT DNA on heating in the absence (a) and presence (b) of the Fe(Sal2dienNO3·H2O) complex. [CT DNA] = 1.2·10–4 M and [Fe(Sal2dienNO3·H2O)] = 1.2·10–5 M in 10 mM Tris-HCl, pH 7.2, at 25°C.
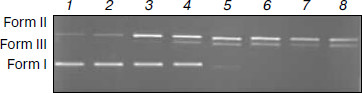
DNA cleavage experiments. The cleavage reaction of plasmid DNA can be monitored by agarose gel electrophoresis. When circular plasmid DNA is subject to electrophoresis, relatively fast migration will be observed for the intact supercoil form (form I, supercoil form). If scission occurs on one strand (nicking), the supercoil will relax to generate a slower moving open circular form (form II, OC form). If both strands are cleaved, a linear form (form III) that migrates between forms I and II will be generated [57]. Figure 10 shows the results of cleaving superhelical pBR322 DNA in the presence of varying concentrations of the Fe(Sal2dienNO3·H2O). The results indicate that the supercoil form of pBR322 DNA diminishes gradually, whereas the OC form increases with the increase of concentration of the Fe(Sal2dienNO3·H2O), and the linear form is also produced. When CFe(III) complex/CDNA is increased to 0.30 (lane 4), the linear form starts to occur, and when CFe(III) complex/CDNA is increased to 0.50 (lane 6) the supercoil form almost completely converts to the OC and linear forms. Therefore, these results indicate that the Fe(Sal2dienNO3·H2O) can bind to and cleave DNA efficiently.Fig. 9. Binding mode between the Fe(III) complex and oligodeoxynucleotide: front (a) and side (b) views.
In summary, a new Fe(III) complex has been synthesized and characterized by elemental analyses, 1H- and 13C-NMR, IR, HRMS, and conductance. The postulated structure of the complex deduced from the experiments was confirmed by DFT calculations. The interactions between the complex and calf thymus DNA was first investigated using UV spectra, fluorescent spectra, thermal denaturation, and viscosity. Furthermore, the binding mode between the complex and DNA was studied by molecular modeling. The cleavage reaction of plasmid DNA was investigated by agarose gel electrophoresis. Remarkably, the experimental results show that the complex is a new species that can bind DNA with intercalative mode at the minor groove and can cleave DNA efficiently. The results should be valuable in understanding the mode of formation of the complex with DNA as well as laying a foundation for the rational design of novel powerful agents for probing and targeting nucleic acids.Fig. 10. Results of electrophoresis of pBR322 DNA in the presence of varying concentrations of Fe(Sal2dienNO3·H2O). CFe(III) complex/CDNA: 0, 0.1, 0.2, 0.3, 0.4, 0.5, 0.6, and 0.7 (1-8, respectively). Form I is supercoiled DNA, form II is nicked circular form DNA (OC form), and form III is linear DNA.
The authors wish to express their sincere appreciation to Prof. Li Si-Dian (Institute of Material Science and Department of Chemistry, Xinzhou Teacher’s University, Xinzhou, Shanxi, P. R. China) for supporting ab initio computational resources. Tremendous thanks are owed to Prof. Yue-Kui Wang for constructive discussion.
REFERENCES
1.Kopka, M. L., Yoon, C., Goodsell, D., Pjura, P.,
and Dickerson, R. E. (1985) Proc. Natl. Acad. Sci. USA,
82, 1376-1380.
2.Hanka, L. J., Dietz, A., Gerpheide, S. A.,
Kuentzel, S. L., and Martin, D. G. (1978) J. Antibiot.,
31, 1211-1217.
3.Chidester, C. G., Krueger, W. C., Mizsak, S. A.,
Duchamp, D. J., and Martin, D. G. (1981) J. Am. Chem. Soc.,
103, 7629-7635.
4.Suzuki, H., Nagai, K., Yakami, H., Tanaka, N., and
Umezawa, H. (1969) J. Antibiot., 22, 446-448.
5.Fujiwara, Y., and Kondo, T. (1973) Biochem.
Pharmacol., 22, 323-333.
6.Nicolaou, K. C. (1993) Angew. Chem. Int. Ed.
Engl., 32, 1377-1385.
7.Dervan, P. B. (1986) Science, 232,
464-471.
8.Nielsen, P. E. (1997) Chem. Eur. J.,
3, 505-508.
9.Stroble, S. A., and Dervan, P. B. (1991)
Science, 249, 73-75.
10.Dervan, P. B. (1992) Nature, 359,
87-88.
11.Maher, L. J. (1996) Cancer Invest.,
14, 66-82.
12.Nielsen, P. E., Egholm, M., Berg, R. H., and
Buchardt, O. (1991) Science, 254, 1497-1500.
13.Hyrup, B., and Nielsen, P. E. (1996) Bioorg.
Med. Chem., 4, 5-23.
14.Nicolaou, K. C., Ajito, K., Komatus, H., Smith,
B. M., Li, T. H., Egan, M. G., and Gomezpaloma, L. (1995) Angew.
Chem. Int. Ed. Engl., 34, 576-578.
15.Kahne, D. (1995) Chem. Biol., 2,
7-12.
16.Choo, Y., and Klug, A. (1995) Curr. Opin.
Biotechnol., 6, 431-436.
17.Pyle, A. M., Rehmann, J. P., Meshoyrer, R.,
Kumar, C. V., Turro, N. J., and Barton, J. K. (1989) J. Am. Chem.
Soc., 111, 3051-3058.
18.Pindur, U., Jansen, M., and Lemster, T.
(2005) Curr. Med. Chem., 12, 2805-2847.
19.Satyanarayana, S., Dabrowiak, J. C., and Chaires,
J. B. (1992) Biochemistry, 31, 9319-9324.
20.Melander, C., Burnett, R., and Gottesfeld, J. M.
(2004) J. Biotechnol., 112, 195-220.
21.Wade, W. S., Mrksich, M. M., and Dervan, P. B.
(1992) J. Am. Chem. Soc., 114, 8783-8794.
22.Trauger, J. W., Baird, E. E., and Dervan, P. B.
(1996) Nature, 382, 559-561.
23.White, S., Baird, E. E., and Dervan, P. B. (1997)
Chem. Biol., 4, 569-578.
24.Dickinson, L. A., Burnett, R., Melander, C.,
Edelson, B. S., Arora, P. S., Dervan, P. B., and Gottesfeld, J. M.
(2004) Chem. Biol., 11, 1583-1594.
25.Dickinson, L. A., Trauger, J. W., Baird, E. E.,
Ghazal, P., Dervan, P. B., and Gottesfeld, J. M. (1999)
Biochemistry, 38, 10801-10807.
26.Minoshima, M., Chou, C. J., Lefebvre, S., Bando,
T., Shinohara, K., Gottesfeld, J. M., and Sugiyama, H. (2008)
Nucleic Acids Symp. Ser. (Oxford), 52, 363-364.
27.Muzikar, K. A., Nickols, N. G., and Dervan, P. B.
(2009) Proc. Natl. Acad. Sci. USA, 106, 16598-16603.
28.Chenoweth, D. M., Harki, D. A., and Dervan, P. B.
(2009) Org. Lett., 11, 3590-3593.
29.Chou, C. J., O’Hare, T., Lefebvre, S.,
Alvarez, D., Tyner, J. W., Eide, C. A., Druker, B. J., and Gottesfeld,
J. M. (2008) PLoS ONE, 3, e3593.
30.Alvarez, D., Chou, C. J., Latella, L., Zeitlin,
S. G., Ku, S., Puri, P. L., Dervan, P. B., and Gottesfeld, J. M.
(2006) Cell Cycle, 5, 1537-1548.
31.Yang, P., Ren, R., Guo, M. L., and Song, A. X.
(2004) J. Biol. Inorg. Chem., 9, 495-506.
32.Liu, Y. M., Wenning, L. R., Lynch, M., and
Reineke, T. M. (2004) J. Am. Chem. Soc., 126,
7422-7423.
33.Liu, Y. M., and Reineke, T. M. (2005) J. Am.
Chem. Soc., 127, 3004-3015.
34.Frisch, M. J., Trucks, G. W., Schlegel, H. B.,
Scuseria, G. E., Robb, M. A., Cheeseman, J. R., Montgomery, J. A., Jr.,
Vreven, T., Kudin, K. N., Burant, J. C., Millam, J. M., Iyengar, S. S.,
Tomasi, J., Barone, V., Mennucci, B., Cossi, M., Scalmani, G., Rega,
N., Petersson, G. A., Nakatsuji, H., Hada, M., Ehara, M., Toyota, K.,
Fukuda, R., Hasegawa, J., Ishida, M., Nakajima, T., Honda, Y., Kitao,
O., Nakai, H., Klene, M., Li, X., Knox, J. E., Hratchian, H. P., Cross,
J. B., Adamo, C., Jaramillo, J., Gomperts, R., Stratmann, R. E.,
Yazyev, O., Austin, A. J., Cammi, R., Pomelli, C., Ochterski, J. W.,
Ayala, P. Y., Morokuma, K., Voth, G. A., Salvador, P., Dannenberg, J.
J., Zakrzewski, V. G., Dapprich, S., Daniels, A. D., Strain, M. C.,
Farkas, O., Malick, D. K., Rabuck, A. D., Raghavachari, K., Foresman,
J. B., Ortiz, J. V., Cui, Q., Baboul, A. G., Clifford, S., Cioslowski,
J., Stefanov, B. B., Liu, G., Liashenko, A., Piskorz, P., Komaromi, I.,
Martin, R. L., Fox, D. J., Keith, T., Al Laham, M. A., Peng, C. Y.,
Nanayakkara, A., Challacombe, M., Gill, P. M. W., Johnson, B., Chen,
W., Wong, M. W., Gonzalez, C., and Pople, J. A. (2003) GAUSSIAN03 (Rev.
A.1), Gaussian, Inc., Pittsburgh, PA.
35.Becke, A. D. (1988) Phys. Rev. A,
38, 3098-3100.
36.Lee, C., Yang, W., and Parr, R. G. (1988)
Phys. Rev. B, 37, 785-789.
37.Stevens, P. J., Devlin, J. F., Chabalowski, J.
F., and Frisch, M. J. (1994) J. Phys. Chem., 98,
11623-11627.
38.Waring, M. J. (1977) in Drug Action at the
Molecular Level (Roberts, G. C. K., ed.) Maemillar, London.
39.Waring, M. J. (1965) J. Mol. Biol.,
13, 269-282.
40.Chaires, J. B., Dattagupta, N., and Crothers, D.
M. (1982) Biochemistry, 21, 3933-3940.
41.Wakelin, L. P. G., Atwell, G. J., Rewcastle, G.
W., and Denny, W. A. (1987) J. Med. Chem., 30,
855-861.
42.Li, Q. S., Yang, P., Wang, H. F., and Guo, M. L.
(1996) J. Inorg. Biochem., 64, 181-195.
43.Shi, S., Liu, J., Li, J., Zheng, K. C., Huang, X.
M., Tan, C. P., Chen, L. M., and Ji, L. N. (2006) J. Inorg.
Biochem., 100, 385-395.
44.Lepecq, J. B., and Paoletti, C. (1967) J. Mol.
Biol., 27, 87-106.
45.Zhou, C. Y., Xi, X. L., and Yang, P. (2007)
Biochemistry (Moscow), 72, 37-43.
46.Guo, M. L., Yang, P., Yang, B. S., and Zhang, Z.
G. (1996) Chin. Sci. Bull., 41, 1098-1103.
47.Li, F. H., Zhao, G. H., Wu, H. X., Lin, H., Wu,
X. X., Zhu, S. R., and Lin, H. K. (2006) J. Inorg. Biochem.,
100, 36-43.
48.Sigma, D. S., Mazuder, A., and Perrin, D. M.
(1993) Chem. Rev., 93, 2295-2316.
49.Jin, L., and Yang, P. (1997) J. Inorg.
Biochem., 68, 79-83.
50.Liu, F., Meadows, A., and McMillin, D. R. (1993)
J. Am. Chem. Soc., 115, 6699-6704.
51.Shi, S., Liu, J., Li, J., Zheng, K. C., Huang, X.
M., Tan, C. P., Chen, L. M., and Ji, L. N. (2006) J. Inorg.
Biochem.,100, 385-395.
52.Li, Y. Q., White, J., David, S., Gary, S., and
Michael, S. (2001) Biotechnol. Progr., 17, 348-354.
53.Zeynep, D., Ralph, P., Jan, A. R. S., Sukunath,
N., and Clemens, R. (2004) J. Am. Chem. Soc., 126,
4762-4763.
54.Thierry, D. J. (2006) Photochem. Photobiol. B:
Biol., 82, 45-52.
55.Silvestri, A., Barone, G., Ruisi, G., Giudice, M.
T. L., and Tumminello, S. (2004) J. Inorg. Biochem., 98,
589-594.
56.Foloppel, M. P., Rault, S., Thurston, D. E.,
Jenkins, T. C., and Robbal, M. (1996) Eur. J. Med. Chem.,
31, 407-410.
57.Selvakumar, B., Rajendiran, V., Maheswari, P. U.,
Evans, H. S., and Palaniandavar, M. (2006) J. Inorg. Biochem.,
100, 316-330.