Accurate Mass Tag Retention Time Database for Urine Proteome Analysis by Chromatography–Mass Spectrometry
I. A. Agron1,2, D. M. Avtonomov1,2,3, A. S. Kononikhin1,3, I. A. Popov1,2,3, S. A. Moshkovskii2, and E. N. Nikolaev1,2,3*
1Institute for Energy Problems of Chemical Physics, Russian Academy of Sciences, Leninsky pr. 38, 119334 Moscow, Russia; fax: (499) 137-8258; E-mail: nvduh@chph.ras.ru2Orekhovich Institute of Biomedical Chemistry, Russian Academy of Medical Sciences, ul. Pogodinskaya 10, 119121 Moscow, Russia; fax: (499) 246-3423; E-mail: inst@ibmc.msk.ru; ennikolaev@rambler.ru
3Emanuel Institute of Biochemical Physics, Russian Academy of Sciences, ul. Kosygina 4, 119334 Moscow, Russia; fax: (495) 137-4101; E-mail: ibcp@sky.chph.ras.ru
* To whom correspondence should be addressed.
Received August 25, 2009; Revision received October 23, 2009
Information about peptides and proteins in urine can be used to search for biomarkers of early stages of various diseases. The main technology currently used for identification of peptides and proteins is tandem mass spectrometry, in which peptides are identified by mass spectra of their fragmentation products. However, the presence of the fragmentation stage decreases sensitivity of analysis and increases its duration. We have developed a method for identification of human urinary proteins and peptides. This method based on the accurate mass and time tag (AMT) method does not use tandem mass spectrometry. The database of AMT tags containing more than 1381 AMT tags of peptides has been constructed. The software for database filling with AMT tags, normalizing the chromatograms, database application for identification of proteins and peptides, and their quantitative estimation has been developed. The new procedures for peptide identification by tandem mass spectra and the AMT tag database are proposed. The paper also lists novel proteins that have been identified in human urine for the first time.
KEY WORDS: proteomics, ion cyclotron resonance mass spectrometry, accurate mass time tags, urineDOI: 10.1134/S0006297910050147
Such abundant proteins as albumin in human urine are determined by standard biochemical methods that are reliable for diagnostics of various diseases [1]. Achievements in isolation of a urinary protein fraction, its purification, and separation as well as application of highly sensitive analytical methods (including mass spectrometry) has allowed reproducible urine proteomic profiling, which can give valuable information about various diseases.
The main mass spectrometry based approaches for identification of proteins and peptides include so-called bottom-up and top-down procedures.
The bottom-up procedure is the approach from peptides to proteins: initially, proteins are hydrolyzed to peptides, and proteins are identified after determination of peptide composition [2].
Protein hydrolysis using a site-specific enzyme followed by subsequent detection of peptide masses is one of the simplest procedures for identification of individual proteins. This method simultaneously (and independently) proposed by several research groups [3] is now known as the Peptide Mass Fingerprint. Peptide mass spectra are used for subsequent search, which involves comparison of experimentally obtained mass ions with peptide masses obtained during theoretical hydrolytic cleavage of all database proteins. Such identification yields a list of proteins and peptides of different scores (reliability degree).
The use of information from mass spectra of parent peptide ions subjected for further fragmentation is an improved Peptide Mass Fingerprint procedure [4]. This procedure is known as the MS/MS Ions Search. The advantage of the bottom-up approach with MS/MS-based search consists of high reliability and possibility of protein and peptide identification in complex mixtures. However, it also has some disadvantages: there are a limited number of MS/MS analyses for an individual peak; there is dependence between reliability of peptide identification and quality of fragmentation spectra; measurement of fragmentation spectra requires additional time.
Another method (the top-down approach) was proposed by Mang et al. [5]. This approach does not require enzymatic hydrolysis: a protein undergoes fragmentation in a mass spectrometer, and it is identified after mass determination and standard treatment of mass spectra [6] by means of genome or proteome database search. Since protein separation represents a more complicated task than separation of individual peptides in a mixture, we have not used the top-down approach in this study.
Smith and his colleagues proposed a principally new approach [7] to protein and peptide identification. This method called as accurate mass and time tag (AMT) is based on peptide identification by accurate measurement of a peptide mass and its retention time in a chromatographic column. The advantage of this method is lack of requirement for MS/MS analysis, which would take additional time and a large quantity of the analyzed sample.
Standard bottom-up or top-down approaches employ genome or proteome databases containing protein sequences for protein identification. In the case of the accurate mass and time tags (Fig. 1) only an accurate mass of a peptide product of hydrolysis and its retention time on a chromatographic column are taken into consideration. It is subsequently identified using a preliminarily constructed AMT tag database.
The method includes two stages (Fig. 1). The first stage is filling of a database on the proteome of a particular biological material: peptide tags (with masses measured using ion cyclotron resonance mass spectrometer and their identification by subsequent MS/MS analysis) and their normalized retention times. The second stage is the search for coincidence between mass and time data with corresponding parameters of the AMT tag database constructed in the first stage.Fig. 1. Scheme of procedures for preparation and filling of AMT tag database and proteome screening by means of this database.
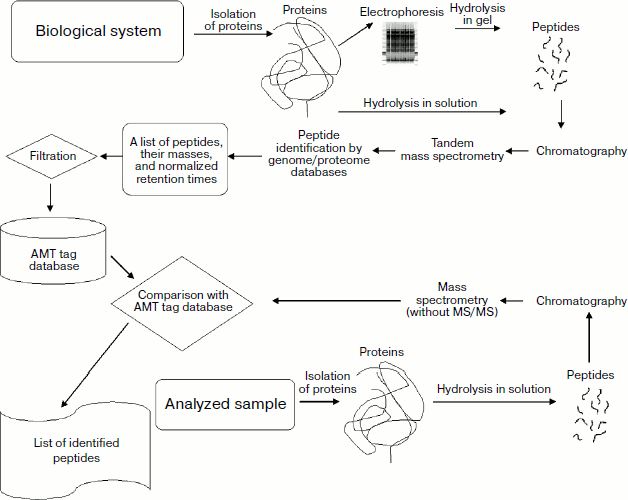
AMT tag database filling comprises two stages. Since modern high precision mass spectrometers of the new generation (e.g. LTQ-FT or LTQ-Orbitrap) are hybrid instruments and it is possible to measure an accurate mass of the parent ion and masses of fragmentation products in an ion trap, these stages can be combined into a single step.
In this study we have constructed the AMT tag database of human urine. The study was performed using a Fourier transform ion cyclotron resonance mass spectrometer and an original modification of the algorithm for filling of this database. Urine is the most available biological fluid, and it is used for search and screening of various biomarkers. The results and a freely available database can be widely used in proteomic studies of urine including the field of molecular medicine.
MATERIALS AND METHODS
Urine sample preparation. Urine samples of 18 male subjects (aged from 18 to 35 years) were used in the study. The volunteers did not have urogenital pathology, kidney pathology, arterial hypertension, or diabetes mellitus; they did not use diuretics or have excessive liquid consumption. After urine collection into sterile polypropylene containers, each sample was inventoried.
Collected urine samples were primarily treated within 30 min after collection. Urine was centrifuged at 2000g for 10 min at 4°C, and the supernatant was subdivided into three or more portions (15 ml each). Samples were frozen at –80°C.
The samples were then transported in a Dewar flask with liquid nitrogen; all documentation including an inventory number of the sample, time and date of urine collection, age, unhealthy habits, results of test strips, clinical parameters of the volunteer, and information about possible pathology was kept in Excel format.
Sample preparation for chromatography–mass spectrometry. Samples were concentrated as follows: the urine sample (15 ml) was placed into an Amicon Ultra Ultracel-15 5 k tube (Millipore, USA) and centrifuged at 1000g for 1 h at 4°C. The resultant concentrate of 500 µl was then evaporated to dryness in a centrifuge evaporator.
All materials and reagents were from Sigma (USA) unless otherwise specified.
The final residue was dissolved up to protein concentration of 10 g/liter (taking into consideration that protein concentration in urine is about 0.1 g/liter) using a buffer for reduction containing 0.2 M Tris-HCl, pH 8.5, 2.5 mM EDTA, 8 M urea (final concentration corrected for 0.3 M urea in urine).
Cysteine residues in proteins were reduced as follows. The solution of urinary proteins was mixed with 0.1 M dithiothreitol (final concentration), purged with nitrogen for 25-30 sec, and incubated at 37°C.
For alkylation of reduced SH groups, the reaction mixture was kept on ice and then supplemented with small amount of concentrated aqueous solution of iodoacetamide up to its final concentration of 0.05 M. The mixture was gently mixed and then purged with nitrogen for 25-30 sec. After incubation of the reaction mixture at room temperature for 15 min in darkness, the reaction was stopped by adding molar excess of 2-mercaptoethanol (about 10 µl per mg of added dithiothreitol).
Proteins were then re-sedimented for subsequent purification. The reaction mixture was treated with 10 volumes of acetone containing 0.1% (v/v) trifluoroacetic acid. The mixture was kept overnight at –20°C and then centrifuged at 12,000g for 10 min at 4°C. The sediment was resuspended in 96% ethanol (v/v), centrifuged again at 12,000 rpm for 10 min at 4°C, and dried in the centrifuge evaporator for 1 h at 45°C.
Trypsinolysis of the urinary protein fraction was performed as follows. The dry protein residue was resuspended in 200 mM NH4HCO3 up to final concentration of about 1 g/liter. A stock solution of modified porcine trypsin (Promega, USA) was added at the ratio to protein of 1 : 100 (w/w). The mixture was incubated at 37°C for 2.5 h and the stock solution of trypsin was added again at the ratio to protein of 1 : 200 (w/w). The reaction mixture was incubated at 37°C for 6 h.
Protein hydrolysis was stopped by adding formic acid to the final concentration of 3.5% (v/v). The solution was centrifuged at 12,000g for 10 min at 4°C, and the supernatant was used for chromatography–mass spectrometry.
Chromatography–mass spectrometry and analysis of mass spectra. For filling of the database, each hydrolysate obtained from the 18 urine samples was subjected to five independent rounds of chromatography–mass spectrometry procedures (five column loadings). Ninety samples were applied to the column to obtain the required number of mass spectra.
An Agilent 1100 chromatograph equipped with a column (inner diameter of 75 µm) with reverse phase Reprosil-Pur C18 3 µm and pores of 100 Å was used for liquid chromatography. Water and acetonitrile (for HPLC; Thermo Fisher, USA) with a linear gradient from 10 to 90% acetonitrile were used as solvents. Mass spectra were measured using a cyclotron resonance mass spectrometer coupled to the linear ion trap Thermo LTQ-FT.
Measurements were performed in the range of masses 300-2000 Da, and both parts of the combined mass spectrometer were used: masses of parent ions and their charge states were measured by ion cyclotron resonance. For ions with detected charge state, the collision-induced dissociation (CID) spectra were measured in the linear ion trap.
Peptide identification by their MS/MS spectra was performed by the Mascot search engine with the MS/MS search procedure [4] and accuracy parameters for the parent ion of 10 ppm and accuracy of mass fragment of 0.3 Da against Homo sapiens taxonomy using the Swiss Prot database.
In chromatography–mass spectrometry experiments without MS/MS fragmentation, a hydrolysate of protein fraction obtained from one urine sample (treated as above) was used for verification of the AMT tag database search. Mass spectrometry analysis was performed exactly as in the case of database filling but without ion fragmentation. After treatment of spectra, retention times were normalized using our original procedure described in “Results and Discussion”. Masses and retention time values were compared against the AMT tag database for detection of coinciding peptides with mass accuracy parameters (10 ppm) and retention time values (1% of chromatogram duration). Identification required coincidence of both retention time and mass.
RESULTS AND DISCUSSION
Using chromatography mass spectrometry of hydrolysates of urine sample (the bottom-up approach) we have obtained mass spectra of protein hydrolysis products containing more than 1381 peptide tags (see Table 1 in the supplement to the article on the journal site http://protein.bio.msu.ru/biokhimiya); for each peptide the following parameters have been included into the database: accurate mass value, retention time, and amino acid sequence.
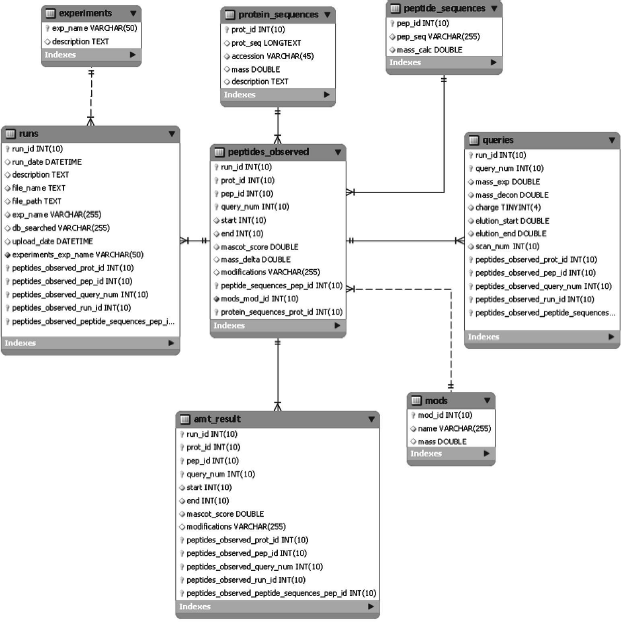
Structure of the AMT-tag database and protocol of its filling. The relational database management system (RDBMS) MySQL (release 5.0.45) with open code and freely distributed with the GNU General Public License was used as the basis.
The database structure (Fig. 2) can simultaneously maintain several projects, reveal similarities and differences of experiments, and perform search by the AMT tag. The database contains information on masses and retention times of peptides, posttranslational modifications of each peptide, its charge state, and theoretically calculated mass. The database structure was originally designed in the third normal form and then denormalized to increase treatment capacity of queries by key tables [8].
The database contains eight main tables (Fig. 2). The table “experiments” keeps information on current projects (their code name and brief description). Each project can contain several experiments; their descriptions are in the table “runs”. Two tables “protein_sequences” and “peptide_sequences” contain amino acid sequences and identifiers of proteins and peptides, respectively. The table “mods” contains descriptions of all posttranslational modifications found during data loading into the tables. These tables serve to decrease database file sizes. The table “peptides_observed” is a central table linking together all components. This table keeps unfiltered all peptides found by the search engine. The table “mascot_result” contains only filtered, reliably identified peptides. This table represents the AMT tag database.Fig. 2. Structure of the AMT tag database.
Inclusion of a peptide into the database requires two our criteria. First, reliability of peptide identification should exceed 99.5% (peptides are scored by the Mascot engine [4], which determines reliability of identification). Second, each protein should contain at least two identified peptides.
Thus, we have proposed the following stepwise algorithm for selection of peptides and proteins: 1) select peptides with the Mascot score [4] corresponding to reliability exceeding 99.5%; 2) based on information provided by the Mascot software (during treatment of spectra), prepare a table for all proteins sharing these peptide in their sequences; 3) range proteins of this table by the score equal to sums of scores of their individual peptides; 4) sort proteins by their resultant scores; 5) select a protein with the highest score and include it (and all its peptides) into the second final score; 6) remove this proteins and all its peptides from the initial table; 7) repeat this algorithm starting from step 5 until total removal of all proteins from the initial table.
Originally identified urine proteins. As mentioned above, results of mass spectra identification in hydrolysates of all samples have been used for database filling (Fig. 3). In the analyzed samples, we have identified several proteins that have not been identified by proteomic methods before (compared with the most comprehensive urine proteome [9]). Taking into consideration proteins with a single reliably identified peptide (proteotypic peptides identified at Mascot score exceeding 24), we have originally identified 45 gene products, and 23 of them are identified in more than one repeated experiment (see Table 3 in the supplement to the article on the journal site http://protein.bio.msu.ru/biokhimiya). These proteins do not share localization or biological function. It should be noted that this list contains several secretory plasma proteins, for example retinol binding protein 3 (International Protein Index IPI00022337.1), abundant in plasma apolipoprotein A-I (IPI00021841.1), and protease inhibitor alpha-1B-glycoprotein (IPI00022895.7). This list also contains some transmembrane plasma proteins including such important and adhesive molecules as cell adhesion molecule 4 (IPI00176427.1), cadherin 24 (IPI00307446.4), vasorin (IPI00395488.2), hyaluronic acid receptor 1 (IPI00290856.4), CD27 (IPI00002435.1), and others.
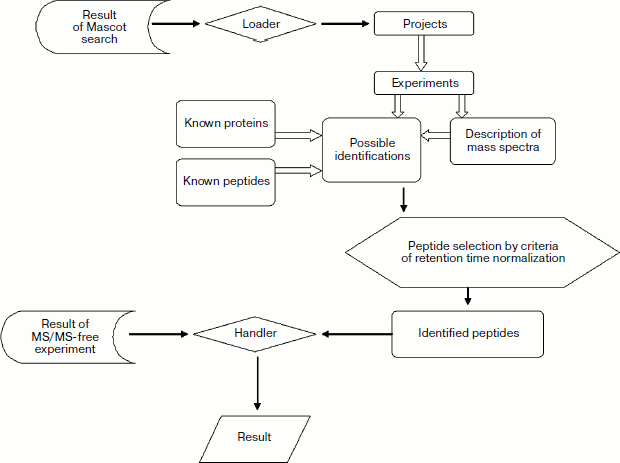
Normalization of peptide retention time in the course of filling and use of database. Alignment or normalization of retention time is an important problem for both steps of AMT tag database use (i.e. database filling and use for protein identification). However, solution of this problem in the course of filling and application is different.Fig. 3. Scheme of internal structure of database and standard procedure for search and filling.
In the case of retention time alignment for database filling, normalization employs identifications found by the Mascot search system [4] among tandem mass spectra: this requires coincidence of predicted amino acid sequence rather than retention times or masses. The presence of more than one identical peptide in all normalized chromatograms is an ultimate precondition for such procedure. Initially mean retention time for identification of peptides found in all MS/MS experiments is determined. Subsequently, alignment of retention time values for other AMT tags is performed by means of the least squares method.
In the case of retention time normalization in experiments without fragmentation, only accurate mass values are used. Initially only the mass/time pairs, in which accuracy of mass coincidence with the peptide mass of the AMT tag database is rather low (about 100 ppm), are selected from the chromatogram. The next step uses only such pairs that exhibit sequentially better correspondence of their retention times with those for peptides from the AMT tag database. The mass chromatogram is aligned by the least squares method using the order of such points for normalization.
Model experiment and identification without tandem-mass spectrometry. For validation of applicability of our AMT tag database and software for proteome analysis, we have obtained mass spectra of one hydrolysate of urine protein fraction. In this experiment masses of fragment ions of product hydrolysis were not determined. Results of identification using the AMT tag database are shown in Table 2 in the supplement to the article on the journal site http://protein.bio.msu.ru/biokhimiya. Using such approach (without MS/MS) we identified about 300 peptides.
Thus, based on results of this study we propose a new method for peptide selection for the AMT tag database, procedures for peptide identification by chromatograms without determination of masses of fragment ions, and also for normalization of results of MS/MS and MS experiments.
As the result of 90 experiments performed on 18 urine samples, we have found 437 proteins and 1381 peptides that satisfy the developed procedure for peptide selection. We have also developed software for qualitative analysis of urine proteins by means of liquid chromatography combined with high-precision mass spectrometry, which is available on request.
The authors are grateful to Dr. S. A. Melnik (Department of Proteomic Studies, IBMC RAMS) for his help in sample preparation.
This work was supported by the Federal Agency on Science and Innovations within the Federal Targeted Program “Research and Developments in Priority Areas of Science and Technology of Russia for 2007-2012” (State contract No. 02.512.11.2329), the Russian Academy of Sciences within the Program “Fundamental Sciences for Medicine”, and the Russian Foundation for Basic Research (grants 09-04-12130-ofi_m, 09-04-12225-ofi_m, 09-04-000725-a).
REFERENCES
1.Knorre, D. G., and Myzina, S. D. (2000)
Biological Chemistry [in Russian], Vysshaya Shkola, Moscow.
2.Bogdanov, B., and Smith, R. D. (2005) Mass
Spectrometry Reviews, 24, 168-200.
3.Pappin, D. J., Hojrup, P., and Bleasby, A. J.
(1993) Curr. Biol., 3, 327-332.
4.Perkins, D. N., Pappin, D. J. C., Creasy, D. M.,
and Cottrell, J. S. (1999) Electrophoresis, 20,
3551-3567.
5.Kelleher, N. L., Lin, H. Y., Valaskovic, G. A.,
Aaserud, D. J., Fridriksson, E. K., and McLafferty, F. W. (1999) J.
Am. Chem. Soc., 121, 806-812.
6.Wehofsky, M., and Hoffmann, R. (2002) J. Mass
Spectrom., 37, 223-229.
7.Conrads, T. P., Anderson, G. A., Veenstra, T. D.,
Pasa-Tolic, L., and Smith, R. D. (2000) Anal. Chem., 72,
3349-3354.
8.Powell, G. (2005) Beginning Database Design,
Wrox, New York.
9.Adachi, J., Kumar, C., Zhang, Y., Olsen, J. V., and
Mann, M. (2006) Genome Biol., 7, R80.
Supplementary TABLE 1 (MS Excel)
Supplementary TABLE 2 (MS Excel)
Supplementary TABLE 3 (MS Excel)