Isoforms of Human O-GlcNAcase Show Distinct Catalytic Efficiencies
Jing Li*, Cai-luan Huang, Lian-wen Zhang, Lin Lin, Zhong-hua Li, Fu-wu Zhang, and Peng Wang*
College of Pharmacy and State Key Laboratory of Element-Organic Chemistry, Nankai University, Tianjin 300071, China; fax: +86-22-2350-6290; E-mail: jinglink@nankai.edu.cn; pwang@nankai.edu.cn* To whom correspondence should be addressed.
Received March 29, 2010; Revision received May 21, 2010
O-GlcNAcase (OGA) is a family 84 glycoside hydrolase catalyzing the hydrolytic cleavage of O-linked β-N-acetylglucosamine (O-GlcNAc) from serine and threonine residues of proteins. Thus far, three forms of OGA have been identified in humans. Here we optimized the expression of these isoforms in E. coli and characterized their kinetic properties. Using Geno 3D, we predicted that N-terminal amino acids 63-342 form the catalytic site for O-GlcNAc removal and characterized it. Large differences are observed in the Km value and catalytic efficiency (kcat/Km) for the three OGA variants, though all of them displayed O-GlcNAc hydrolase activity. The full-length OGA had the lowest Km value of 0.26 mM and the highest catalytic efficiency of 3.51·103. These results reveal that the N-terminal region (a.a. 1-350) of OGA contains the catalytic site for glycoside hydrolase and the C-terminal region of the coding sequence has the ability to stabilize the native three-dimensional structure and further affect substrate affinity.
KEY WORDS: O-GlcNAcase, isoform, substrate affinity, catalytic efficiencyDOI: 10.1134/S0006297910070175
Abbreviations: DTT, dithiothreitol; fOGA, full-length O-GlcNAcase; IPTG, isopropyl-L-thio-β-D-galactopyranoside; LB, Luria–Bertani (broth); MGEA5, meningioma expressed antigen 5; 4-MU-GlcNAc, 4-methylumbelliferyl-2-acetamido-2-deoxy-β-D-glucopyranoside; OGA, O-GlcNAcase; PCD, programmed cell death; sOGA, the shortest OGA; vOGA, variant of OGA.
O-GlcNAcylation is a newly discovered post-translational
modification in cell regulation of signal transduction and now has been
found in all metazoans [1-3].
So far, more than 1000 proteins (including nuclear pore proteins,
cytoskeletal proteins, transcription factors, oncogenic proteins, tumor
suppressor proteins, etc.) have been identified to be
O-GlcNAcylated and these proteins are involved in many important
cellular processes such as transport, transcription, cell shaping, cell
signaling, and apoptosis [4-6].
Analogous to phosphorylation/dephosphorylation, the cycle of
addition/removal of the sugar moiety is rapid. Emerging data have
demonstrated that O-GlcNAcylation can play an important role in
many human diseases such as type II diabetes, cancer, and neurological
disorders [7-9].
In mammals, O-GlcNAc cycling is regulated by two enzymes: O-GlcNAc transferase (OGT, EC 2.4.1.94) and O-GlcNAcase (OGA, EC 3.2.1.52), which are products of single genes [10, 11]. Based upon MS/MS sequencing, the human OGA gene has been cloned from brain [11]. Sequence alignment indicates that this gene is identical with MGEA5 (meningioma expressed antigen 5), which locates at 10q24.1-q24.3, a region associated with Alzheimer’s disease [12]. The human OGA gene is capable of producing two separate transcripts, and each encodes a different OGA isoform. The long isoform gene consists of 16 exons and encodes a full-length protein with 916 amino acids. This full-length O-GlcNAcase (fOGA) is a bifunctional enzyme consisting of two domains: an N-terminal hydrolase catalytic domain belonging to glycoside hydrolase family 84 and a C-terminal domain belonging to the GCN5-related family of histone acetyltransferases [13]. The spliced transcript variant of OGA (vOGA) is the product of alternatively spliced transcript of OGA gene, which ignores the 5′-splicing site of intron 11 resulting in a longer exon 10 with an alternative stop codon, and it encodes a truncated protein of 677 amino acids [14]. Using cell fractionation and immunofluorescence staining, it has been shown that fOGA is primarily cytoplasmic, while vOGA is nuclear in location [15]. Based on sequence and structural information, we predicted that the N-terminal a.a. 63-342 is the catalytic site for O-GlcNAc removal and created another OGA variant – sOGA (the shortest OGA), which is a region corresponding to amino acids 1-350 of the amino terminus.
These three forms of OGA have identical N-terminal 1-350 amino acids, but differ in their C-terminal region (Fig. 1). Although glycoside hydrolysis activity has been reported for the three forms previously, a number of aspects about the catalysis are not clear. Is there a difference in the catalytic efficiencies of these OGAs? What is the structural basis for the glycoside hydrolase activity? What is the role of the C-terminal region in catalysis? In addition, one of the major bottlenecks for structural studies on OGAs of human origin has been the poor expression levels of the enzyme. To address these issues, we optimized the production of OGA forms using an E. coli expression system and then purified them. Using 4-MU-GlcNAc (4-methylumbelliferyl-2-acetamido-2-deoxy-β-D-glucopyranoside) as substrate, their steady-state kinetics were determined. The model of the catalytic domain of hOGA provides the structural basis for the hydrolytic activity of the hOGAs.
Fig. 1. Diagrammatic representation of three variants of human O-GlcNAcase. fOGA (full-length O-GlcNAcase) is the longest isoform and is composed of an N-terminal O-GlcNAcase domain, a linker region, and a C-terminal acetyltransferase domain. vOGA (spliced variant) contains the N-terminal O-GlcNAcase domain and the linker region. sOGA (hydrolase catalytic domain) is the smallest OGA consisting of N-terminal amino acids 1-350.
MATERIALS AND METHODS
Bacterial strains, plasmids, and materials. Human O-GlcNAcase cDNA (GenBank accession number AB014579) was kindly provided by Dr. Hart from the Medical School of Johns Hopkins University. Escherichia coli DH5α was purchased from Gibco-BRL Life Technology (USA). Escherichia coli BL21(DE3) was from Novagen Inc. (USA). pET-28a and pET-32a were purchased from Novagen. Restriction enzymes were obtained from Fermentas (USA). Ex Taq, Taq DNA polymerases, and T4 ligase were bought from Takara (China). 4-MU-GlcNAc (4-methylumbelliferyl-2-acetamido-2-deoxy-β-D-glucopyranoside) was purchased from Sigma Aldrich (USA). Other chemicals were of the highest grade from commercially available sources.
Cloning of fOGA, vOGA, and sOGA. Three OGA genes were amplified by PCR using the following primers and procedures. All primers were designed using the Primer Premier 5.0 program. Since the N-terminal 1-350 amino acids are identical, one forward primer was used for amplifying the three genes. The primer sequences were as follows: f-forward, 5′CGCGCGGCCGCGTGCAGAAGGAGAGTCAA3′ (NotI); f-reverse, 5′GCGCTCGAGTTACAGGCTCCGACCAAGT3′ (XhoI); v-reverse, 5′GCGCTCGAGAAGGGACAATATATTTGAGGAGAA3′ (XhoI); s-reverse, 5′GCGCTCGAGTTAATCTTCACTGTCAGTCATC3′(XhoI). The PCR products were subcloned in-frame into pET-28a and pET-32a between NotI and XhoI sites. The resultant constructs with OGA gene were subsequently transformed into E. coli DH5α for amplification and then into E. coli BL21(DE3) for protein expression. The insertion of each gene was confirmed by restriction mapping and sequencing.
Overexpression and purification of the OGAs. Escherichia coli BL21(DE3) transformed with the expression plasmid was grown in Luria–Bertani (LB) broth supplemented with 50 µg/ml kanamycin at 37°C at 200 rpm. Protein expression was initiated by the addition of IPTG (isopropyl-L-thio-β-D-galactopyranoside) to a final concentration of 0.01-0.5 mM when the optical density at 600 nm reached around 0.6. The cultures were further grown for 5-15 h at 16°C at 150 rpm. Cells were harvested by centrifugation and resuspended in 50 mM phosphate buffer, pH 8.0, 300 mM NaCl. The cells were sonicated using a Vibra Cell Sonifier (Scientz-IID, China) with a 19 mm-threaded probe. The sonication conditions were 10 sec per cycle (pulse on time is 2 sec, and pulse off time 8 sec), 40% output, and sonication for 30 min. Cell debris was removed by centrifugation (13,000g, 30 min, 4°C), and the supernatant was loaded onto a Ni2+-NTA (nickel-nitrilotriacetic acid) column (Qiagen, USA). After vigorous washing, the bound protein was eluted using 50 mM phosphate buffer, pH 8.0, 300 mM NaCl, and 300 mM imidazole. A Microcon YM-50/YM-100 microconcentrator (Millipore, USA) was used for buffer exchange and concentration. The recombinant protein was exchanged into 50 mM Tris-HCl buffer, pH 7.0, containing 1 mM dithiothreitol (DTT), 10% glycerol, and 150 mM NaCl. Protein concentration was estimated by the Bradford method [16]. The purity and apparent molecular mass were determined by SDS-PAGE [17].
Model of human OGA. A model of the catalytic domain of human OGA was generated using Geno 3D [18]. Amino acids 63-342 of human OGA matched with the primary amino acid sequence of PDB entry 2CBI, showing an identity of 34% and an E value of 1·10–144. After energy minimization, a model of OGA (residues 63-342) was obtained; it had excellent geometry as judged by Ramachandran analysis.
Enzymatic assays. Assays were carried out according to the method of Macauley [19]. 4-MU-GlcNAc was used as the fluorescent substrate; 25 µl of the reaction mixture consisted of the substrate suspended in 50 mM NaH2PO4, 100 mM NaCl, and 0.1% BSA at pH 6.5. Assays were initiated by the addition, via syringe, of enzyme (2-6 µl), and the reaction mixture was incubated at 37°C for 4-30 min. The enzymatic reactions were quenched by the addition of 150 µl of quenching buffer (200 mM glycine, pH 10.75). A standard curve of 4-MU (4-methylumbelliferone) was obtained using a Varian Cary Eclipse fluorescence spectrophotometer 96-well plate system. Fluorescence was measured at the excitation wavelength of 368 nm and the emission wavelength of 450 nm. The produced 4-MU was determined and compared with the standard curve. All assays were performed in triplicates under identical conditions.
RESULTS
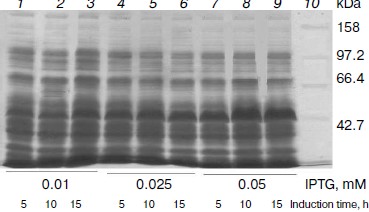
Expression of OGA. To obtain high expression, the concentration of the inducer, induction time, and induction temperature were optimized. Induction temperature is a key factor for soluble expression. When it was above 16°C, most of the protein was insoluble. So 16°C was employed for expression. Briefly, E. coli BL21(DE3) cells transformed with pET28a-sOGA were grown in liquid medium at 37°C until the optical density at 600 nm reached around 0.6. The effect of the concentration of IPTG and the induction time on the expression of OGA was determined by inducing individual cultures under different inducer concentrations (0.01-0.25 mM) and induction times (5-15 h). After inductions at 16°C, 10 ml of bacterial culture was centrifuged and disrupted by sonication. The supernatants of crude extracts were analyzed by 10% SDS-PAGE. The results demonstrated that His6-tagged sOGA reached maximum soluble expression after 10 h induction with 0.05 mM IPTG (Fig. 2). Similarly, the maximum production of fOGA and vOGA was obtained when the recombinant cells were induced for 10 h with the addition of 0.25 and 0.1 mM IPTG, respectively.
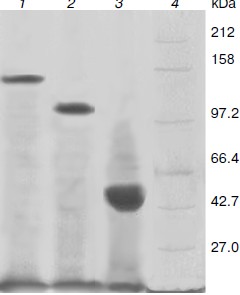
Production and purification of OGA. Using the optimal expression conditions, three His6-tagged OGA genes were overexpressed and purified by Ni2+-NTA chromatography. Recombinant fOGA, vOGA, and sOGA migrated at 130, 80, and 43 kDa, respectively, which is consistent with previous findings [20, 21]. Expression level of soluble active OGA was 5-15 mg per liter of the culture. After Ni2+-NTA affinity chromatography, the protein was more than 90% pure as judged by SDS-PAGE (Fig. 3).Fig. 2. Expression of His6-tagged sOGA. Lanes: 1) growth with 0.01 mM IPTG, 5 h; 2) growth with 0.01 mM IPTG, 10 h; 3) growth with 0.01 mM IPTG, 15 h; 4) growth with 0.025 mM IPTG, 5 h; 5) growth with 0.025 mM IPTG, 10 h; 6) growth with 0.025 mM IPTG, 15 h; 7) growth with 0.05 mM IPTG, 5 h; 8) growth with 0.05 mM IPTG, 10 h; 9) growth with 0.05 mM IPTG, 15 h; 10) protein marker.
Characterization of OGA. Initial velocities of the enzymatic reaction were determined by varied 4-MU-GlcNAc concentrations. Kinetic parameters including Michaelis constants (Km), turnover numbers, and enzymatic efficiencies were calculated from Lineweaver–Burk plots (Fig. 4). The specific activity of each OGA was calculated with the methods described in “Materials and Methods”.Fig. 3. SDS-PAGE of the human OGAs expressed and purified from E. coli. Lanes: 1) fOGA; 2) vOGA; 3) sOGA; 4) protein marker.
fOGA had a Km of 0.26 mM and a specific activity of 526 nmol/min per mg with a turnover rate of 0.9 sec–1. Catalytic efficiency (kcat/Km) of fOGA was 3.5·103 sec–1·M–1. Similarly, vOGA and sOGA exhibited Km values of 0.7 and 1.84 mM and specific activities of 84 and 9 nmol/min per mg, respectively. Based on these data, the turnover numbers of vOGA and sOGA were approximately 0.11 and 0.006 sec–1 and catalytic efficiencies were 1.57·102 and 3.26 sec–1·M–1, respectively. The kinetic values for the three OGA isoforms are summarized in the table.Fig. 4. Enzyme kinetics of the three His6-tagged OGAs expressed by pET-28a(+). An activity curve and a Lineweaver–Burk plot were generated by varying concentrations of substrate (4-MU-GlcNAc). a) fOGA; b) vOGA; c) sOGA.
Kinetic parameters of His6-tagged recombinant human OGAs
Catalytic domain of human OGA is reminiscent of glucosidases. The N-terminal amino acids 63-342 of OGA could be modeled successfully using Geno 3D (Fig. 5a; see color insert). Analysis of this model revealed that the N-terminal region spanning amino acids 63-342, folds into a classical (α/β)8 TIM barrel structure commonly found in glucosidases. Three OGA forms have this identical region and all showed glucosidase hydrolysis activity in this study.
The active site pocket could be identified by superimposing the NAG-thiazoline (NGT) moiety of the bacterial O-GlcNAcase (PDB code 2CHN) on the modeled human OGA (Fig. 5b). Catalysis proceeds via a substrate-assisted mechanism involving the acetamido group. The acetamido group is in the vicinity of D174, which is critical for the polarization and correct orientation of the group for a nucleophilic attack at the carbonyl carbon. D175 probably assumes the role of catalytic acid. A pair of aspartates is found at similar locations in the bacterial O-GlcNAcase structures [22]. Y219 is within hydrogen bonding distance of the glycosidic oxygen. A tyrosine at a similar position in GH85 family of glucosidases was shown to activate a water molecule for a nucleophilic attack during the hydrolysis [23]. Residues D174, D175, and Y219 of human OGA are conserved in bacterial O-GlcNAcases and have been shown to be critical for catalysis [22]. The model of human OGA (amino acids 63-342) provides a structural basis for the hydrolysis activity of the three forms of hOGA.Fig. 5. (Jing Li et al.) a) Cartoon representation of the catalytic domain of hOGA. Amino acids 63-342 of hOGA were modeled using Geno 3D. b) Structural basis for hydrolysis activity of hOGAs. NGT, from PDB code 2CHN, shown as yellow sticks, is superimposed over hOGA. Asp174, shown as sticks, is hydrogen bonded to the nitrogen atom.
DISCUSSION
In this study, initial steady-state enzyme kinetics for human OGAs were determined using 4-MU-GlcNAc as a substrate. fOGA has a Km of 0.26 mM and a catalytic efficiency (kcat/Km) of 3.5·103, while vOGA and sOGA exhibited higher Km values of 0.7 and 1.84 mM and lower catalytic efficiencies of 1.57·102 and 3.26, respectively. These results indicate that the N-terminal region harbors the catalytic site for O-GlcNAc removal, which is in agreement with many previous studies [19-21]. However, there are conflicting reports on enzymatic activity of vOGA [13, 15]. No activity was detected for vOGA expressed in either E. coli or COS-7 cells [15], and therefore the authors concluded that the C-terminus is necessary for O-GlcNAcase activity. We speculate that the ambiguity in the results could be a result of the expression strategy (enzyme was expressed with a thioredoxin tag) or because a less sensitive substrate (pNP-β-GlcNAc) was used for measuring the enzyme activity.
Thioredoxin (Trx) is an approximately 10-kDa protein fused on the N-terminus in pET-32 series to increase the solubility of recombinant proteins. To identify whether Trx impairs O-GlcNAcase catalytic activity, we subcloned three OGA isoform genes into pET-28a (with 6xHis tags only) and pET-32a (with 6xHis tags, S tag, and TRX tag), and large differences were observed in the enzyme kinetic parameters. The enzymatic activities of Trx-sOGA and Trx-vOGA were almost not detectable (data not shown). In addition, pNP-β-GlcNAc is a common substrate for standard OGA enzyme assay. Enzyme activity is monitored spectrophotometrically by measuring the absorbance at 400 nm of a p-nitrophenolate ion that is enzymatically released from pNP-β-GlcNAc [20]. Since the substrate undergoes only a modest change in absorbance upon cleavage, this assay is relatively insensitive. MUGlcNAc is a more sensitive fluorescence substrate for glycosidase assay; we used it to determine the kinetic parameters of the three OGA isoforms and obtained better results as expected.
O-GlcNAcylation is a highly dynamic process that is constantly responding to the extracellular environment [4, 5]. Cells under stress due to nutrient depletion or in an excessively nutrition rich environment were shown to have elevated levels of O-GlcNAc, which promoted cell survival [24]. Interestingly, the rate of O-GlcNAc cycling varies significantly for different proteins. In generally, the O-GlcNAc moiety of some nuclear proteins (e.g. nuclear pore proteins) is recycled slowly and has a longer half-life than that of the cytoplasmic proteins [4]. From our kinetic studies, we speculate that the difference in the half-life of the O-GlcNAc moiety on the proteins might be due to the different catalytic efficiencies of fOGA and vOGA.
In conclusion, we have subcloned, expressed, and characterized two isoforms of human OGA and a fragment of human OGA, designated fOGA, vOGA, and sOGA, respectively. The three recombinant forms of hOGA exhibited distinct enzymatic properties. fOGA displayed the lowest Km value and the highest enzymatic efficiency (kcat/Km). In comparison, vOGA and sOGA, harboring a truncated C-terminal region, showed much higher Km values and lower enzymatic efficiencies. Such differences in enzymatic efficiencies might help the OGA forms to adapt to different roles in different subcellular compartments and modulate their activities during different stages of cell development. Structural studies of human OGA support and provide structural basis for the hydrolysis activity of OGA.
The authors thank Dr. G. W. Hart from the Medical School of Johns Hopkins University for kindly providing the human O-GlcNAcase cDNA and Neil Shaw from the Institute of Biophysics, Chinese Academy of Science, and Xian-Wei Liu for kind assistance in revision of the paper.
This work was supported by the National Basic Research Program of China (973 Program, grant No. 2007CB914403).
REFERENCES
1.Henrissat, B., and Bairoch, A. (1996) Biochem.
J., 316, 695-696.
2.Wells, H., Vosseller, K., and Hart, G. W. (2001)
Science, 291, 2376-2378.
3.Torres, C. R., and Hart, G. W. (1984) J. Biol.
Chem., 259, 3308-3317.
4.Hart, G. W., Housley, M. P., and Slawson, C.
(2007) Nature, 446, 1017-1022.
5.Zeidan, Q., and Hart, G. W. (2010) J. Cell.
Sci., 123, 13-22.
6.Zhang, F., Su, K., Yang, X., Bowe, D. B., Paterson,
A. J., and Kudlow, J. E. (2003) Cell, 115, 715-725.
7.Yang, X., Ongusaha, P. P., Miles, P. D., Havstad,
J. C., Zhang, F., So, W. V., Kudlow, J. E., Michell, R. H., Olefsky, J.
M., and Field, S. J. (2008) Nature, 451,
964-969.
8.Fischer, P. M. (2008) Nat. Chem. Biol.,
4, 448-449.
9.Kang, J. G., Park, S. Y., Ji, S., Jang, I., Park,
S., and Kim, H. S. (2009) J. Biol. Chem., 284,
34777-34784.
10.Lubas, W. A., Frank, D. W., Krause, M., and
Hanover, J. A. (1997) J. Biol. Chem., 272, 9316-9324.
11.Gao, Y., Wells, L., Comer, F. I., Parker, G. J.,
and Hart, G. W. (2001) J. Biol. Chem., 276,
9838-9845.
12.Bertram, L., Blacker, D., Mullin, K., Keeney, D.,
Jones, J., Basu, S., Yhu, S., and Tanzi, R. E. (2000) Science,
290, 2302-2303.
13.Schultz, J., and Pils, B. (2002) FEBS
Lett., 529, 179-182.
14.Comtesse, N., Maldener, E., and Meese, E.
(2001) Biochem. Biophys. Res. Commun., 283, 634-640.
15.Wells, L., Gao, Y., Mahoney, J. A., Vosseller,
K., Chen, C., Rosen, A., and Hart, G. W. (2002) J. Biol. Chem.,
277, 1755-1761.
16.Bradford, M. M. (1976) Anal. Biochem.,
72, 248-254.
17.Laemmli, U. K. (1970) Nature, 227,
680-685.
18.Christophe, C., Martin, J., Gilbert, D., and
Christophe, G. (2002) Bioinformatics, 18, 213-214.
19.Macauley, M. S., Whitworth, G. E., Debowski, A.
W., Chin, D., and Vocadlo, D. J. (2005) J. Biol. Chem.,
280, 25313-25322.
20.Kim, E. J., Kang, D. O., Love, D. C., and
Hanover, J. A. (2006) Carbohydr. Res., 341, 971-982.
21.Cuetinbasu, N., Macauley, M. S., Stubbs, K. A.,
Drapala, R., and Vocadlo, D. J. (2006) Biochemistry, 45,
3835-3844.
22.Dennis, R. J., Taylor, E. J., Macauley, M. S.,
Stubbs, K. A., Turkenburg, J. P., Hart, S. J., Black, G. N., Vocadlo,
D. J., and Davies, G. J. (2006) Nat. Chem. Biol.,
13365-13371.
23.Yin, J., Li, L., Shaw, N., Li, Y., Song, J. K.,
Zhang, W., Xia, C. F., Zhang, R. G., Joachimiak, A., Zhang, H. C.,
Wang, L. X., Liu, Z. J., and Wang, P. (2009) PLoS ONE, 4,
e4658.
24.Zachara, N. E., and Hart, G. W. (2004)
Biochim. Biophys. Acta, 1673, 13-28.