Cellularity Loss and Dilman’s Problem: An in silico Study
V. A. Chistyakov1,2* and Y. V. Denisenko1
1Research Institute of Biology, Southern Federal University, pr. Stachki 194/1, 344090 Rostov-on-Don, Russia; E-mail: vladimirchi@yandex.ru2Rostov State Medical University, Pereulok Nakhichevansky 29, 344022 Rostov-on-Don, Russia; fax: (863) 201-4390
* To whom correspondence should be addressed.
Received April 1, 2012
We assume that prolonged trends of increasing concentration of hormones could be a consequence of deterioration of functioning of glands producing inhibitors of their synthesis. Such deterioration would result from loss of cellularity of the glands. Experiments in silico carried out using the model at http://www.winmobile.biz/monstr/ show that, in principle, the diversity of hormonal effects that accompany phenoptosis of multicellular organisms can be provided with a simple “software mechanism”. This mechanism is based on the gradual loss of cellularity as a result of continuous run of apoptosis in some cells of the glands due to natural fluctuations in levels of intracellular inducers of apoptosis. The main practical sense of our work lies in the illustration of the fact that substances inhibiting cellularity loss can theoretically be effective suppressors of hormonal changes characteristic for aging.
KEY WORDS: phenoptosis, apoptosis, aging, imitation modeling, cellularity loss, hormones, elevation theoryDOI: 10.1134/S0006297912070115
The analogy of the concepts of “phenoptosis” and “apoptosis” includes not only apparent similarity of processes designated by these terms. Natural decrease in the number of cells forming postmitotic tissues of a multicellular organism is usually “used” by nature for gradually decreasing the adaptabilities of aging forms. Apoptosis as set of programs of cellular suicide is a convenient tool for realization of the higher level phenoptosis program. A number of facts confirming this thesis have accumulated. However, complexity and diversity of the aging process greatly complicate logical analysis organizing these facts into a system. In our opinion, mathematical modeling, especially in the form of creating imitating models, can be a convenient auxiliary means in this case.
Multi-agent modeling can be used to form in silico a number of independent objects interacting among themselves and with the medium according to the rules set by the researcher. The point of applying mathematical methods is to achieve reproduction in silico of “external” manifestations of aging by means of the simplest “internal mechanism” [1, 2]. Such a mechanism will apparently be the most significant engine of aging. Naturally, modeling of the “internal mechanism” should be based on the biological facts, or at least not contradict them.
In paper [1] creation of a model allowing simulation of cellularity decrease of a homogeneous cell population with age is described. The biological component of the approach is based upon three points:
– aging of multicellular organism is connected mostly not to deterioration of cells, but to decrease in their number. This idea was first formulated by the outstanding physicist Leo Szilard [3]. Szilard’s calculations showed that the death of cells due to random internal events can cause age-dependent decrease in viability of an organism with dynamics coinciding with that observed in practice. For the event leading to death of a cell, Szilard introduced the “aging hit” concept;
– “aging hit” develops as a result of the beginning of cell death programs, in particular, of apoptosis;
– the program of cell death starts as a result of random level fluctuations of the corresponding stimulus, which is able to start the mechanism of programmed cell death.
The model created by us allows to see the decrease in the number of cells in which apoptotic signals are being generated; the differences in intensities of these signals follow the normal law. The death of some cells is initiated after an excess in the level of apoptosis signal that is similar for all cells. Even such a primitive model allows explanations of some experimental facts connected to studies of the new generation antioxidant SkQ1.
In paper [2] we described the aging model of Drosophila melanogaster – one of the most popular objects of experimental gerontology (http://winmobile.biz/moton/moto.html). The model is based on the same principles as those described in paper [1]. The survival of individuals generated by the program depends on the share of motoneurons remaining. Experiments in silico using this model can be used to generate survivor curves that are similar to curves obtained in experiments with real insects. Thus, by synthesis of ideas about cellularity loss as the basis of aging, about programmed cell death, and also taking into account free-radical aging theories, it was possible to develop an elementary mechanism simulating important elements of the phenomenology of aging. Aging modeling of drosophila is facilitated by the fact that it is a postmitotic short-lived organism. Aging of such forms is the simplest and the most obvious example of the phenoptosis and apoptosis interface.
Aging of more complex and long-lived animals is caused by complicated changes in hormonal regulation. It is accompanied by failures of such fundamental cycles as sleep-wake cycle, estrous and menstrual cycles, etc. At the same time, various phenomena are observed – from failure of hormonal cycles to age increase in the concentration of certain hormones with subsequent dramatic decrease of their production. The beginning and termination of hormonal cycles define the beginning and the termination of postnatal ontogenesis stages.
The scientific analysis of the role of cyclic processes in the functioning of the aging program was carried out by V. M. Dilman. He pointed out the problem of the contradiction between homeostasis and development, key for developmental biology as a whole, and for gerontology in particular. Statement of this problem is, in our opinion, Dilman’s main contribution to aging theory. In short, the basic idea of Dilman can be described as follows: (1) the constancy of biosystem parameters including concentration of hormones is supported by mechanisms of negative feedback; (2) but for development long trends of hormone concentrations, in particular reproductive hormones, should exist; (3) Dilman considered that such trends are created (and, accordingly, a problem is solved) at the expense of decreasing trends in sensitivity of receptors, and trends of receptors sensitivity are set by changes of activity of genes; (4) eventually, sensitivity decreases so that it leads to pathological consequences (usual illnesses of aging).
The “cybernetic component” of Dilman’s ideas are most clearly stated in a popular scientific book [4]. Therefore, they were probably not taken seriously enough by experts in the area of aging modeling, and biologists and physicians have concentrated on the search for experimental proofs of existence of the mechanisms predicted by Dilman. At the same time, it is clear by intuition that to resolve the contradiction formulated in item (1) and (2) it is possible not only involving the additional mechanism described in item (3). We have assumed that long trends of the growth of hormone concentrations can be a consequence of functioning of deterioration of glands producing inhibitors of their synthesis that develops as the result of cellularity loss in these glands. The purpose of this paper is to develop a model allowing simulation of age changes in hormonal cycles on the basis of our assumption.
METHODS OF INVESTIGATION
For the quantitative analysis in silico, an imitating multi-agent model was created on the Java 2 platform. The biological sense of this model is described below.
There are several glands consisting of postmitotic cells. The quantity of a hormone produced by a gland depends on the number of cells in it. In a simple case when there are two glands, the hormone produced by the first gland activates the second gland, and the hormone produced by the second gland, inactivates the first gland. This minimum system with negative feedback leads to formation of cyclic fluctuations of concentrations of both hormones. If the number of the cells forming the second gland drops below a certain level, then in response to the hormone of the first gland the signal terminating its functioning ceases to be generated. This is actually loss of sensitivity to hormonal signals. Using a system of three glands allows making the behavior of the system more varied without changing its basic laws.
From the cybernetic viewpoint, the model is a system with negative feedback when the output signal is sent to the input and under certain conditions suppresses the input signal, coordinating the system condition in this way. In the model the system of three or two glands operating with feedback is scrutinized taking into account apoptosis and stochastic character of some processes induced by internal signals. The structure of three the gland model is shown in Fig. 1.
At the launch of the model, each gland is formed as set of independent agents (cells). Each agent possesses a set of parameters that are unique for the different glands. Gland A produces for each cell in a time unit (cycle) a certain quantity of hormone A, the production of which is subject to the normal law with the set parameters. In each cycle a fraction of the hormone is degraded. When (and if) the quantity of hormone A reaches the set threshold value, gland B is activated. It functions similarly to gland A. When hormone B reaches its threshold value gland C is activated. It also functions like glands A and B. Excess of threshold value by quantity of hormone C causes a pause in the functioning of gland A. The process of hormone production we see as quasi-stationary, when the distribution time of production speed changes is much less than the characteristic times in the system of glands. Cells of glands are mortal, and they die according to the laws stated in article [1]. As the investigated value, the relation of hormone concentrations in the medium to the period (of the cycle) is considered.Fig. 1. Scheme of the three gland model.
The model of two glands ideologically replicates the model of three with only one difference – absence of gland B (Fig. 2). The model parameters are completely adjustable (Fig. 3). The program is written in a user-friendly interface and does not demand any special user skills. The model is in open access at the address: http://www.winmobile.biz/monstr/
Fig. 2. Scheme of the two gland model.
Fig. 3. Control panel for entering model data.
RESULTS AND DISCUSSION
While scrutinizing the model of interaction of the glands, it is of great interest to reveal the distribution laws of hormone concentrations during a time period, to compare distribution of hormone concentrations taking into account cellularity loss and without it, and also to reveal features of the modeled behavior.
It should be pointed out that due to the stochastic setting of some model parameters, the discussion given below has substantially qualitative character. The cellularity loss scheme put forward in the model also has a probabilistic nature. Therefore, it is possible to judge quality indicators, but their quantitative values will vary from experiment to experiment.
Moreover, as shown below, changes in some values calculated in the model display behavior characteristic for catastrophe points, when a minor change of one parameter changes the system behavior both quantitatively and qualitatively [5].
The behavior of the systems with two and three glands was investigated. Not taking into account cellularity loss, the distribution picture of hormone concentrations during a time period is quite simple (Fig. 4). In Fig. 4a, the distribution of cell number in each gland during a time period (for non-aging glands – the dotted line parallel to the axis of time) is shown. Figure 4b shows the distribution of concentrations, which is a periodic function with shift of phase.
Cellularity loss was taken into account using methods developed earlier [1, 2]. As Fig. 5 shows, in case of cellularity loss the picture is more complex: the distribution curve amplitudes of concentration changes during the time period, and as more detailed consideration shows, the period of these curves also changes in time.Fig. 4. Functioning of system of three non-aging glands: a) distribution of cell number in each gland; b) distribution of concentrations of hormones A (—), B (····), and C (- - -).
As the experiments in silico showed, the behavior of two glands system is qualitatively similar to the behavior of three glands system (Fig. 6); however, the effects in the two gland system are more expressed. The two gland system model will be considered further.Fig. 5. Functioning of the system of three glands losing cellularity. Designations are the same as for Fig. 4.
As seen in Fig. 6, in the system of two glands losing cellularity united by the mechanism of negative feedback, there can be a distinct trend of increase in concentration of one of the hormones (in this case of hormone A). In Fig. 7b (scaled up), it is possible to observe that the peaks form variations of dependence curves of hormone concentrations during a time period that are present only in the system with cellularity loss.Fig. 6. Effects of hormone level increase, failure, and arrest of cycles in the system of two glands losing cellularity. Here and in Figs. 7, 8, 12, and 13, solid and dotted lines correspond to hormones A and C, respectively.
To reveal distribution laws of hormone concentrations during a time period, their frequency (Fig. 8) was analyzed. During consideration of the gland models taking into account cellularity loss, three sections of a curve in Fig. 8b can be seen quite clearly – the periodic frequency-modulated signal to the left of point 1, chaotic (at least visually) between points 1 and 2, and monotonously descending to the right of point 2.Fig. 7. Variations of peak shapes in the two gland system with cellularity loss.
In addition, it is necessary to take into account the fact that during model calculations only relative and/or standardized values are used. Therefore, it is necessary to deal with absolute values of any output parameters carefully. However, it should be pointed out that, as well as in living systems, at a typical short duration of 20-25 cycle periods (the time units used in model can be, for example, one cycle equal to one day) the duration of the transition period from periodic dependence to a monotonous phase is quite long – takes ~500 cycles. These numbers come from the individual setting of the initial model data (though this can fluctuate in different experiments).Fig. 8. Dynamics of frequency fluctuations of hormone concentrations. Minor fluctuations of concentration after a arrest of a hormonal cycle have stochastic character.
It can be seen that on the periodic segment roughly before cycle 2250, frequencies of fluctuations of hormones A and C completely coincide, so their frequency characteristics overlap. Then, over a period of 500 cycles the curve of fluctuation frequencies of hormone A concentration becomes asynchronous to the curve of hormone C (Fig. 8). After that both curves acquire monotonous descending character. It is worth mentioning that asynchronization of hormonal cycles with subsequent hormone production decline is one of typical manifestations of aging.
For further investigation of the model behavior, an attempt was taken to apply Fourier analysis [6]. It should be stressed that the classical kind this analysis is not quite suitable for studying non-stationary processes, as it is able to reflect only frequency characteristics of a signal. However, for revealing the general characteristics of this system, application of Fourier analysis seems to be reasonable.
Below is a picture of decomposition of temporal representation in frequency space for distribution curves of standardized values of hormone concentrations in the interaction models of two glands without (a) and with (b) account of cellularity loss (Fig. 9). For the calculations, the fast Fourier transformation algorithm was used. Due to the standardization of the values noted above, the signal form is interesting for us, but not its quantitative indicators.
From the displayed amplitude-frequency characteristic (AFC), it is possible to conclude that taking cellularity loss into account introduces a great number of additional frequency components into the signal. While the signal shown in Fig. 9a consists of the basic low-frequency signal and several minor high-frequency signals with much smaller amplitude, the signal in Fig. 9b contains a considerably greater number of frequency components. Hence, from the viewpoint of frequency characteristics the curve of hormone concentration changes taking into account cellularity loss consists of a considerably greater number of components. At the same time, this complexity does not result from the stochastic character of the model. The model of interaction of glands not taking into account cellularity loss also has stochastic character, but its AFC has a small number of frequency components. It can also be claimed that AFC of concentrations of hormones A and C have a similar but not identical appearance. In other words, aging of the system forming the hormonal cycles allows additional information about controlling the parameters of the system behavior that are supervised by genes in real systems. Thus, the frequency analysis of in silico experiments provides an absolutely unexpected acknowledgement of the reality of the idea of V. P. Skulachev as the basis of his mental experiment “with silly and clever hares” [7].Fig. 9. Fourier analysis of dynamics of hormone concentration changes in systems of non-aging (a) and aging (b) glands.
Unfortunately, the classical Fourier transformation does not allow us to draw conclusions about temporal characteristics of a signal that can also possess some peculiarities. For their investigation, it is necessary to address its frequency–temporal signal representation. Wavelet transformations refer to this group [8]. The analysis task in this case is rather simple: it is necessary to take two data sets and to display their wavelet spectrograms visually. If visual comparison reveals some peculiarities, their deeper analysis is carried out.
First of all the wavelet analysis of the results of functioning of the two gland model without taking into account cellularity loss was carried out. Wavelet transformation parameters were selected taking into account the requirements of revealing distinctions in data sets. In this case, pictures of wavelet transformations (Fig. 10) for hormone A (above) and hormone C (below) are similar. Besides, there are no noticeable temporal changes along the horizontal axis. As a matter of fact, after the Fourier analysis it is an expected result.
Then the wavelet plane was constructed for the signal taking into account cellularity loss (Fig. 11). A part of the plane is cut out and enlarged for visualization. It should be pointed out that visually the behavior peculiarities of the hormone concentration curves change synchronously. On the whole, the picture for hormone C replicates the picture for hormone A. At the same time, the picture in its first half is similar to a picture of a periodic process (though we know about its frequency modulation) (Fig. 9). The transitive segment where the pictures differ sharply is an exception.Fig. 10. Wavelet analysis of dynamics of hormone concentration changes in the system of non-aging glands.
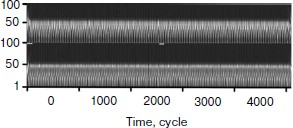
For clarification of the question about the origin of such distinctions, and also on the whole about the origins of nonstationarity, a model without stochastic elements was designed. At certain standard basic values, the stochastic model of cellularity loss in the specified initial conditions was approximated with an exponential.Fig. 11. Wavelet analysis of dynamics of hormone concentration changes in the system of aging glands.
For glands A and C:
NA(t) = 5123e(–0.0006t), (1)
NC(t) = 461.3e(–0.0006t), (2)
where t is the cycle number; NA(t) and NC(t) is the number of cells in the respective gland during a cycle at number t.
Numerical experiments, which showed the absence of qualitative differences from the stochastic model (Fig. 12), were carried out. On the basis of these calculations, a conclusion can be drawn that there is no considerable influence of stochastic processes on the picture of hormone concentration distributions in the system of glands.
Obviously, the reason for the changes is cellularity loss. At the same time, rather slow decrease in cell number in glands causes a considerable qualitative change in distribution of hormone concentrations. Let us draw the phase portrait [9] of system parameter changes with “standardized concentration of A hormone” – “standardized concentration of C hormone” location. In Fig. 13 both the phase portrait and the hormone concentration – time curve are represented. Within the periodic segment (to the left of point 1 in Fig. 13b) the phase curve converges to point 2 (Fig. 13a) along a concentric trajectory. To the right of point 1 the phase curve loses its regular character.Fig. 12. Effects of hormone level increase, failure, and cycle arrest in the system of two glands losing cellularity using the model without stochastic elements.
The regular character of the phase curve allows some assumptions based on its beginning about its further development. For example, after 4000 cycles hormone C concentration becomes equal to 0. It is easy to identify the concentration of A hormone corresponding to this point, having set the abscissa of point 3 at the very beginning of the phase portrait formation. Obviously, such concentration of hormone A corresponds to the threshold value for inactivating gland C.Fig. 13. Phase portrait of dynamics of hormone concentration changes in the system of aging glands.
If the assumption about catastrophic (in the mathematical sense) character of loss of hormone production regularity with cellularity loss proves true, it will be possible to put forward the question of looking for “accident flags” (events warning about the approach of a critical point) and to understand the pessimistic phrase of the founder of catastrophe theory Rene Thom: “Perhaps it will be possible to prove inevitability of some catastrophes, for example of illnesses or death” [5]. However, using our model, it is easy to show that catastrophic scenarios in development of hormonal cycles are connected to cellularity loss in glands that can in principle be “inactivated” at the expense of introduction of apoptosis signal generation inhibitors like SkQ or at the expense of changing the expression of a small number of genes.
The model of cellularity loss in a homogeneous cell population developed by us earlier can be used for imitation of processes of function decline in a gland, the cells of which produce a hormone regularly during its life. Decrease in cell number causes a decrease in hormone production with relevant physiological consequences. However, the principles of gland functioning are much more complicated. Many glands directly or indirectly influence functioning of each other, forming hormonal cycles. The phenomenon of gland sensitivity loss to signals of other glands is of great interest from the viewpoint of modeling of aging. It leads to failures in functioning of hormonal cycles important for aging.
According to the elevation theory created by Dilman first of all for solving problems of practical gerontology, the key moment of aging is hypothalamus sensitivity loss to hormonal signals that arrests the adjustable hypophysial–hypothalamic system of hormonal cycles [10]. The correctness of confirming this theory with a number of observations though carrying out the appropriate experiments unambiguously confirming validity of hypotheses is extremely complicated in gerontology. Our model clearly does not allow the substitution of calculations for biological experiments. Nevertheless, the experiments in silico help to show that the phenomenon of sensitivity loss to hormonal signals with subsequent arrest of cycles can be simulated in an elementary in silico system, and that cellularity loss can be the basis of this phenomenon, as well in the basis of the majority of gerontological phenomena. As seen in Fig. 5, cyclic character of hormone A production stops roughly after 2500th temporal cycles. Synthesis of hormone A intensifies. Thus gland A loses sensitivity to the inhibiting influence of hormone B mediated by gland C, which loses cellularity to a critical value up to this moment. The developed model also can be used to imitate irregularities of hormonal cycles that are characteristic for aging animals (Figs. 6 and 8).
Hormonal changes play an important role in regulation of animal ontogenesis. Genetic control of mammalian ontogenesis, at least in the postnatal phase, is mediated basically by changes in hormonal cycles. This idea is incorporated into our model. Varying a small number of parameters (Fig. 3) in living systems determined with the expression of genes controlling the level of apoptosis signals, a threshold of cells leaving into apoptosis, speed of synthesis, and disintegration of hormones, we can model such phenomena important for the aging process as regular changes in amplitude and frequency of fluctuations of hormone concentrations, the failures of hormonal cycles, and their termination connected to age, and also age-related increase in some hormone concentrations, which is connected to the inhibiting gland degradation. Our models show that basically the whole diversity of hormonal effects accompanying phenoptosis of multicellular organisms can be provided with a rather simple programmed mechanism. This mechanism is based on gradual cellularity loss as a result of systematic apoptosis beginning in some gland cells due to natural stochastic level fluctuations of endocellular apoptosis signal inducers. The main practical value of our work is the illustration of the fact that the substances inhibiting cellularity loss can theoretically be effective suppressors of hormonal changes characteristic for aging.
This work was completed with the financial support of the Institute of Mitoengineering of Moscow State University, the Ministry of Education and Science of the Russian Federation, the Federal Target Program grant “Scientific and Pedagogic Personnel of Innovative Russia” (state contract No. 14.740.11.0006), and the Ministry of Health and Social Development of the Russian Federation.
REFERENCES
1.Chistyakov, V. A., and Denisenko, Y. V. (2009)
Ros. Khim. Zh., 53, 105-110.
2.Chistyakov, V. A., and Denisenko, Y. V. (2010)
Uspekhi Gerontol., 23, 557-563.
3.Szilard, L. (1959) Proc. Natl. Acad. Sci.
USA, 45, 30-45.
4.Dilman, V. M. (1982) Big Biological Clock
(Introduction into Integral Medicine) [in Russian], Znanie,
Moscow.
5.Arnold, V. I. (1990) Catastrophe Theory [in
Russian], Nauka, Moscow.
6.Makarova, N. V., and Trofimets, V. Y. (2002)
Statistics in Excel [in Russian], Finansy i Statistika,
Moscow.
7.Skulachev, V. P. (2007) Biochemistry
(Moscow), 72, 1385-1396.
8.Astaf’eva, N. M. (1996) Uspekhi Fiz.
Nauk, 166, 1146-1170.
9.Chulichkov, A. I. (2003) Mathematical Models of
Non-linear Dynamics [in Russian], Fizmatlit, Moscow.
10.Anisimov, V. N. (2003) Molecular and
Physiologic Mechanisms of Aging [in Russian], Nauka, St.
Petersburg.