Primary Steps of Electron and Energy Transfer in Photosystem I: Effect of Excitation Pulse Wavelength
A. Yu. Semenov1*, I. V. Shelaev2, F. E. Gostev2, M. D. Mamedov1, V. A. Shuvalov1, O. M. Sarkisov2, and V. A. Nadtochenko2,3*
1A. N. Belozersky Institute of Physical-Chemical Biology, Moscow State University, 119991 Moscow, Russia; fax: (495) 939-3181; E-mail: semenov@genebee.msu.ru2N. N. Semenov Institute of Chemical Physics, Russian Academy of Sciences, ul. Kosygina 4, 119991 Moscow, Russia; fax: (499) 137-8357; E-mail: nadtochenko@gmail.com
3Institute of Chemical Physics Problems, Russian Academy of Sciences, pr. Akademika Semenova 1, 142432 Chernogolovka, Moscow Region, Russia
* To whom correspondence should be addressed.
Received May 21, 2012
Time-resolved differential spectra of photosystem I complex were obtained by the “pump–probe” technique with 25-fs pulses with maxima at 670, 700, and 720 nm. The ratio between the number of excited chlorophyll molecules of the antenna and of the reaction center was shown to depend on spectral characteristics of the pump pulses. In all cases, an ultrafast (<150 fs) formation of the primary radical pair P700+A0 was recorded. However, on excitation by pulses with maxima at 670 or 700 nm, detection of the charge separation was masked by the much more intensive bleaching at the chlorophyll Qy band due to excitation of the bulk antenna chlorophylls. We show that triggering the charge separation by 25-fs pulses centered at 720 nm allows to detect more clearly kinetics of formation of the primary and secondary ion-radical pairs. The findings help to explain possible reasons for discrepancies of kinetics of primary steps of electron transfer detected in different laboratories.
KEY WORDS: femtosecond absorption spectroscopy, photosystem I, reaction center, electron transfer, primary reactionsDOI: 10.1134/S0006297912090088
Abbreviations: A0, primary electron acceptor of chlorophyll; A1, quinone secondary electron acceptor; An, light-collecting antenna; Chl, chlorophyll; P700, chlorophyll dimer, the primary electron donor; PS I, photosystem I; RC, reaction center; XRSA, X-ray structure analysis; λ, wavelength.
In photosynthesizing organisms, the primary transformation of light
energy occurs in pigment–protein complexes that very efficiently
induce the transmembrane separation of charges initiating the
subsequent biochemical reactions in the cell. Chlorophyll
(Chl)–protein complexes of photosystem I (PS I) from
cyanobacteria, algae, and higher plants with low-potential
iron–sulfur clusters (FA/FB) acting as
terminal electron acceptors are type I photosynthetic reaction centers
(RC). PS I complexes are evolutionarily close to the RC of green sulfur
bacteria and heliobacteria and are significantly like them in structure
and function [1]. PS I is responsible for the
light-induced electron transfer from plastocyanin to ferredoxin. In
cyanobacteria, cytochrome c6 and flavodoxin are,
respectively, the alternative donor and acceptor.
The three-dimensional structure of PS I has been solved by X-ray structural analysis (XRSA) at the resolution of 2.5 Å in crystals of this complex from the thermophilic cyanobacterium Synechococcus elongatus [2]. In higher plants, PS I complexes are monomers, whereas in various cyanobacteria they form trimers [3]. Each monomer (~300 kDa) contains one copy of 12 different protein subunits. The core of the complex consists of two large subunits (products of genes PsaA and PsaB), which bind 96 Chl a molecules, 22 β-carotene molecules, two phylloquinone molecules, and an inter-polypeptide iron–sulfur cluster FX. The majority of Chl a molecules act as pigments of the antenna. The terminal iron–sulfur clusters FA/FB (of the 4Fe4S type) are bound to the peripheral stromal subunit PsaC, which has a molecular mass of ~9 kDa.
Cofactors of electron transfer are located on subunits PsaA, PsaB, and PsaC, which form the core of PS I complex. The stromal subunits PsaD and PsaE do not contain redox cofactors and are necessary for the PS I binding and effective interaction with external acceptors. The primary electron donor P700 consists of two molecules of Chl a (ChlA1/ChlB1) with their porphyrin planes parallel to each other (at distance of 3.6 Å) and perpendicular to the membrane plane. XRSA of PS I crystals also revealed two electron planes belonging to Chl a molecules in positions corresponding to additional molecules of bacteriochlorophyll in the RC of purple bacteria (ChlA2/ChlB2), two Chl a molecules (ChlA3 and ChlB3) in positions similar to two molecules of bacteriopheophytin in the RC of purple bacteria [4, 5], and two phylloquinone molecules (QA and QB).
Pairs of Chl a and phylloquinone molecules are located on two symmetric branches A and B and are bound with subunits PsaA and PsaB, respectively. The A branch includes molecules ChlA1, ChlA2, ChlA3, and phylloquinone QA, whereas the B branch includes ChlB1, ChlB2, ChlB3, and phylloquinone QB.
The electron transfer chain in PS I includes P700, A0 (one or both molecules of Chl monomer denoted as ChlA3/ChlB3), A1 (one or both molecules of phylloquinone QA/QB), and iron–sulfur clusters FX, FA, and FB. It remains unclear whether one or both symmetric branches of cofactors are involved in the electron transfer from P700 onto FX [6, 7].
The main difference between RC of PS I and bacterial RC is the impossibility of mechanically separating Chl molecules of the light-collecting antenna from Chl molecules of the RC without losing the nativity of the PS I pigment–protein complex. This is due to association of 90 molecules of Chl with just the same heterodimer of protein subunits PsaA/PsaB, which binds six Chl molecules of the initial region of the RC electron transfer chain. These 96 molecules of Chl cannot be clearly separated by their spectral features. According to work [8], the major part of the antenna Chl pool has absorption maximum at 670-680 nm, whereas only some Chl molecules (possibly dimers or trimers) are characterized by an absorption band at 690-710 nm. Although it is generally accepted that a special pair of Chl P700 molecules has absorption maximum at 700-705 nm and the maximum of the chlorophyll acceptor A0 is at 685-690 nm [9, 10], their spectra are partially overlapped with the spectra of several molecules of the antenna chlorophyll in the same region of the spectrum.
During recent years excitation energy transfer in the antenna and the electron transfer in RC of PS I were studied by different approaches, in particular, using a sub-picosecond pulse spectroscopy (for review, see [11]). However, primary reactions of electron transfer cannot be distinctly separated from reactions of the excitation energy transfer in the antenna because these reactions occur within the same time limits. To separate the electron transfer and the excitation energy transfer and to clearly detect kinetics of the primary stages of electron transfer and spectra of the corresponding intermediates, various approaches have been used.
Kumazaki et al. [12] extracted the major part of the antenna Chl and on the resulting damaged complex recorded two kinetic components with characteristic times of 0.8 and 9 ps, which were assigned to the primary separation of charges. Note that a decrease in the total Chl content to 12-14 molecules is very likely to significantly change both the structure and function of PS I complex.
There are two main models describing the charge separation in PS I. According to the first model, upon absorption of a light quantum the primary electron donor P700 can transit into the excited state P700*, and then the primary separation of charges between P700* and the primary acceptor A0 occurs, resulting in production of the ion-radical pair P700+A0– in <10 ps. Then within ~50 ps the electron is transferred onto phylloquinone A1, and then in ~200 ns it is transferred onto the iron–sulfur cluster FX (for review, see [13]).
Shuvalov et al. [14] demonstrated that selective excitation of PS I by picosecond laser pulses with maximum at 710 nm results in production of the state P700+A0–, which is characterized by two bleaching bands – at 700 nm (P700) and at 689 nm (A0–).
Another approach based on subtracting the transient spectrum of the oxidized (closed) RC from the spectrum of the reduced (open) RC was used in work [15]. This approach allowed the authors to remove spectral changes caused by transfer of the excitation energy in the antenna and to reveal spectral features reflecting the electron transfer in the RC. The energy transfer kinetics in the antenna was shown to be independent of the redox state of P700 [11]. Hastings et al. [9] used this approach for PS I particles from cyanobacteria and observed two kinetic phases with lifetimes of 4 and 21 ps. These components were assigned to generation and disappearance of the ion-radical pair P700+A0–. Those authors used a nonselective excitation at 590 nm, and therefore the phase with lifetime of 4 ps included not only oxidation of P700, but also the energy transfer in the antenna. Thus, this represented the upper limit in kinetics of the primary radical pair production. Moreover, to obtain a good signal/noise ratio, Hastings et al. used laser flashes with rather high energy that induced excitation annihilation and shortened the total time of reaching the state of one-exciton excitation in the antenna.
Savikhin et al. [16] used a similar approach and obtained 10 ps as the time of formation of P700+A0–. They excited PS I with 100-fs flashes with 660-nm maximum. Later, using a simple model of electron transfer and approximating the kinetics by two free parameters, Savikhin et al. [16] obtained the characteristic time of 1.3 ps for production of P700+A0– and of 13 ps for the subsequent reaction A0→A1. Similar results were obtained earlier by White et al. [17] for PS I complex from spinach.
Melkozernov et al. [18] investigated fast spectral changes in PS I from the cyanobacterium Synechocystis sp. PCC 6803 using 150-fs laser flashes with maxima at 560, 693, and 710 nm. They concluded that the change in the absorption at 700 nm was caused by the primary separation of charges and occurred in about 20 ps. They believed that the P700*A0→ P700+A0– should be the rate-limiting reaction, whereas the quasi-equilibrium in the antenna should be established in about 3 ps. But other authors consider that the excitation energy transfer in the antenna is the limiting step [10, 19, 20].
Muller et al. [20] proposed an alternative model of the primary charge separation. They investigated PS I complex from Chlamydomonas reinhardtii and, based on modeling the kinetics and analysis of the differential absorption spectra, supposed that the primary charge separation should occur in 6-9 ps. They also supposed that not P700+A0– should be the primary radical pair but P700+ChlA2 or ChlA2+ChlA3, where ChlA2 and ChlA3 are, respectively, the distal and proximal molecules of a Chl monomer in the RC relative to P700. In the works of Holzwarth et al. [20, 21], three kinetic components were revealed with characteristic times of 6, 20, and 40 ps. They proposed a scheme of the primary charge separation according to which the fastest component should correspond to formation of the primary radical pair ChlA2+ChlA3, and the two slower components should correspond to the radical pairs P700+ChlA3 and P700+A1–, respectively.
Summarizing the data from the literature, we conclude that some fundamental questions remain unclear, in particular, the nature of primary donor and acceptor of electrons and kinetics of formation of the first, second, and, possibly, the third radical pairs. Moreover, the question about the nature of the rate-limiting step on light absorption in PS I also remains unclear.
In the majority of studies on the fast kinetics of spectral changes in PS I, flashes with duration >100 fs were used, as well as powerful flashes resulting in two quanta arriving into the same RC and annihilation of the exciton-induced excitation and distortion of the spectral change kinetics. In our recent work, we for the first time used a complex approach including short (~20 fs) flashes with relatively low power (20 nJ) centered at 720 nm with bandwidth of 40 nm (fwhm). This allowed to obtain a predominant excitation of the primary electron donor – the chlorophyll dimer P700 [22]. Under these conditions about half of the chlorophyll RC molecules (i.e. molecules of P700 and A0) were excited directly, whereas the other half received excitation energy from the nearest molecules of the antenna chlorophyll. These conditions were chosen to maximally increase the relative contribution of the direct excitation of the RC to separate the kinetics of primary stages of the charge separation in the RC from the kinetics of the excitation energy transfer in the antenna. Based on these findings, it was possible to reveal the differential spectra of intermediates (P700A0)*, P700+A0–, and P700+A1–, and describe the kinetics of transitions between these intermediates. These results can be described by the following scheme.
In the present work, time-resolved spectra in the range 400-740 nm were studied that were obtained on the excitation of PS I by femtosecond pulses with maxima at different wavelengths (670, 700, and 720 nm). The work was designed to test the hypothesis that contradictions in the literature on the kinetics and differential spectra of PS I studied by the femtosecond pump–probe method were mainly caused by differences in the duration and spectra of the exciting pulses. The different experimental conditions resulted in different interpretation of data on the initial states of PS I excitation caused by superposition of the excitation of the antenna, P700 and A0. With a significant contribution of the excitation on the antenna it is difficult to detect the kinetics of the initial steps of the electron transfer between the redox cofactors P700, A0, and A1 on the background of energy transfer from the antenna to the primary electron donor.
Charge separation in PS I on excitation by a 25-fs pulse centered at 720 nm. Initially the ratio of the population of excited states in the nearest antenna (An*) and in the RC (P700A0)* is 50 : 50. The scheme is described in more detail in the text. It is based on results of femtosecond measurements performed in our previous work [22]
MATERIALS AND METHODS
Isolation of photosystem I complex. A culture of the cyanobacterium Synechocystis sp. PCC 6803 was used in the experiments. The cells were grown in the presence of 1% CO2 on BG-11 medium. The cell concentration was determined by measurement of optical density at 730 nm; the cultures were harvested at optical density (OD730) of 1.1-1.4.
To prepare PS I complex, the twice-washed cells resuspended in medium containing 50 mM Tris-HCl (pH 8.1) were broken by threefold passage through a French press (124 MPa). Proteases were inhibited with 1 mM phenylmethylsulfonyl fluoride, 1 mM ε-amino-n-caproic acid, and DNase (50 µg/ml); they were introduced into the medium immediately before the French press treatment. The homogenate was centrifuged in polycarbonate tubes in an angular rotor at 10,000g for 10 min to remove unbroken cells.
The thylakoid membranes were precipitated by centrifugation at 50,000g for 60 min. The precipitate was resuspended in 50 mM Tris-HCl buffer (pH 8.1). The thylakoid membranes were solubilized for 1 h at 4ºC in the presence of 1% n-dodecyl-β-D-maltoside at the chlorophyll concentration of 0.5 mg/ml. To separate the unbroken particles, the suspension was centrifuged at 10,000g for 10 min.
The supernatant was placed onto a sucrose density gradient (5-20%) in 50 mM Tris-HCl buffer (pH 8.1) supplemented with 0.03% dodecyl maltoside and centrifuged at 140,000g in a swinging-bucket rotor for 16-18 h. To prepare PS I trimers, the lower (dark green) fraction was collected, dialyzed, and again placed onto a sucrose density gradient. The lower fraction was resuspended in 50 mM Tris-HCl buffer (pH 8.1) supplemented with 15% glycerol and 0.03% dodecyl maltoside at 2 mg/ml chlorophyll concentration and stored at 80°C.
Femtosecond laser photolysis. Time-resolved differential absorption spectra ΔA(λ,t) were measured using femtosecond pump–probe photolysis. The experimental setup has been described in [22, 23]. The 25-fs excitation pulses with energy of 20 nJ and the maxima at 680, 700, or 720 nm were focused into a spot of 300-µm diameter. A white continuum pulse focused in a spot with 100-µm diameter was used as the probing pulse. Polarizations of the pumping and probing pulses were oriented at the magic angle of 54.7° relative to each other.
The zero-delay time between the pumping pulse and the corresponding spectral component λ of the probing pulse was corrected as described in [23]. The coherent artifact signal from the buffer–detergent-containing solution was subtracted from the signal of a studied PS I sample as described in [24]. Differential absorption spectra ΔA(λ,t) = A(λ,t) A0(λ) obtained by the femtosecond laser pump–probe photolysis are the differences between spectra of a PS I solution A(λ,t) at delay time t and the absorption spectrum of the PS I solution without excitation A0(λ).
A flow cuvette with 0.5-mm thickness was used in the experiments. The incubation medium contained 50 mM Tris-HCl buffer (pH 8.0), 0.03% dodecyl maltoside, 10 mM sodium ascorbate, and 5 µM 2,6-dichlorophenolindophenol; the chlorophyll concentration was 0.4 mg/ml. The experiments were performed at 7°C.
RESULTS AND DISCUSSION
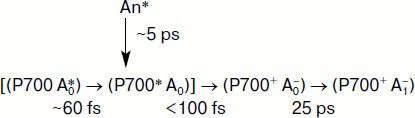
Figure 1 presents differential spectra ΔA(λ,t) of PS I obtained on excitation by a 25-fs pulse with the maximum (λmax) at 720 nm. The excitation pulse width at the half-height is about 40 nm, so chlorophyll molecules in PS I are mainly excited at λ > 685 nm. In the ΔA(λ,t) spectra within the range of 400 < λ < 720 nm, the following features can be emphasized:
– components of the positive signal ΔA > 0 caused by transitions of electron-excited chlorophyll molecules into higher states and/or by formation of chlorophyll ion-radicals;
– components of the negative signal ΔA < 0 caused by bleaching: a decrease in the population of the main state and components of the negative signal caused by luminescence induced by the probe pulse;
– components caused by the effect of the Kerr shift of absorption bands of pigments in the electric field of the ion-radical products.
In the spectra presented in Fig. 1 at different time delays relative to the excitation pulse, two main bands with negative peaks are observed: bleaching in the region of the Soret band (ΔA at 400 nm < λ < 450 nm) and bleaching in the Qy region of the PS I chlorophyll band (ΔA at 675 nm < λ < 740 nm). In the long wavelength region of this band at early delay times the induced luminescence can contribute to the total signal ΔA < 0.Fig. 1. Differential absorption spectra of PS I complex from the cyanobacterium Synechocystis sp. PCC 6803 obtained on excitation by a laser pulse with maximum at 720 nm. The pulse duration was 25 fs, energy 20 nJ, and half-width 40 nm. Here and in Figs. 3 and 4, delay times are 150 fs (a), 2 ps (b), 8 ps (c), 30 ps (d), and 100 ps (e).
We analyzed earlier the spectra ΔA(λ,t) on excitation with λmax = 720 nm [22]. In the present work, we analyzed these spectra in detail. The spectra at early delay times (Fig. 1, a-c) are mainly spectra of the primary radical pair P700+A0–, whereas the spectrum in Fig. 1d contains a mixture of the P700+A0– and P700+A1– states.
The spectrum in Fig. 1e (delay time 100 ps) belongs to the ion-radical pair P700+A1–. This spectrum in the Qy region of the band is characterized by bleaching peaks at 705 and 685 nm and an absorption peak at 693 nm. The isosbestic point (ΔA = 0) is observed at 574 nm. Moreover, the short wavelength region of the spectrum is characterized by an absorption peak at 453 nm and a decrease at 460 nm. In the Qy region, the bleaching peak at 705 nm is caused by depletion of P700 due to formation of P700+A1–.
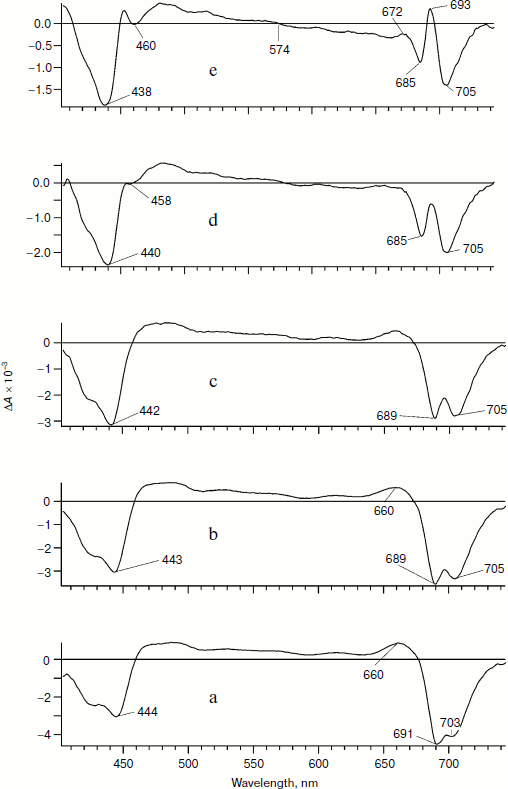
As an additional argument in favor of assigning the bleaching band at 705 nm to formation of P700+, we measured an “equilibrium” differential absorption spectrum of PS I (the spectrum with reduced P700 minus the spectrum with chemically oxidized P700). The spectrum of oxidized PS I was recorded in the presence of 1 mM ferricyanide oxidizing P700 to P700+. Figure 2 presents a superposition of fragments of the equilibrium differential spectrum of PS I and a fragment of the laser flash-induced differential spectrum of PS I at delay time 100 ps. The bleaching bands observed in the equilibrium differential spectrum of PS I and the bleaching bands obtained using femtosecond laser photolysis coincide rather well. This finding is additional confirmation of the earlier conclusion that the bleaching band at 705 nm belongs to P700+. The bleaching peak at 685 nm and the absorption peak at 693 nm (Fig. 1e, delay time 100 ps) is caused by Kerr shift of the A0 band in the electric field of the P700+A1– pair and, possibly, by a shift of bands of pigment molecules located nearby.
In Fig. 1a, at 150-fs delay time, a bleaching peak is also observed with maximum at 703-705 nm, which suggests formation of P700+ and a fast separation of charges with formation of the P700+A0– pair with characteristic time <150 fs. The evolution of the spectra presented in Fig. 1 can be described based on the hypothesis of a fast (<100 fs) separation of charges with formation of P700+A0–. The bleaching band at 691 nm in Fig. 1a reflects the depletion of A0 population due to generation of A0–. The pigments P700 and A0 are excited with probability of about 50%, as well as pigments of the antenna An. Thus, the charge separation can occur as shown in the scheme.Fig. 2. Comparison of the differential absorption spectra at delay time 100 ps on excitation by a 25-fs pulse with maximum at 720 nm (solid line, left axis) and the equilibrium differential absorption spectrum of PS I (in absence and presence of 1 mM potassium ferricyanide; dotted line, right axis). The spectra are normalized by the bleaching amplitude at 705 nm.
Figures 3 and 4 show evolution of the PS I differential spectra on excitation by 25-fs pulses with λmax of 700 and 670 nm, respectively. Qualitatively, these spectra are like those presented in Fig. 1. However, a detailed comparison reveals significant quantitative differences. At early times (delay time 150 fs; Figs. 3a and 4a) the ratio of the bleaching peaks in the Qy-band at ~690 and 705 nm is significantly higher than on excitation by the pulse with λmax of 720 nm. Moreover, the bleaching peak at 691 nm assigned to A0– in Fig. 1a is shifted to 687 nm in Fig. 3a and to 685 nm in Fig. 4a. The bleaching peak at 705 nm in Figs. 3a and 4a caused by formation of P700+ is hardly noticeable on the background of much more intense maxima at 685-687 nm. A pronounced bleaching peak at 705 nm appears only at the delay time of 8 ps (Figs. 3c and 4c). Significant differences at the delay times of 2-30 ps between the spectra obtained on excitation with λmax = 720 nm (Fig. 1, b-d) and the spectra on excitation with λmax of 700 and 670 nm appear also in the 650-680-nm range (Figs. 3 (b-d) and 4 (b-d)).
Fig. 3. Differential absorption spectra of PS I obtained on excitation by a pulse with maximum at 700 nm. Other conditions are the same as in Fig. 1.
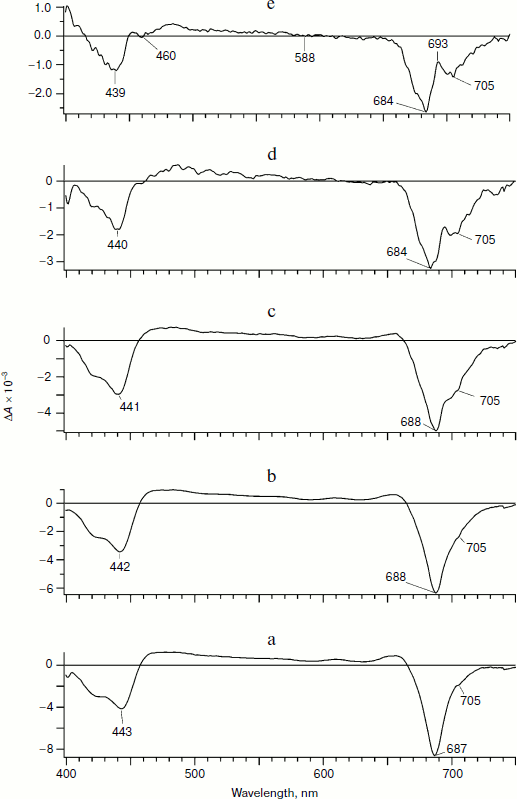
At the 100-ps delay time, by the moment of virtually completed production of the ion-radical pair P700+A1–, the spectra in Figs. 3e and 4e are noticeably different from the spectrum presented in Fig. 1e. Thus, the ratio of the bleaching peak amplitude at 705 nm to the peak amplitude at 687 nm for the excitation with λmax = 700 nm (Fig. 3e) is 0.53, for the excitation with λmax = 670 nm (Fig. 4e) it is 0.38, whereas for the excitation with λmax = 720 nm this ratio is 1.59 (Fig. 1e). A significant shoulder from the bleaching band of 685 nm explains the positive sign of the peak at 693 nm in Fig. 1e (ΔA > 0), whereas in Figs. 3e and 4e it is not positive – ΔA < 0.Fig. 4. Differential absorption spectra of PS I obtained on excitation by a 25-fs pulse with maximum at 670 nm. Other conditions are the same as in Fig. 1.
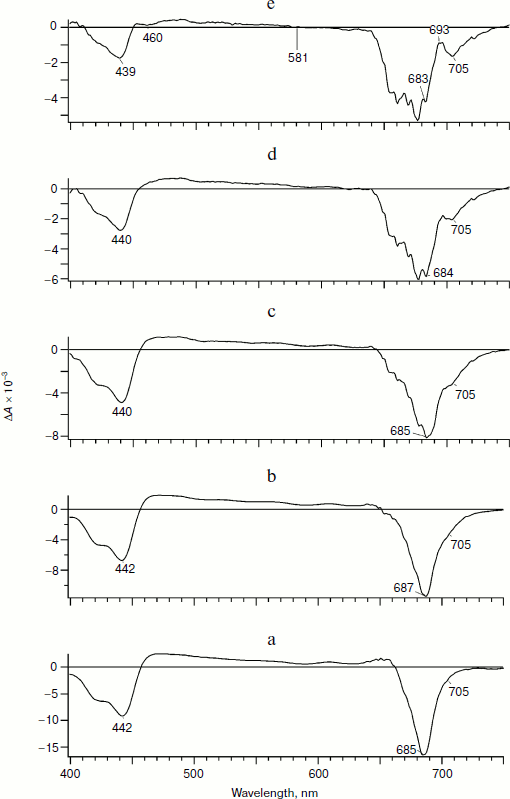
These differences can be explained on the suggestion that on excitation of PS I by pulses with λmax = 670 and 700 nm the fraction of excited states of the antenna should be considerably higher than on the excitation with λmax = 720 nm. In this case, the bleaching at 685-687 nm is significantly contributed by a signal from the antenna. The presence of a small shoulder at 705 nm observed at the early delay times using the pumping pulse with λmax of 670 and 700 nm suggests that in the fraction of RC, the chlorophyll molecules of P700 and A0 (P700A0)* are initially excited. In this fraction of the RC within time >150 fs the primary radical pair P700+A0– is produced similarly to the case of excitation with λmax = 720 nm.
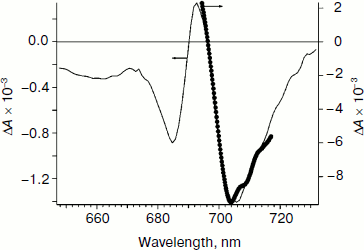
This hypothesis is confirmed by kinetic curves presented in Fig. 5. Figure 5a shows that kinetic curves measured at 705 nm decay by 100 ps to approximately the same level corresponding to the P700 bleaching on the formation of P700+. This finding indicates that on excitation with maxima at the wavelengths used (670, 700, and 720 nm) the amount of oxidized chlorophyll P700 dimer produced is the same. Moreover, an approximately twofold decrease in the ΔA amplitude at late delays compared to the initial level indicates similar contributions of the direct excitation of pigments of the RC and antenna to the change in absorption at 705 nm.
However, Fig. 5b shows that the kinetic curves at 685 nm after excitation with different λmax are significantly different in shape and amplitude. On excitation with λmax = 720 nm, the amplitude of ΔA is decreased four- or five-fold compared to λmax = 670 nm. The difference in the amplitudes of ΔA at early delay times suggests different numbers of excited molecules of the antenna chlorophyll at different maxima of the excitation pulse. Moreover, on excitation by light pulses with λmax = 670 and 700 nm (curves 1 and 2), as differentiated from λmax = 720 nm (curve 3) at the delay time of 100 ps the amplitude falls only to the level of about 20% of the maximal value. This result indicates that within 100 ps the equilibration of the excitation (redistribution of the excitation between the antenna pigments) has not occurred for all PS I complexes, but rather in about 80% of them. It was supposed earlier that the slow component of the relaxation of ΔA not decreasing at the delay time of 100 ps could be due to the fraction of the antenna chlorophyll molecules not related to energy transfer to the reaction center [25, 26] or due to electrochromic shift of chlorophyll caused by the charge of semiquinone anion of phylloquinone in the A1 site [27].Fig. 5. Kinetic curves of differential absorption ΔA(λ,t) obtained after 25-fs excitation with maxima at wavelengths of 670 (1), 700 (2), and 720 nm (3). a) ΔA(λ = 705 nm, t); b) ΔA(λ = 685 nm, t).
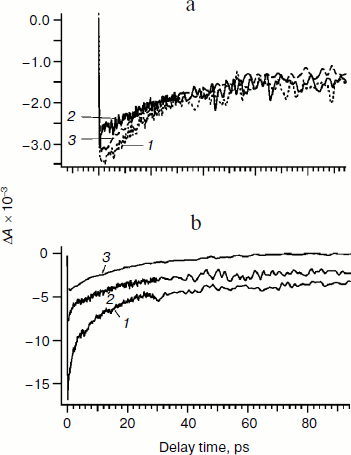
Thus, differences between the kinetic curves observed after excitation with pulses of different spectral maxima are explained by differences in the initial excited states and in pathways of the energy transfer in the antenna.
Finally, we conclude that the approach proposed by us earlier to study primary steps of electron transfer in the reaction center of PS I [22] made it possible to reveal more completely the kinetics of generation of the primary P700+A0 and the secondary P700+A1 ion-radical pairs. The essence of this approach is the use for initiating of the charge separation of a short (<25 fs) laser pulse with absorption maximum shifted to the long wavelength edge of the Qy-band of the chlorophyll absorption (with λmax = 720 nm). The findings presented in this paper provide possible reasons for the discrepancies in data on kinetics of primary steps of electron transfer obtained in different laboratories.
This work is dedicated to the memory of the outstanding biophysicist Efim Arsentievich Liberman, who died in 2011. Photosynthesis was within the wide interests of E. A. Liberman [28]. One of the authors of the present work (A.Yu.S.) had the opportunity to participate with E. A. Liberman in the 1970s in the development of a direct electrometric method for measuring electric activity of membrane proteins [29]. It is difficult to overestimate his role in explanation of experimental data resulting from this method, which is still now widely used. The non-standard image of E. A. Liberman and his role in formation of the modern biophysics will remain in the memory of those who knew him.
This work was supported by the grants from the Russian Ministry of Education and Science (state contract 02.512.12.2010) and from the Russian Foundation for Basic Research (project Nos. 11-04-91330, 11-04-92503, and 12-04-00821).
REFERENCES
1.Golbeck, J. H., and Bryant, D. A. (1991) in
Current Topics in Bioenergetics (Lee, C. P., ed.) Academic
Press, New York, Vol. 16, pp. 83-177.
2.Jordan, P., Fromme, P., Witt, H. T., Klukas, O.,
Saenger, W., and Krauss, N. (2001) Nature, 411,
909-917.
3.Karapetyan, N. V., Holzwarth, A. R., and Rogner, M.
(1999) FEBS Lett., 460, 395-400.
4.Deisenhofer, J., Epp, O., Miki, K., Huber, R., and
Michel, H. (1985) Nature, 318, 618-624.
5.Komiya, H., Yeates, T. O., Rees, D. C., Allen, J.
P., and Feher, G. (1988) Proc. Natl. Acad. Sci. USA, 85,
9012-9016.
6.Guergova-Kuras, M., Boudreaux, B., Joliot, A.,
Joliot, P., and Reding, K. (2001) Proc. Natl. Acad. Sci. USA,
98, 4437-4442.
7.Xu, W., Chitnis, P., Valieva, A., van der Est, A.,
Brettel, K., Guergova-Kuras, M., Pushkar, J., Zech, S. G., Stehlik, D.,
Shen, G., Zybailov, B., and Golbeck, J. H. (2003) J. Biol.
Chem., 278, 27876-27887.
8.Karapetyan, N. V., Schlodder, E., van Grondelle,
R., and Dekker, P. (2006) in Photosystem I. The Light-Driven
Plastocyanin: Ferredoxin Oxidoreductase (Golbeck, J., ed.)
Springer, Dordrecht, pp. 177-192.
9.Hastings, G., Kleinherenbrink, F. A. M., Lin, S.,
McHugh, T. J., and Blankenship, R. E. (1994) Biochemistry,
33, 3193-3200.
10.Savikhin, S., Xu, W., Martinsson, P., Chitnis, P.
R., and Struve, W. S. (2001) Biochemistry, 40,
9282-9290.
11.Savikhin, S. (2006) in Photosystem I. The
Light-Driven Plastocyanin: Ferredoxin Oxidoreductase (Golbeck, J.,
ed.) Springer, Dordrecht, pp. 155-175.
12.Kumazaki, S., Ikegami, I., Furusawa, H., Yasuda,
S., and Yoshihara, K. (2001) J. Phys. Chem. B,
105, 1093-1099.
13.Brettel, K., and Leibl, W. (2001) Biochim.
Biophys. Acta, 1507, 100-114.
14.Shuvalov, V. A., Nuijs, A. M., van Gorkom, H. J.,
Smit, H. W. J., and Duysens, L. N. M. (1986) Biochim. Biophys.
Acta, 850, 319-323.
15.Nuijs, A. M., Shuvalov, V. A., van Gorkom, H. J.,
Plijter, J. J., and Duysens, L. N. M. (1986) Biochim. Biophys.
Acta, 850, 310-318.
16.Savikhin, S., Xu, W., Chitnis, P. R., and Struve,
W. S. (2000) Biophys. J., 79, 1573-1586.
17.White, N. T. H., Beddard, G. S., Thorne, J. R.
G., Tim, M., Feehan, T. M., Keyes, T. E., and Heathcote, P. (1996)
J. Phys. Chem., 100, 12086-12099.
18.Melkozernov, A. N., Lin, S., and Blankenship, R.
E. (2000) Biochemistry, 39, 1489-1498.
19.Gobets, B., and van Grondelle, R. (2001)
Biochim. Biophys. Acta, 1507, 80-99.
20.Muller, M. G., Niklas, J., Lubitz, W., and
Holzwarth, A. R. (2003) Biophys. J., 85,
3899-3922.
21.Holzwarth, A. R., Muller, M. G., Niklas, J., and
Lubitz, W. (2006) Biophys. J., 90, 552-565.
22.Shelaev, I. V., Gostev, F. E., Mamedov, M. D.,
Sarkisov, O. M., Nadtochenko, V. A., Shuvalov, V. A., and Semenov, A.
Y. (2010) Biochim. Biophys. Acta, 1797, 1410-1420.
23.Ushakov, E. N., Nadtochenko, V. A., Gromov, S.
P., Vedernikov, A. I., Lobova, N. A., Alfimov, M. V., Gostev, F. E.,
Petrukhin, A. N., and Sarkisov, O. M. (2004) Chem. Phys.,
298, 251-261.
24.Dobryakov, A. L., Perez Lustres, J. L.,
Kovalenko, S. A., and Ernsting, N. P. (2008) Chem. Phys.,
347, 127-138.
25.Gibasiewich, K., Ramesh, V. M., Melkozernov, A.
N., Lin, S., Woodbury, N. W., Blankenship, R. E., and Webber, A. N.
(2001) J. Chem., 105, 11498-11506.
26.Gibasiewich, K., Ramesh, V. M., Lin, S., Redding,
K., Woodbury, N. W., and Webber, A. N. (2003) Biophys. J.,
85, 2547-2559.
27.Dashdorj, N., Xu, W., Martinsson, P., Chitnis, P.
R., and Savikhin, S. (2004) Biophys. J., 86,
3121-3130.
28.Liberman, E. A., and Tsofina, L. M. (1969)
Biofizika, 14, 1017-1022.
29.Drachev, L. A., Jasaitis, A. A., Kaulen, A. D.,
Kondrashin, A. A., Liberman, E. A., Nemecek, I. B., Ostroumov, S. A.,
Semenov, A. Y., and Skulachev, V. P. (1974) Nature, 249,
321-324.