Kinetic Mechanism of the Interaction of Saccharomyces cerevisiae AP-endonuclease 1 with DNA Substrates
E. S. Dyakonova1,2, V. V. Koval1,2, A. A. Ishchenko3, M. K. Saparbaev3, R. Kaptein2,4, and O. S. Fedorova1,2*
1Institute of Chemical Biology and Fundamental Medicine, Siberian Branch of the Russian Academy of Sciences, Lavrentyev Ave. 8, 630090 Novosibirsk, Russia; fax: (383) 363-5153; E-mail: fedorova@niboch.nsc.ru2Novosibirsk State University, Pirogov St. 2, 630090 Novosibirsk, Russia
3Groupe “Reparation de l’ADN” Univ. Paris-Sud XI, UMR 8200 C.N.R.S. Institut Gustave Roussy Villejuif Cedex F-94805, France; fax: 33 (1) 42115008; E-mail: murat.saparbaev@igr.fr
4Bijvoet Center for Biomolecular Research, Utrecht University, Padualaan 8, The Netherlands; fax: 31 (0) 30-2537623; E-mail: r.kaptein@uu.nl
* To whom correspondence should be addressed.
Received March 26, 2012; Revision received May 23, 2012
The apurinic/apyrimidinic endonuclease from Saccharomyces cerevisiae Apn1 is one of the key enzymes involved in base excision repair of DNA lesions. A major function of the enzyme is to cleave the upstream phosphodiester bond of an apurinic/apyrimidinic site (AP-site), leading to the formation of a single-strand break with 3′-hydroxyl (OH) and 5′-deoxyribose phosphate (dRP) termini. In this study, the pre-steady-state kinetics and conformational dynamics of DNA substrates during their interaction with Apn1 were investigated. A stopped-flow method with detection of the fluorescence intensity of 2-aminopurine and pyrrolocytosine located adjacent or opposite to the damage was used. It was found that upon interaction with Apn1, both DNA strands undergo a number of rapid changes. The location of fluorescent analogs of heterocyclic bases in DNA does not influence the catalytic step of the reaction. Comparison of data obtained for yeast Apn1 and reported data (Kanazhevskaya, L. Yu., Koval, V. V., Vorobjev, Yu. N., and Fedorova, O. S. (2012) Biochemistry, 51, 1306-1321) for human Ape1 revealed some differences in their interaction with DNA substrates.
KEY WORDS: Apn1, base excision repair (BER), stopped-flow method, 2-aminopurine, pyrrolocytosineDOI: 10.1134/S0006297912100082
Abbreviations: Ape1, human apurinic/apyrimidinic endonuclease; Apn1, apurinic/apyrimidinic endonuclease from Saccharomyces cerevisiae; AP-site, abasic site; 2-aPu, 2-aminopurine; BER, base excision repair; F, synthetic analog of AP-site ((3-hydroxytetrahydrofuran-2-yl)methyl phosphate); PyrC, pyrrolocytosine (3-[β-D-2-ribofuranosyl]-6-methylpyrrolo[2,3-d]pyrimidin-2(3H)-one).
Cellular DNA continually undergoes oxidative attack by reactive oxygen
species. The attack leads to formation of AP-sites and single-strand
breaks generating 3′-phosphate and 3′-phosphoglycolate
ends. These are dangerous and mutagenic DNA lesions as they block DNA
synthesis by DNA polymerase [1-3]. In mammalian cells, about 10,000 heterocyclic
bases are known to be removed from DNA per day [4].
Non-coding AP-sites and modified 3′-ends of DNA are genotoxic,
and therefore their repair is essential for genome stability [5]. The base excision repair (BER) pathway is known to
repair the majority of DNA damages [1, 6, 7]. Saccharomyces
cerevisiae apurinic/apyrimidinic (AP) endonuclease 1 (Apn1) is one
of the key enzymes involved in BER. The APN1 gene is located at
chromosome XI followed by the RAD27 gene, the translational
product of which is also involved in BER. Apn1 is a 41.4-kDa monomeric
protein consisting of 367 amino acids. This enzyme possesses several
catalytic activities: 1) AP-endonuclease activity providing DNA
cleavage at the 5′-side of an ordinary or reduced AP-site; 2)
3′-phosphodiesterase activity aimed at cleavage of
3′-blocking groups such as α,β-unsaturated aldehydes,
4-hydroxy-2-pentenal (3′-dRP), 3′-phosphoglycolate
(3′-pg), and 3′-phosphate (3′-P); 3)
3′-tyrosyl-DNA-phosphodiesterase activity leading to removal of
covalently bound topoisomerase 1 (3′-Topo1); 4) endonuclease
activity that provides phosphodiester bond hydrolysis from the
5′-side of oxidized DNA bases, 5,6-dihydrouracil, and
formamidopyrimidines (FapyA and FapyG); 5) 3′ to 5′
exonuclease activity removing 3′-nucleotides [5, 8].
Saccharomyces cerevisiae AP-endonuclease 1 is a nuclear protein possessing a bipartite nuclear localization signal (NLS) at the C-terminus, whose deletion results in cytoplasmic localization. It was shown that Apn1 is localized in the mitochondrion. Close interaction between Apn1 and Pir1 (a protein reported as a component of the cell wall) is required for mitochondrion localization [5, 8]. Pir1 binds to the C-terminus of Apn1 and is probably competing with the nuclear transport machinery. Apn1 protects nuclear and mitochondrial DNA against dangerous endogenous and exogenous DNA damage and is therefore an essential enzyme in yeast cells.
Human Ape1, which is similar to Apn1, belongs to class II AP-endonucleases. Their function is to cleave the phosphodiester bond upstream to the AP-site of damaged DNA. Hereupon the 3′-phosphodiesterase substrate is formed; 3′-phosphodiesterase is a subsequent enzyme in the BER pathway. To date, kinetic and dynamic data on human Ape1 catalysis have been reported, whereas there are no similar data about yeast Apn1 catalysis [9-11]. In addition, there are no reported data about the three-dimensional structure of Apn1. Apn1 is known to be a structural homolog and functional analog of E. coli Endo IV [12, 13].
The goals of the present study were to investigate the kinetic characteristics of the interaction of S. cerevisiae Apn1 with DNA substrates and to compare these data with those reported on enzymatic catalysis of human Ape1 [9]. For studying pre-steady-state kinetics of the interaction between Apn1 and DNA substrates, the stopped-flow method with fluorescence intensity detection was used. This method permits conformational changes of molecules of both biopolymers to be registered during the reaction. Conformational transitions of proteins can be detected by Trp fluorescence intensity changes, whereas it is necessary that fluorescent analogs of heterocyclic bases are incorporated into DNA to observe conformational changes of the substrates [14, 15]. In this study, 2-aminopurine (2-aPu) and pyrrolocytosine (PyrC) residues were used (Fig. 1) [16-21].
Fig. 1. 2-Aminopurine (a) and pyrrolocytosine (b) residues.
MATERIALS AND METHODS
Saccharomyces cerevisiae Apn1 expression and purification. Apn1 was expressed in Origami B (DE3) pLysS E. coli cells (Novagen, USA) from a pET11α plasmid containing an insertion of the APN1 gene. To purify Apn1, the cells were grown in 140 ml of LB with 5 g/liter NaCl and 50 μg/ml ampicillin at 37ºC until A595 = 0.6-1.0. Then the cell culture was diluted with a 10-fold volume of LB with 5 g/liter NaCl. When the absorbance of the culture was 0.6-0.8, induction was stimulated with addition of isopropyl-1-thio-β-D-galactopyranoside (IPTG). The induction was continued for 4 h at 37ºC and overnight at 30ºC. The cells were harvested by centrifugation and resuspended in 30 ml of buffer containing 10 mM Tris-HCl (pH 8.0), 1 mM EDTA, and 1 mM phenylmethylsulfonyl fluoride, and then incubated with lysozyme (0.5 mg/ml) for 30 min at room temperature. Then NaCl was added to a final concentration of 0.4 M. Lysis was completed by sonication (22 kHz) of the suspension on ice (10 pulses of 30 sec) in TE buffer (10 mM Tris, pH 8.0, 1 mM EDTA) using a Sonopuls HD 3100 ultrasound generator (Bandelin, Germany). The lysate was clarified by centrifugation (16,000g, 15 min, 4ºC) and diluted with 10-fold excess of water. The resulting solution was loaded on a 5-ml HiTrap Q HP column (GE Healthcare, UK) that was equilibrated in buffer containing 5% glycerol and 20 mM HEPES-KOH (pH 7.6) (buffer O) and 40 mM NaCl. The flow-through solution was collected, and the NaCl concentration was adjusted to 100 mM. This solution was loaded on a HiTrap Heparin HP column (GE Healthcare) equilibrated in buffer O containing 100 mM NaCl. Proteins were eluted by a gradient of 100-600 mM KCl in buffer O, and the Apn1-containing fraction was collected via absorbance at 280 nm. It was applied to a HiTrap Ni2+-chelating column (GE Healthcare) equilibrated in buffer O with 500 mM KCl. Here the flow-through Apn1 fraction was collected and concentrated by membrane dialysis against dialysis buffer containing 50 mM HEPES, pH 7.6, 100 mM KCl, 50% glycerol at 4°C. The purity of Apn1 was monitored by SDS-polyacrylamide gel electrophoresis (PAGE) with Coomassie Blue staining. The concentration of Apn1 was determined on a UV-2100 spectrophotometer (Shimadzu, Japan). The optical absorbance spectrum of Apn1 was recorded in dialysis buffer with respect to a buffer containing 20 mM HEPES, pH 7.6, 5% glycerol, 500 mM KCl. The molar extinction coefficient of Apn1 at 280 nm is 3.9·104 M–1·cm–1, as reported in the ExPASy server [22].
Oligodeoxyribonucleotides. Oligodeoxyribonucleotides (ODNs) were synthesized on an ASM-700 synthesizer (Biosset Ltd., Russia) using phosphoramidites purchased from Glen Research (USA). The ODNs were purified by anion-exchange high-performance liquid chromatography (HPLC) on a Nucleosil 100-10 N(CH3)2 (4.6 × 250 mm) column and further by reversed-phase HPLC on a Nucleosil 100-10 C18 (4.6 × 250 mm) column (both columns from Macherey-Nagel, Germany). Purity of the ODNs was tested by 20% denaturing PAGE with Stains-All (Sigma-Aldrich, USA) staining. The concentrations of the ODNs were determined from their absorbance at 260 nm [23]. In Table 1, the oligodeoxynucleotide duplexes used as Apn1 substrates are shown. The ODNs containing an AP-site were obtained by incubation of deoxyuridine-containing ODN (dU) (0.1 mmol) with 30 U of the uracil-DNA glycosylase in 150 μl of buffer (20 mM Tris-HCl, pH 8.0, 1 mM EDTA, 1 mM dithiothreitol (DTT), and 0.1 mg/ml bovine serum albumin (BSA)) for 16 h at 37ºC according to [24]. To isolate reaction product containing an AP-site, reversed-phase HPLC on an Eclipse XDB-C18 column (4.6 × 150 mm) (Agilent, USA) was used. It was carried out in 0.1 M triethylammonium acetate buffer (pH 7.0) and a linear gradient of acetonitrile from 0 up to 20%. The product was concentrated and converted into a lithium salt using a Sep-Pak Plus C18 cartridge (Waters, USA). To ensure that the extracted ODN is the AP-site-containing oligonucleotide and has no impurity of dU, the product was incubated with 10% aqueous piperidine at 95ºC for 20 min. Purity of the product was determined by 20% denaturing PAGE. 32P-labeled ODNs were obtained by the reaction of bacteriophage T4 polynucleotide kinase (SibEnzyme, Russia) (as described in the manufacturer’s protocol) with [γ-32P]ATP and unlabeled ODN. Labeled ODNs were purified by 20% denaturing PAGE.
Table 1. Sequences of oligonucleotide
duplexes used as substrates for Apn1
* Modified nucleotides X and Y are shown in the last two columns. Arrows
indicate the site of Apn1 cleavage. AP, abasic site; F, tetrahydrofuran
derivative; 2-aPu, 2-aminopurine; PyrC, pyrrolocytosine.
Stopped-flow measurements. Stopped-flow fluorescence measurements were carried out as described in [25] using an SX.18MV stopped-flow spectrometer (Applied Photophysics, UK). To detect intrinsic Trp fluorescence (Schott filter WG320, Germany), λex was 280 nm and observations were carried out at λem > 320 nm since λmax of the fluorescence excitation spectrum of Apn1 was 280 nm and λmax of the fluorescence emission of Apn1 was 350 nm. The fluorescence of 2-aPu was recorded at λex = 310 nm and λem > 370 nm (LG-370-F filter; Corion, USA). The wavelength of PyrC fluorescence excitation was 340 nm and its fluorescence was also recorded at λem > 370 nm (LG-370-F filter). All measurements were conducted at 25ºC in reaction buffer (BER buffer) containing 100 mM HEPES-KOH (pH 7.6) and 100 mM KCl. For the fluorescence measurements of 2-aPu and PyrC incorporated into DNA, the substrate concentration was 1.5 μM and the protein concentration was varied from 0.5 to 3.0 μM. Each kinetic trace is an average of five independent experiments. The cell volume is 20 μl, and the optical path is 2 mm. Dead time of the apparatus is 1.38 msec.
Global nonlinear simulation fitting of stopped-flow data. Kinetic traces were analyzed by global nonlinear least-squares fitting using the DynaFit software (BioKinLtd., USA) [26]. The approach is based on spreading of time slot and consequential meshing of mechanism [25]. Initial regions of the kinetic traces permit optimizing the rate constants of enzyme–substrate complex formation during the AP-endonuclease reaction. By adding subsequent regions of the traces, additional steps of the kinetic scheme were included, and values of rate constants were optimized again. Thus, a minimal kinetic scheme describing the experimental data was fitted, and values of rate constants for every step of the process were calculated. These rate constant values are presented in Table 2. The fluorescence intensity was corrected to take into account an inner filter effect [25]. The fluorescence traces were consistent with expression (1) as described in [11, 25, 27]:
where Fc is the corrected fluorescence intensity at any reaction time t, Fb is the background fluorescence, and Fi is the fluorescence intensity of each bound form of Apn1; furthermore, Fi(t) = fi[Ei(t)], where fi is the coefficient of the specific fluorescence for each discernible Apn1 conformer, and [Ei(t)] is the concentration of the conformer at any given time t (i = 0 relates to the free protein or DNA and i > 0 to the enzyme–DNA complexes). It should be noted that the coefficients describe the part of the fluorescence that changes due to DNA binding.
Table 2. Rate constants for interactions of
Apn1 with AP(2-aPu), F(2-aPu), (2-aPu)AP, (2-aPu)F, and AP-PyrC
substrates

Fluorescence equilibrium titration of Apn1 with the endonuclease reaction product. The emission spectrum of Apn1 was recorded using an SFM 25 spectrofluorimeter (Kontron Instruments, Italy) in a thermostatically controlled cell with an optical path of 1 cm at 25ºC. The maximum was at 350 nm, and therefore λex = 280 nm and λem = 350 nm were used in the fluorescence equilibrium titration of Apn1. A so-called product solution was prepared consisting of a mixture of three oligonucleotides (ODNs); sequences of products are presented in Table 1. A solution of Apn1 (1.5 μM) in BER buffer was titrated with the product solution.
The total fluorescence intensity is described with expression (2) [25]:
where Fc is the corrected total fluorescence intensity, Fb is the background fluorescence, F0 is the fluorescence intensity of free Apn1, Flim is the fluorescence intensity of Apn1 in the enzyme–product complex, [E] and [EP] are equilibrium concentrations of Apn1 and the enzyme–product complex, respectively, and e0 is the total Apn1 concentration.
Information on the affinity of Apn1 to P1, P2, and P3 products could be extracted from the values of dissociation constants of the enzyme–product complexes. These values were estimated as described in [11].
Cleavage time course experiments. AP- or F-site containing ODNs were 5′-labeled with 32P and mixed with the unlabeled complementary strand. DNA substrate and Apn1 were mixed in ratio 1 : 1 in BER buffer at 25ºC. Reagent concentrations were 1.5 μM in a reaction mixture. The reaction was terminated at required time points by adding 10-fold molar excess of unlabeled substrate solution. Aliquots were then analyzed by 20% denaturing PAGE; the gels were imaged by autoradiography and quantified by scanning densitometry using the Gel-Pro Analyzer 4.0 software (Media Cybernetics, USA). The amount of cleavage was calculated as the ratio of peak areas of products to the sum of peak areas of both products for a given ODN. The error in the determination of the amount of cleavage did not exceed 20%.
RESULTS AND DISCUSSION
Trp fluorescence of Apn1. The Apn1 sequence is known to have three Trp residues: Trp52, Trp213, and Trp292 [22]; however, their location in the spatial structure is unknown. In the case of interaction with DNA substrates, negligible changes in Apn1 fluorescence intensity occurred, which indicates the absence of conformational changes in those regions of the Apn1 molecule where Trp residues are located. It is unclear whether features of the enzyme structure cause this fact or that the environment of the Trp residues in Apn1 does not change significantly during the interaction with substrate.
2-Aminopurine fluorescence of DNA substrates. To investigate the conformational dynamics of a DNA substrate in the enzyme–substrate complex during the catalytic cycle, fluorescent analogs of heterocyclic bases, 2-aPu and PyrC, were incorporated into DNA (Fig. 1).
2-Aminopurine is an adenine analog that does not significantly disturb B-DNA. It has a high fluorescence quantum yield [16] and is therefore often used to study DNA structural changes [28, 29]. It should be noted that the fluorescence of 2-aPu is quenched when it is stacking with other bases, and vice versa, if stacking is disturbed its fluorescence is increased [17].
In this study 12 base pair DNA duplexes containing a 2-aPu residue upstream or downstream to the AP-site or its synthetic analog (F) (see Table 1) were used. The function of Apn1 is to incise the phosphodiester bond upstream to the AP-site, with 3′-OH and 5′-phosphate ends being formed. Incorporation of 2-aPu in the substrate allows observing product formation during the interaction.
The 2-aPu fluorescence was registered at >370 nm with fluorescence excitation at 310 nm [18]. Using the stopped-flow method, experiments were carried out under single-turnover conditions. Time-dependent kinetic traces of Apn1 interaction with AP(2-aPu), F(2-aPu), (2-aPu)AP, and (2-aPu)F substrates containing an upstream or downstream 2-aPu residue to a damaged site (see Table 1) were recorded (Figs. 2 and 3). The protein concentration was varied, whereas the substrate concentration was held constant.
For substrates AP(2-aPu) and F(2-aPu) containing a downstream 2-aPu residue to the damaged site, the kinetic traces are presented in Fig. 2. From these data one can see that the 2-aPu fluorescence intensity decreases up to 0.2 sec (range I-II). This could result from location of the 2-aPu residue in an active site of the enzyme. One can conclude that enzyme–substrate complex formation takes place in this time interval. The catalytic step leading to product release appears to take place from 4 to 30 sec (range III), since the fluorescence intensity increases, or in other words, the environment of 2-aPu becomes hydrophilic. The kinetic traces remain unchanged up to 200 sec of the reaction, indicating that the enzymatic reaction is finished (range IV).
Fig. 2. 2-aPu fluorescence traces of DNA substrates AP(2-aPu) (a) and F(2-aPu) (b) upon interaction with Apn1 (µM): 1) 0.5; 2) 1.0; 3) 1.5; 4) 2.0; 5) 3.0; ([DNA substrate] = 1.5 μM).
From kinetic traces (Fig. 3) obtained for the Apn1 interaction with (2-aPu)AP and (2-aPu)F substrates containing a 2-aPu residue upstream to the damaged site, one can see a slight decrease in the fluorescence intensity up to 0.2 sec (range I-II). This change, like in the case of AP(2-aPu) and F(2-aPu), could be associated with substrate binding in the active site of the enzyme. Increase in the fluorescence intensity from 0.25 to 40 sec (Fig. 3a) and from 0.2 to 30 sec (Fig. 3b) (range III) indicates a release of reaction products from the enzyme–product complex. It should be noted that the plateau of the kinetic traces from 30 to 40 sec (range IV) indicates that the reaction is finished. Comparison of the data shown in Figs. 2 and 3 reveals that a change in the position of 2-aPu relative to the damaged site has no influence on the reaction kinetics. In addition, the kinetic traces presented in Figs. 2a and 2b revealed that substitution of the AP-site with its synthetic analog (F) has no influence on the rate of catalysis by Apn1. The results for substrates (2-aPu)AP and (2-aPu)F (Fig. 3, a and b) also confirm this conclusion.
Fig. 3. 2-aPu fluorescence traces of DNA substrates (2-aPu)AP (a) and (2-aPu)F (b) upon interaction with Apn1 (µM): 1) 0.5; 2) 1.0; 3) 1.5; 4) 2.0; 5) 3.0; ([DNA substrate] = 1.5 μM).
PyrC fluorescence of DNA substrate. To investigate the kinetics of conformational changes in the substrate molecule, the PyrC residue was incorporated in the complementary DNA strand opposite to the AP-site. Pyrrolocytosine is a structural analog of the natural heterocyclic base cytosine, and it can be bound by pseudo-Watson–Crick interactions with guanine [19].
The photophysical properties of PyrC significantly differ from properties of the natural base. For instance, maxima of the fluorescence excitation and emission spectra are about 350 and 450 nm, respectively, whereas the maximum of the fluorescence excitation of cytosine is 267 nm [16, 20, 21].
In our experiments, the PyrC fluorescence was excited at 340 nm and changes in fluorescence intensity were detected at >370 nm. Stopped-flow experiments were carried out under single-turnover conditions. Time-dependent traces for the AP-PyrC substrate were obtained with the Apn1 concentration being varied and the substrate concentration held constant (Fig. 4).
Fig. 4. PyrC fluorescence traces of DNA substrate AP-PyrC upon interaction with Apn1 (µM): 1) 0.5; 2) 1.0; 3) 1.5; 4) 2.0; 5) 3.0; ([DNA substrate] = 1.5 μM).
The shapes of the kinetic traces presented in Fig. 4 indicate that the PyrC fluorescence intensity increases in the hydrophobic surroundings of the active site of the enzyme corresponding to a stage of the enzyme–substrate complex formation, which is observed up to 0.3 sec (range I-II). Next, a decrease in the fluorescence intensity at >8 sec appears to correspond to product formation and release in hydrophilic surroundings (range III). It should be noted that time intervals of PyrC fluorescence intensity changes during the interaction with Apn1 are the same for data obtained by 2-aPu fluorescence intensity detection.
Kinetic mechanism of the reaction and kinetic parameters describing this process. The stopped-flow data were fitted to a minimal kinetic scheme describing the interaction between Apn1 and AP(2-aPu), F(2-aPu), (2-aPu)AP, (2-aPu)F, and AP-PyrC substrates. This scheme (Scheme 1) was found to be the same for all substrates. The kinetic parameters were optimized, and the rate constants of the elementary reaction steps are presented in Table 2.
Scheme 1
Here E, S, and P are free enzyme, substrate, and product, respectively; ES and ES′ are different forms of the enzyme–substrate complexes; EP is the enzyme–product complex.
The data reveal that Apn1 binds the AP-PyrC substrate containing PyrC opposite to a lesion by an order of magnitude smaller than substrates containing 2-aPu near the lesion in the same strand, although the efficiency of DNA cleavage is almost the same.
The value of the association constant (KaS) reveals a high stability of the enzyme–substrate complex and high enzyme affinity to the substrate.
Comparison of kinetic parameters of yeast Apn1 and human Ape1 enzyme reactions. From the values of catalytic rate constants (kcat) obtained for all DNA substrates, we conclude that the location of 2-aPu relative to the damaged site has no influence on substrate cleavage by Apn1, since kcat values for substrates containing upstream and downstream 2-aPu to the damage are almost equal. This result differs from data obtained earlier for human Ape1 [9]. The values of kcat were 10 times higher for substrates containing a 2-aPu residue downstream to the lesion rather than upstream. This difference in catalytic rate constants points out the important role of the 5′-region of DNA adjacent to the damaged site in providing the proper coordination of a substrate in the active site of Ape1 [9]. Comparing equilibrium association constant values, KaS, characterizing the affinity of the enzyme to a substrate, we observed that Apn1 has the highest affinity to the AP(2-aPu) substrate (7.2·106 M–1) like in the case of Ape1 (1.6·107 M–1) [9]. Molecular dynamics simulations of DNA substrate structures used here that were performed earlier [9] revealed that the 5′-2aPu residue near the damage significantly disturbs DNA structure and DNA helix bending (~20° as compared with 2-aPu-free substrates). This also underscores the importance of the DNA region upstream to the damage for specific substrate binding by both Apn1 and Ape1.
Fluorescent titration of Apn1 with reaction products. To estimate the dissociation constants (KdP) for product release in the endonuclease reaction (Scheme 2), we carried out fluorescent titrations of the enzyme with reaction products consisting of an equimolar mixture of three ODNs (see Fig. 5 and Table 1).
![]()
Scheme 2
Fig. 5. Apn1 fluorescence changes during titration with the products of the AP-endonuclease reaction. One strand of the products contains synthetic analog of AP-site (F). Designations: filled square, P1 product binding by Apn1; filled circle, P2 product binding by Apn1; filled triangle, P3 product binding by Apn1.
When the concentration of the AP-endonuclease reaction products increases, the protein fluorescence intensity decreases. When a certain concentration of the products is reached, the observed fluorescence remains unchanged. Values of KdP were estimated with nonlinear regression fitting, as described in [11]. It should be noted that inner filter effects make a significant contribution to the experimental error.
The data reveal that the highest affinity of Apn1 is for the P1 product that did not contain a 2-aPu residue (KdP ≈ 2 μM). The P2 product containing a 2-aPu residue upstream to the damage had twofold lower affinity to the enzyme (KdP ≈ 4 μM) as compared with P1. The affinity of the enzyme to P3 with downstream 2-aPu was found to be an order of magnitude lower (KdP > 30 μM).
Analysis of reaction product formation and its comparison with stopped-flow results. Finally, we investigated the enzymatic reaction using 32P-labeled substrates and sequential electrophoretic analysis of reaction products. Substrates AP, F, AP(2-aPu), F(2-aPu), (2-aPu)AP, and (2-aPu)F having a 5′-labeled damaged strand were mixed with Apn1 in BER buffer. The enzymatic reaction was stopped by addition of 10-fold excess of unlabeled substrate. These experiments were carried out under the same conditions as the stopped-flow measurements. Concentrations of DNA duplexes and of Apn1 were 1.5 μM. Autoradiograms of the gels are presented in Fig. 6. They reflect the dissociation of Apn1 reaction products with AP, F, AP(2-aPu), F(2-aPu), and (2-aPu)F substrates.
Fig. 6. Cleavage of 32P-labeled AP(2-aPu), F(2-aPu), (2-aPu)F, F, and AP substrates by Apn1. Analysis by 20% PAGE. Autoradiograms are shown (nt, nucleotide).
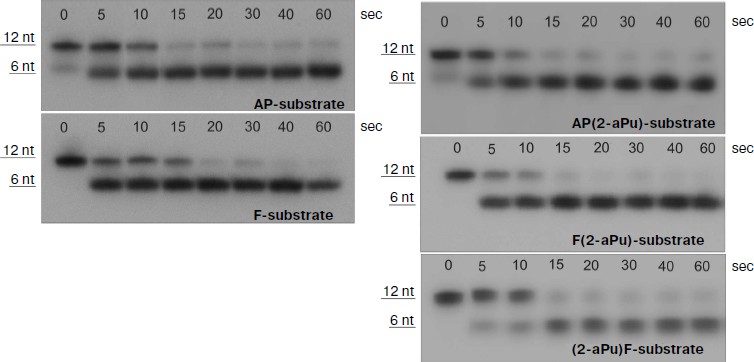
The results (Fig. 6) elucidated that the AP-endonuclease reaction of Apn1 with AP substrate proceeds for 20-30 sec to completion and the same time (about 20-30 sec) is required for Apn1 to cleave the F substrate (see Fig. 6). In addition, the reaction rate is not changed when a 2-aPu residue is incorporated in the DNA strand. Moreover, the position of 2-aPu relative to the lesion has no effect on the reaction time. These data are in agreement with the stopped-flow results.
Time-dependent curves of product accumulation for AP, F, AP(2-aPu), F(2-aPu), (2-aPu)AP, and (2-aPu)F substrates are presented in Fig. 7a. Every curve remains unchanged after 20 sec of the Apn1 reaction indicating the end of the enzymatic reaction. Analysis of the curves presented in Fig. 7b revealed that product accumulation up to 10 sec depends on substrate specificity.
Fig. 7. Time course of cleaved product accumulation in experiments with AP(2-aPu), F(2-aPu), (2-aPu)F, (2-aPu)AP, F, and AP substrates. ([DNA substrate] = [Apn1] = 1.5 μM).
From analysis of the presented data, we conclude that S. cerevisiae Apn1 cleaves AP-sites in DNA in a multistage process. Comparison of the fluorescence kinetic traces with the kinetics of incision product accumulation obtained by PAGE provides evidence for the nature of the individual reaction steps that correspond to changes in 2-aPu and PyrC fluorescence. Two-phase substrate binding is considered to take place up to 0.2 sec, when the 2-aPu fluorescence decreases and that of PyrC increases. The 5′-phosphodiester bond of the substrate is incised and reaction products are released in the time range from 0.2 to 10 sec. These individual steps of the reaction are accompanied with an increase in the fluorescence intensity of 2-aPu or a decrease in that of PyrC. Leveling off of the traces is taken to be the endpoint of the reaction.
Analysis of the fluorescence kinetic traces for 2-aPu and PyrC revealed that conformational changes in the DNA substrates take place during specific complex formation. When interacting with Apn1, both DNA strands are involved. The initial conformation of double-stranded nucleic acid is important for formation of the required enzyme–substrate complex.
The work was supported by grants from the Russian Foundation for Basic Research (RFBR 10-04-00070 and 12-03-93180), the Russian Ministry of Education and Science (NS-64.2012.4), the Grant of the Russian Government to support leading scientists (No. 11. G34.31.0045), Russian Federal Program “Scientific and education personnel for innovative Russia” for 2009-2013 (Nos. 8092 and 8473), Agence Nationale pour la Recherche [ANR Blanc 2010 Projet ANR-09-GENO-000 to M. S.], Centre National de la Recherche Scientifique [PICS N5479-Russie to M. S.], Electricité de France Contrat Radioprotection [RB2011 to M. S.], and Fondation de France [#2012 00029161 to A. A. I.].
REFERENCES
1.Mitra, S., Izumi, T., Boldogh, I., Bhakat, K. K.,
Hill, J. W., and Hazra, T. K. (2002) Free Radic. Biol. Med.,
33, 15-28.
2.Sukhanova, M. V., Khodyreva, S. N., Lebedeva, N.
A., Prasad, R., Wilson, S. H., and Lavrik, O. I. (2005) Nucleic
Acids Res., 33, 1222-1229.
3.Dianov, G. L., and Parsons, J. L. (2007)
DNA Repair, 6, 454-460.
4.Fritz, G., Grosch, S., Tomicic, M., and Kaina, B.
(2003) Toxicology, 193, 67-78.
5.Daley, J. M., Zakaria, C., and Ramotar, D. (2010)
Mut. Res., 705, 217-227.
6.David, S. (2005) Nature, 434,
569-570.
7.Kreklau, E. L., Limp-Foster, M., Liu, N., Xu, Y.,
Kelley, M. R., and Erickson, L. C. (2001) Nucleic Acids Res.,
29, 2558-2566.
8.Boiteux, S., and Guillet, M. (2004) DNA
Repair, 3, 1-12.
9.Kanazhevskaya, L. Yu., Koval, V. V., Vorobjev, Yu.
N., and Fedorova, O. S. (2012) Biochemistry, 51,
1306-1321.
10.Timofeyeva, N. A., Koval, V. V., Ishchenko, A.
A., Saparbaev, M. K., and Fedorova, O. S. (2011) Biochemistry
(Moscow), 76, 273-282.
11.Kanazhevskaya, L. Yu., Koval, V. V., Zharkov, D.
O., Strauss, P. R., and Fedorova, O. S. (2010) Biochemistry,
49, 6451-6461.
12.Hosfield, D. J., Guan, Y., Haas, B. J.,
Cunningham, R. P., and Tainer, J. A. (1999) Cell, 98,
397-408.
13.Ramotar, D., Popoff, S. C., Gralla, E. B., and
Demple, B. (1991) Mol. Cell. Biol., 11, 4537-4544.
14.Lakovic, J. (1986) Principles of Fluorescence
Spectroscopy [Russian translation], Mir, Moscow.
15.Dunlap, C. A., and Tsai, M. D. (2002)
Biochemistry, 41, 11226-11235.
16.Sinkeldam, R. W., Greco, N. J., and Tor, Y.
(2010) Chem. Rev., 110, 2579-2619.
17.Tamulaitis, G., Zaremba, M., Szczepanovski, R.
H., Bochtler, M., and Siksnys, V. (2007) Nucleic Acids Res.,
35, 4792-4799.
18.Rachofsky, E. L., Seibert, E.,
Stivers, J. T., Osman, R., and Ross, A. (2001)
Biochemistry, 40, 957-967.
19.Dash, C., Rausch, J. W., and Le Grice, S. F. J.
(2004) Nucleic Acids Res., 32, 1539-1547.
20.Thompson, K. C., and Miyake, N. (2005) J.
Phys. Chem. B., 109, 6012-6019.
21.Hardman, S. J. O., Botchway, S. W., and Thompson,
K. C. (2008) Photochem. Photobiol., 84, 1473-1479.
22.Gasteiger, E., Gattiker, A., Hoogland, C.,
Ivanyi, I., Appel, R. D., and Bairoch, A. ExPASy: the proteomics
server for in-depth protein knowledge and analysis.
23.Fasman, G. D. (1975) in Handbook of
Biochemistry and Molecular Biology – Nucleic Acids, Vol.
1, GRC Press, Cleveland.
24.Hoehn, S. T., Turner, C. J., and Stubbe, J.
(2001) Nucleic Acids Res., 29, 3413-3423.
25.Fedorova, O. S., Nevinsky, G. A., Koval, V. V.,
Ishchenko, A. A., Vasilenko, N. L., and Douglas, K. T. (2002)
Biochemistry, 41, 1520-1528.
26.Kuzmic, P. (1996) Anal. Biochem.,
237, 260-273.
27.Koval, V. V., Kuznetsov, N. A., Zharkov, D. O.,
Ishchenko, A. A., Douglas, K. T., Nevinsky, G. A., and Fedorova, O. S.
(2004) Nucleic Acids Res., 32, 926-935.
28.Biro, F. N., Zhai, J., Doucette, C. W., and
Hingorani, M. M. (2010) J. Vis. Exp., 37, pii: 1874,
doi: 10.3791/1874.
29.Zhai, J., and Hingorani, M. M. (2010) Proc.
Natl. Acad. Sci. USA, 107, 680-685.