SOX2 Overexpression Affects Neural Differentiation of Human Pluripotent NT2/D1 Cells
A. Klajn*, D. Drakulic, M. Tosic, Z. Pavkovic, M. Schwirtlich, and M. Stevanovic
Institute of Molecular Genetics and Genetic Engineering, University of Belgrade, Vojvode Stepe 444a, PO BOX 23, 11010 Belgrade, Serbia; fax: (+) 3811-1397-5808; E-mail: andrijanak@imgge.bg.ac.rs; danijeladrakulic@imgge.bg.ac.rs; milica.tos@gmail.com; pavkoviczeljko@hotmail.com; schwirtlich@imgge.bg.ac.rs; milenastevanovic@imgge.bg.ac.rs* To whom correspondence should be addressed.
Received April 29, 2014; Revision received July 7, 2014
SOX2 is one of the key transcription factors involved in maintenance of neural progenitor identity. However, its function during the process of neural differentiation, including phases of lineage-specification and terminal differentiation, is still poorly understood. Considering growing evidence indicating that SOX2 expression level must be tightly controlled for proper neural development, the aim of this research was to analyze the effects of constitutive SOX2 overexpression on outcome of retinoic acid-induced neural differentiation of pluripotent NT2/D1 cells. We demonstrated that in spite of constitutive SOX2 overexpression, NT2/D1 cells were able to reach final phases of neural differentiation yielding both neuronal and glial cells. However, SOX2 overexpression reduced the number of mature MAP2-positive neurons while no difference in the number of GFAP-positive astrocytes was detected. In-depth analysis at single-cell level showed that SOX2 downregulation was in correlation with both neuronal and glial phenotype acquisitions. Interestingly, while in mature neurons SOX2 was completely downregulated, astrocytes with low level of SOX2 expression were detected. Nevertheless, cells with high level of SOX2 expression were incapable of entering in either of two differentiation pathways, neurogenesis or gliogenesis. Accordingly, our results indicate that fine balance between undifferentiated state and neural differentiation depends on SOX2 expression level. Unlike neurons, astrocytes could maintain low level of SOX2 expression after they acquired glial fate. Further studies are needed to determine whether differences in the level of SOX2 expression in GFAP-positive astrocytes are in correlation with their self-renewal capacity, differentiation status, and/or their phenotypic characteristics.
KEY WORDS: SOX2 overexpression, NT2/D1, neurogenesis, gliogenesis, neural differentiationDOI: 10.1134/S0006297914110042
Abbreviations: RA, retinoic acid.
Neural development is governed by a cascade of stage-specific gene
activation events, occurring from stem cells to terminally
differentiated neuronal and glial cells, controlled at both the
transcriptional and the posttranscriptional level. SOX2 is one of the
key transcription factors involved in this process [1-5]. Together with OCT4 and
NANOG, this factor establishes the core transcriptional circuits that
control self-renewal and maintenance of pluripotency of the stem cells
[6]. Moreover, according to a recent report, SOX2
also plays an important role during germ layer fate decision [7]. Specifically, SOX2 protein level was shown to be
upregulated in the cells choosing the neuroectodermal fate and
repressed in those choosing the mesendodermal fate [7].
While the role of SOX2 in maintenance of stem cell identity has been confirmed in various studies [6, 8-10], its function during the process of neural differentiation, including phases of lineage-specification and terminal differentiation, is still poorly understood. Accumulating data suggest that SOX2 protein level must be tightly controlled for proper development of the nervous system [1-4, 11-14]. High SOX2 level was found to suppress neuronal differentiation, with no effects on gliogenesis [1, 4, 12]. On the other hand, suppression of SOX2 activity led to premature cell cycle exit and initiation of neuronal differentiation [1, 4]. In quantitative terms, heterozygous levels of SOX2 were sufficient for proper nervous system development [11, 13-15]. However, when neural progenitors failed to reach a certain threshold of SOX2 expression (20-30% of wild-type level), like in mice carrying hypomorphic mutations in Sox2, defects in progenitor proliferation, neuronal differentiation and maturation occurred [2, 3, 5, 14, 16]. Additional evidence supporting a dose-dependent role of SOX2 comes from immunocytochemical studies illustrating a gradient of SOX2 expression in mouse cortex. Particularly, it was reported that neocortical cells leaving the ventricular zone downregulate SOX2. These cells switch to SOX2-negative status as they acquire neural identity [12]. Moreover, characterization of neural progenitor cells in rodent dorsal telencephalon revealed quite variable intracellular concentrations of SOX2 among the cells [15]. Specifically, multipotent radial glial cells were characterized by higher SOX2 expression level respect to intermediate neural progenitor cells. When these distinct classes of neural progenitors were separated according to SOX2 protein levels and cultured in vitro, they generated neurospheres different in size, self-renewal capacity, and multipotency. In particular, the neurospheres originating from cells with high SOX2 expression exhibited high forming potential, growth rate, and capacity for self-renewal and generated both neurons and glia [15]. In contrast, neurospheres derived from cells with low SOX2 expression showed opposite properties and generated only neurons [15].
These data collectively suggest that delicate balance between stemness and neural differentiation as well as the ratios of neuronal and glial cell types might depend on SOX2 expression level. Accordingly, the focus of our work was to analyze whether constitutive SOX2 overexpression could interfere with the process of neural differentiation and its final outcome. To address this question, we studied retinoic acid (RA)-induced neural differentiation of human pluripotent embryonal carcinoma cell line Ntera2/cl.D1 (NT2/D1) and SOX2 overexpressing NT2/D1-derived cell clone.
NT2/D1 cells resemble early embryonic stem cells in morphology, antigen expression patterns, biochemistry, developmental potential, and gene regulation [17]. Furthermore, NT2/D1 cells have the ability to differentiate along the neural lineage during RA treatment [17] yielding both neuronal and glial populations [18]. The resemblance of NT2/D1 neural differentiation to vertebrate neurogenesis in utero has qualified these cells as an excellent in vitro model system for studying human genes that promote and regulate neural differentiation [17].
In the present study, we demonstrate that in spite of constitutive SOX2 overexpression, NT2/D1 cells are able to reach final phases of neural differentiation yielding both neuronal and glial cells. However, SOX2 overexpression reduced the number of mature neurons while no difference in the number of astrocytes was detected. Both neuronal and glial phenotype acquisitions were in correlation with SOX2 downregulation. On the other hand, cells that maintained high level of SOX2 expression were incapable of entering in either of two differentiation pathways, neurogenesis or gliogenesis.
MATERIALS AND METHODS
Cell culture. Human NT2/D1 cells (a kind gift from Prof. Peter W. Andrews, University of Sheffield, UK) and SOX2 overexpressing NT2/D1 cell clone were maintained in Dulbecco’s Modified Eagle’s medium (DMEM) supplemented with 10% fetal bovine serum (FBS), 4.5 g/liter glucose, 2 mM L-glutamine, and penicillin/streptomycin (all from Invitrogen, USA) at 37°C in 10% CO2 as previously described [17]. All-trans RA (Sigma-Aldrich, USA) at 10-µM concentration was used for differentiation of cells. The medium supplemented with fresh RA was changed every two days for four weeks, and the neurons were isolated in accordance with Pleasure et al. [19]. Briefly, following RA differentiation, cells were re-plated at 1 : 6. After two days, cultures were mechanically shaken to dislodge cells. These free-floating cells were plated on Matrigel™ (Becton Dickinson, USA)-coated growth surface and grown in media supplemented with mitotic inhibitors 1 µM cytosine arabinoside, 10 µM uridine, and 10 µM 5-fluoro-5-deoxyuridine (Sigma-Aldrich). The medium supplemented with fresh mitotic inhibitors was changed every two days for the next 10 days.
Western blotting. Total cell extracts were obtained by suspending cells in lysis buffer containing 1% Triton X-100, 50 mM Tris-HCl, pH 7.5, 250 mM NaCl, 5 mM EDTA, and protease inhibitor cocktail (Roche Diagnostics GmbH, Germany) [20]. Proteins were quantified by Bradford protein assay (Bio-Rad, USA). Appropriate amounts of protein (up to 20 µg) were separated by SDS-PAGE on 10 or 13% resolving gels and electrotransferred to Immobilon-P Transfer Membrane (Millipore, USA). After blocking with 5% nonfat milk at room temperature for 1 h, the membranes were incubated overnight at 4°C with the following primary antibodies: mouse monoclonal anti-SOX2 (R&D Systems, USA; diluted 1 : 2500), mouse monoclonal anti-β-III tubulin (Sigma-Aldrich; diluted 1 : 10,000), rabbit polyclonal anti-GFAP (Dako-Cytomation, Denmark; diluted 1 : 20,000). The membranes were incubated for 1 h at room temperature with the following primary antibodies: mouse monoclonal anti-SNAP25 (Sternberger Monoclonals Inc., USA; 1 : 1 liter) and mouse anti-GAPDH (Acris Antibodies, USA; diluted 1 : 80,000). Afterwards, the membranes were incubated for 1 h at room temperature with the following secondary antibodies: horseradish peroxidase-conjugated goat anti-mouse and anti-rabbit IgG (Amersham Biosciences, USA; diluted 1 : 10,000). Immunoreactive bands were detected by chemiluminescence (Immobilon substrate; Millipore, USA). Molecular weight markers used in experiments were BlueStar Prestained Protein Marker (Nippon Genetics Europe GmbH, Germany) and PageRuler Prestained Protein Ladder (Thermo Scientific, UK).
Immunofluorescence. Cells cultured on Matrigel™-coated coverslips were fixed with 4% paraformaldehyde for 20 min at room temperature, permeabilized in 0.1% Triton X-100, and blocked for 30 min at room temperature in PBS containing 0.1% Triton X-100 and 5% BSA. Afterwards, the cells were incubated overnight at 4°C with mouse anti-SOX2 (R&D Systems, USA; diluted 1 : 50) and mouse anti-MAP2 (Abcam, UK; diluted 1 : 500) or rabbit anti-GFAP (DakoCytomation, Z 0334; diluted 1 : 2000) in PBS containing 0.1% Triton X-100 and 5% BSA. The bound antibodies were stained for 1 h at room temperature with DyLight™ 488-conjugated goat anti-mouse IgG2a and DyLight™ 649-conjugated goat anti-mouse IgG1 secondary antibodies (BioLegend, UK) diluted 1 : 500 in PBS containing 0.1% Triton X-100 and 5% BSA. The anti-GFAP antibody was reacted first with biotinylated goat anti-rabbit IgG (Vector, USA) for 1 h at room temperature in 1% BSA, followed by Cy3-streptavidin (Jackson ImmunoResearch, USA; 1 : 5000) in PBS for 1 h at room temperature. Nuclei were stained with 4′,-diamino-2-phenylindole (DAPI; Sigma-Aldrich). Samples were viewed under an Olympus BX51 fluorescence microscope with appropriate filters and analyzed using Cytovision 3.1 software (Applied Imaging Corporation, USA) or visualized using a Leica TCS SP8 confocal microscope and Leica Microsystems LAS AF-TCS SP8 software (Leica Microsystems, Germany). The bright-fields of live cells were taken with phase contrast microscope IMT-2 (Olympus, Japan).
RESULTS
Characterization of SOX2 expression at single-cell level in undifferentiated NT2/D1 cells and G3 cell clone. In our earlier work, we extensively characterized G3, a SOX2 overexpressing NT2/D1-derived cell clone [21]. In the G3 cell clone, we showed that overall SOX2/SOX2 mRNA and protein levels were above the endogenous level and remained significantly elevated after RA treatment [21]. To proceed with further studies on this model system, our first goal was to determine whether there were variations in SOX2 expression between cells in this cell clone. Therefore, we analyzed SOX2 expression at single-cell level in both parental NT2/D1 cell line and G3 cell clone.
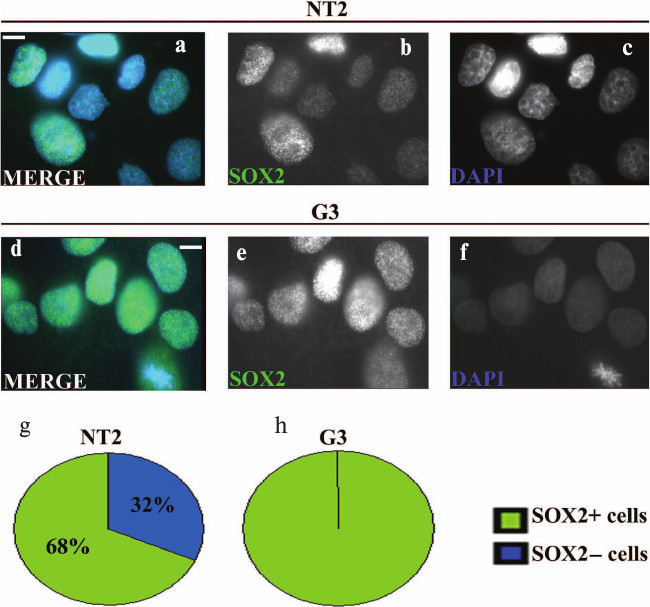
Immunocytochemical analysis of undifferentiated NT2/D1 and G3 cells showed punctuate nuclear localization of SOX2 (Fig. 1, a, b, d and e). In the population of about 100 examined nuclei of parental NT2/D1 cells, ~68% were SOX2-positive (Fig. 1g), while the rest of the nuclei exhibited no or very weak staining for this protein (Fig. 1, a and b). In contrast, all of the 100 examined cells of G3 cell clone were SOX2-positive (Fig. 1, d, e, and h) and the levels of SOX2 signals in G3 nuclei were higher compared to nuclei of the parental cells (compare Figs. 1b and 1e). However, although in G3 cells all examined nuclei were SOX2-positive, the level of SOX2 expression varied between cells (Fig. 1e).
Fig. 1. Immunocytochemical analysis of SOX2 expression in undifferentiated NT2/D1 cells and the G3 cell clone. Undifferentiated NT2/D1 (a-c) and G3 (d-f) cells stained with anti-SOX2 antibody (green), were analyzed by fluorescence microscopy. Specific SOX2 immunoreactivity/punctated nuclear signals were detected with different intensity in the majority of undifferentiated NT2/D1 cells (a and b) and in all undifferentiated G3 cells (d and e). Cell nuclei were counterstained with DAPI (blue) (a, c, d and f). Scale bars: 10 µm. Summary diagrams of statistical analysis of immunocytochemical results obtained for undifferentiated NT2/D1 and G3 cells are presented in (g) and (h), respectively. Percentages of SOX2 positive and negative cells represented in (g) and (h) were calculated against approximately 100 DAPI-labeled cells.
Overexpression of SOX2 did not compromise neuronal and glial differentiation of NT2/D1 cells triggered by RA. As we previously reported, despite significantly elevated expression of SOX2 after three weeks of RA treatment, a small fraction of G3 cells differentiated into cells morphologically resembling neurons [21]. To test whether G3 cell clone was able to reach final phases of neural differentiation yielding both neuronal and glial cells, we applied a differentiation protocol described by Pleasure et al. [19]. The same protocol was used for differentiation of parental NT2/D1 cell line that served as control.
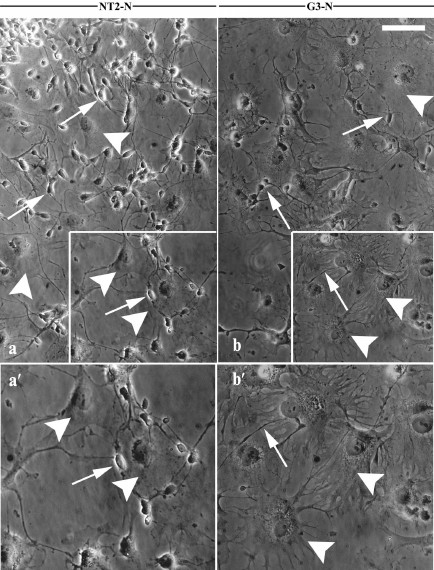
Purified NT2/D1 and G3 postmitotic cell cultures, NT2-N (Fig. 2, a and a′) and G3-N (Fig. 2, b and b′), respectively, consisted of two morphologically distinct cell populations: small, rounded bright-phase cells with extensive neuritic-like processes (arrows in Fig. 2) growing on the top of dark-phase, large flat cells (arrowheads in Fig. 2).
Fig. 2. Morphological properties of differentiated derivates of NT2/D1 and G3 cells. Phase contrast images showing morphology of purified terminally differentiated NT2/D1 derivates (NT2-N cell culture) (a) and G3 derivates (G3-N cell culture) (b). Boxed regions in (a) and (b) are enlarged in panels (a′) and (b′) , respectively. Two morphologically distinct cell populations were visible in the both mature cultures: small, rounded, bright-phase, neuron-like cells (arrows) and dark-phase, large flat glial-like cells (arrowheads). Scale bar, 100 µm.
Based on the morphological criteria, we assumed that SOX2 overexpressing cells were able to complete the process of neural differentiation yielding both neuron and glial-like cells. We proceeded with further characterization of the NT2-N and G3-N cultures.
Analysis of neural markers and SOX2 expression. To evaluate if the neuronal-like morphological properties observed in NT2-N and G3-N cell populations were in correlation with expression of neuronal markers, we analyzed expression of β-III-tubulin and synaptosomal-associated protein 25 (SNAP25). At the same time, to determine the presence of astroglial cells in populations of NT2-N and G3-N cells, we analyzed expression of glial-specific intermediate filament protein (GFAP), a hallmark of astrocytic differentiation [22].
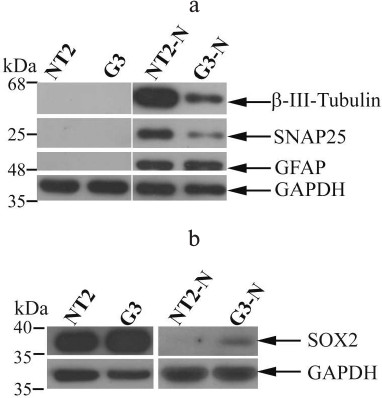
The Western blot analysis showed that differentiated NT2-N and G3-N cells acquired typical neuronal marker β-III-tubulin (Fig. 3a). Also, SNAP25, a neurosecretion marker [23], was expressed in both NT2-N and G3-N cells. Interestingly, whereas there was no difference in GFAP expression level between these two populations, both β-III-tubulin and SNAP25 were less abundant in G3-N when compared to NT2-N (Fig. 3a). These results indicated that constitutive SOX2 overexpression might interfere with neuronal differentiation. In parallel, we analyzed SOX2 expression (Fig. 3b). This protein was highly expressed in both undifferentiated NT2/D1 and G3 cells. However, the overall SOX2 level was higher in G3 cell clone compared to the parental cells, which was in accordance with our previously published data [21] and immunocytochemical results (Fig. 1). We detected downregulation of SOX2 expression in both mature NT2-N and G3-N cultures. This result is in agreement with other reports demonstrating that neuronal fate acquisition was accompanied with inactivation of SOX2 expression [1, 12]. Interestingly, while SOX2 expression was undetectable in differentiated NT2-N, a faint band corresponding to SOX2 protein remained present in G3-N (Fig. 3b).
Fig. 3. Neural markers and SOX2 expression. The images of representative Western blots of β-III-tubulin, SNAP25, and GFAP expression (a) and overall SOX2 expression (b) in undifferentiated NT2/D1 and G3 cells and their differentiated derivatives NT2-N and G3-N. Analyses were carried out on total cell lysates, and GAPDH was used as a control of equal protein loading. Molecular weight markers enabled the determination of protein size (indicated in kDa).
The appearance of neural markers and downregulation of SOX2 expression clearly demonstrated that both NT2/D1 and G3 cells successfully differentiated. To determine whether the lower levels of neuronal markers expression in G3-N culture were a consequence of reduced number of neurons present in this cell population compared to the parental cell line, we proceeded with further analysis at the single-cell level.
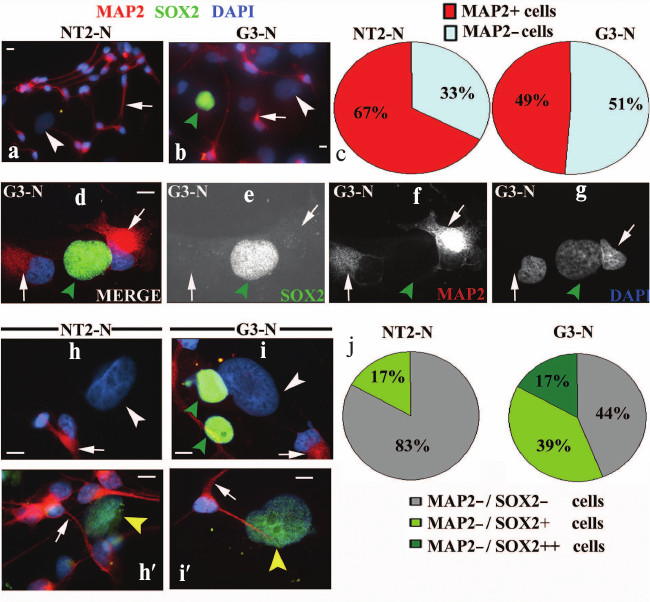
Constitutive SOX2 overexpression reduced the number of mature neurons. Differentiated NT2-N and G3-N cells were double stained with antibodies specific for SOX2 and microtubule-associated protein 2 (MAP2), a marker of postmitotic, terminally differentiated neurons [24, 25]. In both populations the cytoplasmic neural extensions were positively stained for MAP2 (arrows in Fig. 4, a, b, d, f and h-i′). Interestingly, we observed a larger number of MAP2-positive neurons in NT2-N (~67%) with respect to the G3-N cell population (~49%) (Fig. 4c). Accordingly, we concluded that SOX2 overexpression induced reduction in the number of terminally differentiated neurons. It is important to point out that all NT2- and G3-derived neurons, characterized by small nuclei with high-density chromatin, were immunonegative for SOX2 (Fig. 4, a, b, d, e and h-i′). Beneath MAP2-positive neurons, we detected also MAP2-negative cells with large nuclei (arrowheads in Fig. 4, a, b, d-g and h-i′) in both mature cultures. In-depth immunocytochemical analysis under higher magnification revealed different populations of non-neuronal cells (Fig. 4, h-i′). These cells were either completely SOX2-negative (MAP2–/SOX2–; white arrowheads in Fig. 4, h and i; see also Fig. 4, a and b) or displayed weak immunoreactivity for this protein (MAP2–/SOX2+; yellow arrowheads in Fig. 4, h′ and i′). Interestingly, MAP2-negative cells retaining a very strong staining for SOX2 (MAP2–/SOX2++; green arrowheads in Fig. 4i, see also Fig. 4, b and d-g) were detected in G3-N culture only. Consistent with size of their nuclei and intensity of SOX2 expression, these cells resembled the undifferentiated precursors (Fig. 1, d and e). In summary, the NT2-N culture consisted of mostly SOX2-negative cells including neurons and large MAP2-negative cells, where the majority (83%; Fig. 4j) displayed no immunoreactivity for SOX2. However, in G3-N culture, although all neurons were SOX2-negative, a significant percentage of non-neuronal cells displayed weak (39%; Fig. 4j) or strong (17%; Fig. 4j) SOX2 staining. These results are in accordance with overall SOX2 expression level detected by Western blot, where a weak band corresponding to SOX2 protein was visible in G3-N only (Fig. 3b).
Fig. 4. Characterization of NT2/D1 and G3 differentiated derivates by co-immunostaining of MAP2 and SOX2. Immunocytochemical analysis of MAP2 and SOX2 expressions in mature NT2-N (a, h and h′) and G3-N (b, d-g, i and i′) cultures. Cells were dually stained with antibodies against MAP2 (red) and SOX2 (green). Cell nuclei were stained with DAPI (blue) and analyzed by fluorescence microscopy. Images presented in panels (a, b, d, and h-i′) were obtained by merging the three individual channels. Punctuated MAP2 labeling was seen along neuritic processes emanating from the cytoplasm. MAP2-positive neurons were characterized by small nuclei with high-density chromatin that were immunonegative for SOX2 (arrows in panels a, b, d-g and h-i′). Cells with large nuclei negative for both markers (MAP2–/SOX2–) are indicated with white arrowheads in panels (a, b, h, and i). MAP2-negative cells displaying a weak immunoreactivity for SOX2 (MAP2–/SOX2+) are marked with yellow arrowheads in panels (h′ and i′). MAP2-negative cells displaying strong immunoreactivity for SOX2 (MAP2–/SOX2++) are indicated with green arrowheads in panels (b, d-g, and i). Scale bars, 10 µm. Summary diagrams of statistical analysis of immunocytochemical results obtained for NT2-N and G3-N cultures are presented in panels (c and j). Percentages of MAP2-positive and MAP2-negative cells presented in panel (c) were calculated against ~100 DAPI-labeled cells. Percentages of cells presented in panel (j) were calculated against ~100 DAPI-labeled MAP2-negative cells.
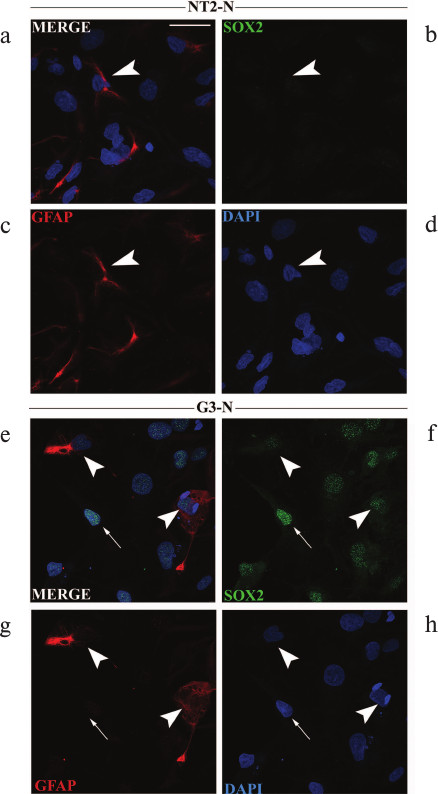
Analysis of GFAP expression at single-cell level in mature NT2-N and G3-N populations. Previously, it was reported that unlike neurons, astrocytes maintained SOX2 expression after they acquired glial fate [12]. Accordingly, we double-stained NT2-N and G3-N mature cultures with antibodies specific for SOX2 and GFAP. The GFAP antibody labeled intra-cytoplasmic filaments in a very small subset of astrocytes in both NT2-N and G3-N cultures (Fig. 5). In quantitative terms, we observed that less than 5% of cells that were present in both cultures had intense GFAP staining. Although we did not detect difference in the number of GFAP-positive cells between NT2-N and G3-N cell populations, we noticed that in NT2-N all GFAP-positive astrocytes were SOX2-negative (arrowhead in Fig. 5, a-d) while GFAP-positive cells in G3-N culture displayed weak immunoreactivity for SOX2 (arrowheads in Fig. 5, e-h). The majority of large flat cells in both populations did not express GFAP protein. In addition, cells with strong SOX2 staining, which were present only in the G3-N population, were also GFAP-negative (arrow in Fig. 5, e-h).
Fig. 5. Immunocytochemical analyses of GFAP and SOX2 expression in mature NT2-N and G3-N cultures. Immunocytochemical analysis of GFAP and SOX2 expressions in mature NT2-N (a-d) and G3-N (e-h) cultures. Cells were co-stained with antibodies against GFAP (red) and SOX2 (green). Cell nuclei were counterstained with DAPI (blue) and analyzed by confocal microscope. GFAP-positive cells are indicated with white arrowheads in panels (a-d) and (e-h). GFAP-negative cells displaying strong immunoreactivity for SOX2 are marked with white arrows in panels (e-h). Scale bars, 50 µm.
DISCUSSION
Our results demonstrated that G3 SOX2-overexpressing cells were able to terminally differentiate upon RA induction yielding a decreased number of postmitotic mature neurons compared to RA-induced NT2/D1 cells. Specifically, in the population of purified terminally differentiated cells we demonstrated that ~49% of G3-N cells successfully turned off SOX2 expression and differentiated into mature neurons, while ~67% of parental NT2-N cells were MAP2-positive neurons with complete downregulation of SOX2 expression (Fig. 4c). These results are in concordance with previously published data showing that inactivation of SOX2 expression is an essential step for neuronal progenitors to complete neurogenesis [1, 12]. The discrepancy between parental and SOX2 overexpressing cells in the percentage of resulting neurons could be explained by increased overall SOX2 expression in G3 cells compared to the parental cells. Although SOX2 was overexpressed in G3 cells and all examined nuclei were SOX2-positive, the level of SOX2 expression varied between cells (Fig. 1, d and e). We presume that only the minority of G3 cells with lower level of overall SOX2 succeeded in eliminating both endogenous and exogenous SOX2 protein and terminally differentiated into neurons. It was previously demonstrated that the cells engaged a mechanism based on serine protease activity to eliminate exogenous SOX2 protein [12]. In contrast to the results presented here, Bani-Yaghoub et al. did not observe neurons after infections of neural precursors with retroviral particles carrying a Sox2–EGFP expression construct [12]. We might postulate that overall SOX2 level, obtained by Bani-Yaghoub et al. after infection of neural precursors [12], was higher than in G3 cells, so the neural precursors were not able to efficiently eliminate SOX2 protein in order to terminally differentiate. In other words, SOX2 levels were too high to allow entry of stem and early precursor cells into the differentiation pathway, as postulated by Cavallaro et al. [2].
The large flat cells that coexist with NT2 neurons have been described in many reports on differentiated NT2 cultures [18, 19, 26-28], but there are discrepancies about their phenotypic identity. These cells have been described as postmitotic epithelioid cells that accompanied NT2 neurons [26]. In particular, the authors reported that these cells retained cytoskeletal proteins characteristic for the precursor stadium (vimentin and nestin) and displayed no immunoreactivity with MAP2 and GFAP. However, they differed from proliferating precursors in their large size and lack of cell division [26]. In other reports on differentiated NT2 cultures, the large flat cells were described as protoplasmic astrocytes [18, 28, 29]. According to Sandhu et al., intense GFAP staining was seen only in smaller star-like cells with irregular cell body and numerous fiber-like processes, but not in large flat protoplasmic cells with fewer short processes extending from an almost round cell body [28]. In line with this finding, we presume that we predominately obtained the large protoplasmic type of astrocytes in both mature NT2-N and G3-N cultures (arrowheads in Fig. 2) with no or very low content of GFAP. Probably a small number (fewer than 5%) of GFAP-positive cells detected in our study in the both cultures correspond to fibrous astrocytes. Although there was no difference in the number of GFAP-positive cells and in the overall level of GFAP protein expression between NT2-N and G3-N (Fig. 3a), we noticed that GFAP-positive cells in NT2-N cell population were immunonegative for SOX2 (Fig. 5, a-d), whereas a low level of SOX2 expression was maintained in GFAP-positive cells in G3-N population (Fig. 5, e-h). Bani-Yaghoub et al. reported a link between astroglial SOX2 expression and the cell cycle [12]. In particular, they showed that glial precursors and differentiated astrocytes maintained SOX2 expression until they became quiescent. Moreover, SOX2 expression was reactivated in quiescent astrocytes when they resumed proliferation after injury or after exposure to mitogenic and gliogenic factors [12]. Accordingly, we can assume that the difference in SOX2 expression between GFAP-positive cells in NT2-N and G3-N could correlate with their cell division ability. In other words, we speculate that GFAP+/SOX2+ cells detected in mature G3-N culture could still be proliferating astrocytes, whereas GFAP+/SOX2– cells present in NT2-N culture could be quiescent astrocytes. However, we cannot rule out a possibility that astrocytes present in G3-N population are at a different stage of differentiation compared to astrocytes detected in the NT2-N population. Also, we cannot exclude the possibility that different cell phenotypes would exist at the same stage of maturity as described among NT2 neurons [19, 26, 30, 31] and human fetal astrocytes [32].
Interestingly, cells displaying very strong staining for SOX2, present only in G3-N culture, were both MAP2 (green arrowheads in Fig. 4, b, d-g, and i) and GFAP (arrow in Fig. 5, e-h) immunonegative. Consistent with the size of their nuclei, these cells were smaller than large protoplasmic cells, but larger than MAP2-positive neurons (Fig. 4i). Accordingly, we presume that the small population of cells displaying very strong staining for SOX2 (MAP2–/SOX2++), detected only within G3-N culture were remaining precursor cells that due to high SOX2 overexpression were unable to enter in either of the two processes, neurogenesis or gliogenesis.
Taken all together, our results are in accordance with previous reports demonstrating complete downregulation of SOX2 expression in mature postmitotic neurons (Fig. 4, a, b, d-g and h-i′) [1, 12]. However, regarding gliogenesis, our results are to some extent different with respect to an earlier report. In particular, Bani-Yaghoub et al. reported that SOX2 overexpression permitted the differentiation of progenitors into astroglia [12]. In our case, only cells with low SOX2 expression (in G3-N culture) or complete SOX2 downregulation (in NT2-N culture) were GFAP-positive, while cells with high SOX2 expression were negative for the astroglial marker. In further studies, it would be interesting to determine whether the level of SOX2 expression interferes with self-renewal capacity of astroglial cells, their differentiation status, and/or their phenotypic characteristics. Understanding the molecular base of these fundamental processes is of a great importance considering that astrocytes provide mechanical, metabolic, and trophic support to neurons in the central nervous system. Moreover, astrocytes are involved in various neurological disorders, including neurodegenerative diseases (amyotrophic lateral sclerosis, Alzheimer’s disease) [33-36], neuronal injury in ischemia [37], or epilepsy [38-40], so better insight into their biology is crucial for elucidation of the mechanisms that underlie these pathologies.
In summary, our results demonstrated that constitutive SOX2 overexpression interfered with final outcome of RA-induced neural differentiation of NT2/D1 cells inducing reduced number of MAP2-positive neurons and a larger number of SOX2-positive non-neuronal cells. Our results also indicate that the delicate balance between undifferentiated state and RA-induced neural differentiation depends on SOX2 expression level.
We thank Prof. Peter W. Andrews (University of Sheffield, UK) for NT2/D1 cells, Prof. Jacopo Meldolesi (San Raffaele Scientific Institute, Milan, Italy) for kind gift of SNAP25 and GAPDH, and Dr. Zoja Katarova (Institute of Experimental Medicine, Hungarian Academy of Sciences, Budapest, Hungary) for GFAP and β-III-tubulin antibodies.
This work was supported by the Ministry of Education, Science, and Technological Development, Republic of Serbia (Grant No. 173051).
REFERENCES
1.Bylund, M., Andersson, E., Novitch, B. G., and
Muhr, J. (2003) Vertebrate neurogenesis is counteracted by Sox1-3
activity, Nat. Neurosci., 6, 1162-1168.
2.Cavallaro, M., Mariani, J., Lancini, C., Latorre,
E., Caccia, R., Gullo, F., Valotta, M., DeBiasi, S., Spinardi, L.,
Ronchi, A., Wanke, E., Brunelli, S., Favaro, R., Ottolenghi, S., and
Nicolis, S. K. (2008) Impaired generation of mature neurons by neural
stem cells from hypomorphic Sox2 mutants, Development,
135, 541-557.
3.Ferri, A. L., Cavallaro, M., Braida, D., Di
Cristofano, A., Canta, A., Vezzani, A., Ottolenghi, S., Pandolfi, P.
P., Sala, M., DeBiasi, S., and Nicolis, S. K. (2004) Sox2 deficiency
causes neurodegeneration and impaired neurogenesis in the adult mouse
brain, Development, 131, 3805-3819.
4.Graham, V., Khudyakov, J., Ellis, P., and Pevny, L.
(2003) SOX2 functions to maintain neural progenitor identity,
Neuron, 39, 749-765.
5.Miyagi, S., Masui, S., Niwa, H., Saito, T.,
Shimazaki, T., Okano, H., Nishimoto, M., Muramatsu, M., Iwama, A., and
Okuda, A. (2008) Consequence of the loss of Sox2 in the developing
brain of the mouse, FEBS Lett., 582, 2811-2815.
6.Rizzino, A. (2008) Transcription factors that
behave as master regulators during mammalian embryogenesis function as
molecular rheostats, Biochem. J., 411, e5-7.
7.Thomson, M., Liu, S. J., Zou, L. N., Smith, Z.,
Meissner, A., and Ramanathan, S. (2011) Pluripotency factors in
embryonic stem cells regulate differentiation into germ layers,
Cell, 145, 875-889.
8.Boyer, L. A., Lee, T. I., Cole, M. F., Johnstone,
S. E., Levine, S. S., Zucker, J. P., Guenther, M. G., Kumar, R. M.,
Murray, H. L., Jenner, R. G., Gifford, D. K., Melton, D. A., Jaenisch,
R., and Young, R. A. (2005) Core transcriptional regulatory circuitry
in human embryonic stem cells, Cell, 122, 947-956.
9.Macarthur, B. D., Ma’ayan, A., and Lemischka,
I. R. (2009) Systems biology of stem cell fate and cellular
reprogramming, Nat. Rev. Mol. Cell Biol., 10,
672-681.
10.Wegner, M., and Stolt, C. C. (2005) From stem
cells to neurons and glia: a Soxist’s view of neural development,
Trends Neurosci., 28, 583-588.
11.Avilion, A. A., Nicolis, S. K., Pevny, L. H.,
Perez, L., Vivian, N., and Lovell-Badge, R. (2003) Multipotent cell
lineages in early mouse development depend on SOX2 function, Genes
Dev., 17, 126-140.
12.Bani-Yaghoub, M., Tremblay, R. G., Lei, J. X.,
Zhang, D., Zurakowski, B., Sandhu, J. K., Smith, B.,
Ribecco-Lutkiewicz, M., Kennedy, J., Walker, P. R., and Sikorska, M.
(2006) Role of Sox2 in the development of the mouse neocortex, Dev.
Biol., 295, 52-66.
13.Ellis, P., Fagan, B. M., Magness, S. T., Hutton,
S., Taranova, O., Hayashi, S., McMahon, A., Rao, M., and Pevny, L.
(2004) SOX2, a persistent marker for multipotential neural stem cells
derived from embryonic stem cells, the embryo or the adult, Dev.
Neurosci., 26, 148-165.
14.Taranova, O. V., Magness, S. T., Fagan, B. M.,
Wu, Y., Surzenko, N., Hutton, S. R., and Pevny, L. H. (2006) SOX2 is a
dose-dependent regulator of retinal neural progenitor competence,
Genes Dev., 20, 1187-1202.
15.Hutton, S. R., and Pevny, L. H. (2011) SOX2
expression levels distinguish between neural progenitor populations of
the developing dorsal telencephalon, Dev. Biol., 352,
40-47.
16.Favaro, R., Valotta, M., Ferri, A. L., Latorre,
E., Mariani, J., Giachino, C., Lancini, C., Tosetti, V., Ottolenghi,
S., Taylor, V., and Nicolis, S. K. (2009) Hippocampal development and
neural stem cell maintenance require Sox2-dependent regulation of Shh,
Nat. Neurosci., 12, 1248-1256.
17.Andrews, P. W. (1984) Retinoic acid induces
neuronal differentiation of a cloned human embryonal carcinoma cell
line in vitro, Dev. Biol., 103, 285-293.
18.Coyle, D. E., Li, J., and Baccei, M. (2011)
Regional differentiation of retinoic acid-induced human pluripotent
embryonic carcinoma stem cell neurons, PLoS One, 6,
e16174.
19.Pleasure, S. J., Page, C., and Lee, V. M. (1992)
Pure, postmitotic, polarized human neurons derived from NTera 2 cells
provide a system for expressing exogenous proteins in terminally
differentiated neurons, J. Neurosci., 12, 1802-1815.
20.Xu, Y. X., Hirose, Y., Zhou, X. Z., Lu, K. P.,
and Manley, J. L. (2003) Pin1 modulates the structure and function of
human RNA polymerase II, Genes Dev., 17, 2765-2776.
21.Drakulic, D., Krstic, A., and Stevanovic, M.
(2012) Establishment and initial characterization of
SOX2-overexpressing NT2/D1 cell clones, Genet. Mol. Res.,
11, 1385-1400.
22.Rutka, J. T., Murakami, M., Dirks, P. B.,
Hubbard, S. L., Becker, L. E., Fukuyama, K., Jung, S., Tsugu, A., and
Matsuzawa, K. (1997) Role of glial filaments in cells and tumors of
glial origin: a review, J. Neurosurg., 87, 420-430.
23.Salaun, C., James, D. J., Greaves, J., and
Chamberlain, L. H. (2004) Plasma membrane targeting of exocytic SNARE
proteins, Biochim. Biophys. Acta, 1693, 81-89.
24.Herzog, W., and Weber, K. (1978) Microtubule
formation by pure brain tubulin in vitro. The influence of
dextran and poly(ethylene glycol), Eur. J. Biochem., 91,
249-254.
25.Maddodi, N., Bhat, K. M., Devi, S., Zhang, S. C.,
and Setaluri, V. (2010) Oncogenic BRAFV600E induces expression of
neuronal differentiation marker MAP2 in melanoma cells by promoter
demethylation and down-regulation of transcription repressor HES1,
J. Biol. Chem., 285, 242-254.
26.Podrygajlo, G., Tegenge, M. A., Gierse, A.,
Paquet-Durand, F., Tan, S., Bicker, G., and Stern, M. (2009) Cellular
phenotypes of human model neurons (NT2) after differentiation in
aggregate culture, Cell Tissue Res., 336, 439-452.
27.Popovic, J., Stanisavljevic, D., Schwirtlich, M.,
Klajn, A., Marjanovic, J., and Stevanovic, M. (2014) Expression
analysis of SOX14 during retinoic acid induced neural differentiation
of embryonal carcinoma cells and assessment of the effect of its
ectopic expression on SOXB members in HeLa cells, PLoS One,
9, e91852.
28.Sandhu, J. K., Sikorska, M., and Walker, P. R.
(2002) Characterization of astrocytes derived from human NTera-2/D1
embryonal carcinoma cells, J. Neurosci. Res., 68,
604-614.
29.Goodfellow, C. E., Graham, S. E., Dragunow, M.,
and Glass, M. (2011) Characterization of NTera2/D1 cells as a model
system for the investigation of cannabinoid function in human neurons
and astrocytes, J. Neurosci. Res., 89, 1685-1697.
30.Guillemain, I., Alonso, G., Patey, G., Privat,
A., and Chaudieu, I. (2000) Human NT2 neurons express a large variety
of neurotransmission phenotypes in vitro, J. Comp.
Neurol., 422, 380-395.
31.Hartley, R. S., Margulis, M., Fishman, P. S.,
Lee, V. M., and Tang, C. M. (1999) Functional synapses are formed
between human NTera2 (NT2N, hNT) neurons grown on astrocytes, J.
Comp. Neurol., 407, 1-10.
32.Gasque, P., Jones, J., Singhrao, S. K., and
Morgan, B. (1998) Identification of an astrocyte cell population from
human brain that expresses perforin, a cytotoxic protein implicated in
immune defense, J. Exp. Med., 187, 451-460.
33.Mulder, S. D., Nielsen, H. M., Blankenstein, M.
A., Eikelenboom, P., and Veerhuis, R. (2014) Apolipoproteins E and J
interfere with amyloid-beta uptake by primary human astrocytes and
microglia in vitro, Glia, 62, 493-503.
34.Trotti, D., Aoki, M., Pasinelli, P., Berger, U.
V., Danbolt, N. C., Brown, R. H., Jr., and Hediger, M. A. (2001)
Amyotrophic lateral sclerosis-linked glutamate transporter mutant has
impaired glutamate clearance capacity, J. Biol. Chem.,
276, 576-582.
35.Trotti, D., Danbolt, N. C., and Volterra, A.
(1998) Glutamate transporters are oxidant-vulnerable: a molecular link
between oxidative and excitotoxic neurodegeneration? Trends
Pharmacol. Sci., 19, 328-334.
36.Trotti, D., Rolfs, A., Danbolt, N. C., Brown, R.
H., Jr., and Hediger, M. A. (1999) SOD1 mutants linked to amyotrophic
lateral sclerosis selectively inactivate a glial glutamate transporter,
Nat. Neurosci., 2, 848.
37.Seki, Y., Feustel, P. J., Keller, R. W., Jr.,
Tranmer, B. I., and Kimelberg, H. K. (1999) Inhibition of
ischemia-induced glutamate release in rat striatum by dihydrokinate and
an anion channel blocker, Stroke, 30, 433-440.
38.Crunelli, V., Carmignoto, G., and Steinhauser, C.
(2014) Astrocytic targets provide new avenues for the therapeutic
treatment of epilepsy, Neuroscientist, March 21 [E-pub ahead of
print].
39.Rothstein, J. D., Dykes-Hoberg, M., Pardo, C. A.,
Bristol, L. A., Jin, L., Kuncl, R. W., Kanai, Y., Hediger, M. A., Wang,
Y., Schielke, J. P., and Welty, D. F. (1996) Knockout of glutamate
transporters reveals a major role for astroglial transport in
excitotoxicity and clearance of glutamate, Neuron, 16,
675-686.
40.Tanaka, K., Watase, K., Manabe, T., Yamada, K.,
Watanabe, M., Takahashi, K., Iwama, H., Nishikawa, T., Ichihara, N.,
Kikuchi, T., Okuyama, S., Kawashima, N., Hori, S., Takimoto, M., and
Wada, K. (1997) Epilepsy and exacerbation of brain injury in mice
lacking the glutamate transporter GLT-1, Science, 276,
1699-1702.