REVIEW: Mitochondrial ROS Metabolism: 10 Years Later
A. Y. Andreyev1*, Y. E. Kushnareva2, A. N. Murphy1, and A. A. Starkov3*
1Department of Pharmacology, University of California, San Diego, 9500 Gilman Drive, MC 0601, La Jolla, CA 92093-0601, USA; E-mail: alex_andreyev@mitoexperts.com2La Jolla Institute for Allergy and Immunology, 9420 Athena Circle, La Jolla, CA 92037, USA
3Brain and Mind Research Institute, Weill Medical College of Cornell University, 407 East 61st Street, 5th floor, New York, NY 10065, USA; E-mail: ans2024@med.cornell.edu
* To whom correspondence should be addressed.
Received February 1, 2015; Revision received February 8, 2015
The role of mitochondria in oxidative stress is well recognized, but many questions are still to be answered. This article is intended to update our comprehensive review in 2005 by highlighting the progress in understanding of mitochondrial reactive oxygen species (ROS) metabolism over the past 10 years. We review the recently identified or re-appraised sources of ROS generation in mitochondria, such as p66shc protein, succinate dehydrogenase, and recently discovered properties of the mitochondrial antioxidant system. We also reflect upon some controversies, disputes, and misconceptions that confound the field.
KEY WORDS: mitochondria, reactive oxygen species, p66shc, succinate dehydrogenase, dihydroorotate dehydrogenase, ROS scavenging, oxidative stressDOI: 10.1134/S0006297915050028
Abbreviations: DCF, dichlorofluorescin; DCF-DA, dichlorofluorescin diacetate; DHO, dihydroorotate; DHO DH, dihydroorotate dehydrogenase; DLD, dihydrolipoamide dehydrogenase; ETF, electron-transferring flavoprotein; F.e.T., forward electron transport; GPx1, glutathione peroxidase 1; GR, glutathione reductase; HRP, horseradish peroxidase; IDH, isocitrate dehydrogenase, NADP-dependent; IM, inner mitochondrial membrane; ME, NADP-dependent malic enzyme; MnSOD, manganese-containing superoxide dismutase (SOD2); Prx3, peroxiredoxins 3; Prx5, peroxiredoxins 5; R.e.T., reverse electron transport; ROS, reactive oxygen species; SOD, superoxide dismutase; TH, transhydrogenase; Trx2-ox, thioredoxin 2 oxidized; Trx2-red, thioredoxin 2 reduced; TrxR2, thioredoxin reductase 2; TTFA, thenoyltrifluoroacetone; ΔΨ, membrane potential.
Efficient metabolism of nutrients through oxidative phosphorylation
comes at a price. Billions years ago our remote ancestors let into
cells intruders, living beasts with their double membrane and own
genome, transcriptional and translational machinery, who are now known
as mitochondria (see [1] for a recent review of
endosymbiotic theory). And we are still puzzled – are they
friends or foes? Sometimes they are killers, albeit useful, acting with
surgical cleanliness through apoptosis [2-5]. They gave cells the ability to produce 36
molecules of ATP per molecule of glucose (instead of just two in
glycolysis), but they came with a full sack of dangerous tools. To
reach high efficiency, they managed to make nutrients release their
chemical energy piecemeal – one little step for an ATP
molecule, so to speak. Hence, there is a whole chain of redox carriers,
which transfer reducing equivalents (in other terms, electrons)
stepwise from the nutrients to oxygen. These redox carriers accept a
single electron before they transfer it further, which makes them, in
essence, free radicals, highly reactive as all free radicals. For all
iron–sulfur centers, semiquinone forms of coenzyme Q and flavins
the question is not “if” but “how fast” they
can participate in side-reactions giving potentially dangerous
products, i.e. how fast they react with molecular oxygen, converting it
into a superoxide radical. Thus, mitochondrial generation of reactive
oxygen species (ROS) is a necessary evil, an inevitable consequence
and, apparently, an inherent property of oxidative phosphorylation, the
price that we pay for our energy efficiency.
However, mitochondria keep the danger at bay, erecting the best defenses that evolution could create against the most deadly weaponry of nature. Being inherently dangerous ROS producers, they also possess a powerful antioxidant system that detoxifies their own ROS as well as those of exogenous origin. There is significant progress in our understanding of this system, but many questions remain.
This review is intended to highlight the progress in our understanding of mitochondrial ROS metabolism over the past 10 years. It is not all-inclusive; we will only review the novel sources of ROS generation in mitochondria and recently discovered properties of their antioxidant system that that were not known 10 years ago. For earlier research in this field, we refer the reader to our own review [6] and many excellent reviews by others (e.g. [7-14]) that cover about every aspect of ROS metabolism in mitochondria, as well as some novel tools to study it and to modify it. It should be understood that many aspects of ROS research are not adequately addressed due to lack of proper technology and/or over-interpretation of experimental data. We will attempt to reflect critically upon some controversies, disputes, and misconceptions that confound the field as related to the reviewed material.
MITOCHONDRIAL ROS PRODUCTION
The chemistry of mitochondrial ROS metabolism. Multiple reactions of ROS generation and removal combined in an intricate network [6, 15] are intertwined with the core catabolic pathways, which results in very complex responses to perturbations of the system. Nevertheless, from the chemistry view the subject appears complex but not too complicated. The basic initiating step in ROS production, single electron reduction of oxygen, is likely a simple bimolecular elementary reaction and must therefore follow mass action law according to which the rate of reaction is proportional to concentrations of reactants (but see the discussion on potential oxygen binding site(s) below). This step is apparently the rate-limiting step in the whole cascade; despite robust rates of generation, none of the downstream intermediates accumulates in appreciable quantities. Therefore, the kinetics of the first step should govern all downstream reactions.
The chemistry view allows easy resolution of some hotly debated issues, for instance, the quantitative relationship between rates of respiration and ROS production. The answer is that, in general, these two rates are rather independent of each other. According to mass action law, the rate of a reaction is determined by reactant concentration and not by another rate. For the ROS production reaction, in which one of the reactants is the reduced form of a ROS-producing site (the second one being oxygen), the rate is proportional to the concentration of this reduced form (assuming that oxygen concentration is constant). Increased reduction of the site may stem from factors that either stimulate (e.g. provision of a respiratory substrate) or suppress respiration (e.g. a transition of mitochondria from active to resting state, or an inhibitor acting downstream of the site). Conversely, decreased reduction of the site can also be caused by factors that either increase (e.g. uncoupling) or decrease respiration (e.g. an inhibition of substrate supply). Accordingly, ROS production and respiration can change in the same or in the opposite directions depending on the redox status of the ROS producing site.
Are there oxygen-binding sites in ROS-producing centers? This seemingly theoretical question may have important therapeutic significance. Indeed, the existence of high-affinity binding sites for oxygen in ROS-producing centers would indicate the possibility to map and pharmacologically target them for selective blocking ROS production without disrupting normal protein function. Boveris and Chance concluded that, under a variety of conditions, ROS production in mitochondria from heart and liver was not saturated with oxygen even at hyperbaric levels [16]. Therefore, there is no special oxygen-binding site in these reactions (technically, there was an exception: antimycin A-induced production in heart mitochondria showed possible binding but with extremely low affinity; apparent Km ≈ 0.7-0.8 atm O2 [16], equivalent to ~900 µM). This conclusion has been recently confirmed for Complex I and dihydrolipoamide dehydrogenase (DLD)-mediated ROS production [17-19]. On the other hand, Paul Brookes and coauthors reported Michaelis–Menten type kinetics for almost every known ROS production paradigm with Km values in the sub- to low-micromolar range (0.2-5 µM) [20, 21]. Unfortunately, the obvious discrepancy with the Chance and Boveris study was not discussed, so we can only state that this important issue remains unresolved.
Is superoxide the primary ROS produced? The issue of oxygen binding sites is also related to another important mechanistic question: what is the initiating step in ROS generation? Single electron reduction of oxygen to superoxide is generally believed to play the gateway role. However, for some ROS-producing reactions immediate formation of hydrogen peroxide (two electron process) was proposed, e.g. for monoamine oxidase and dihydroorotate dehydrogenase (DHO DH). Indeed, it is hard to conceive for a single electron carrier (iron–sulfur cluster or semiquinone) transfer of two electrons in a random collision reaction. Therefore, oxygen has to be bound in the ROS producing center for a time necessary for an electron donor to donate the first electron, and then receive and donate the second one before releasing the product, in this case, hydrogen peroxide.
The difficulty in distinguishing superoxide and hydrogen peroxide production is that superoxide is highly reactive and rapidly dismutates in non-enzymatic and/or superoxide dismutase (SOD)-catalyzed reactions, thus generating hydrogen peroxide indirectly. Direct quantitative measurement of superoxide is notoriously difficult and requires a robust detection system that effectively outcompetes the dismutation process.
Two groups have developed experimental protocols to discriminate superoxide and hydrogen peroxide production and applied them to studies of Complex I. Detailed kinetic study of ROS production by purified Complex I demonstrated that both superoxide and, to a lesser extent, H2O2 can be generated in the absence of the natural electron acceptor, coenzyme Q (ubiquinone). At saturating concentrations of superoxide-reactive acetylated cytochrome c, residual hydrogen peroxide generation constituted ~10% of the total, thus representing apparent direct generation [18].
Using a more intact system of submitochondrial particles (inside-out fragments of mitochondrial membrane), Grivennikova and Vinogradov investigated the relative contribution of H2O2 and superoxide to ROS generation by membrane-bound Complex I. They have demonstrated that superoxide and H2O2 generation are distinct processes with different kinetic and redox characteristics. The optimal NADH concentration for superoxide production was found to be in the range of 10-50 µM, while increasing NADH concentration to the millimolar range strongly inhibited superoxide generation. In contrast, direct H2O2 production was relatively insensitive to high NADH levels, but was negligible at low micromolar (<3 µM) NADH. Based on the differential dependence of superoxide and hydrogen peroxide production on ambient redox potential (clamped using a NAD+/NADH couple), the authors hypothesized that superoxide and hydrogen peroxide originate from two different sites within Complex I [22]. It appears that, in contrast with isolated protein [18], the relative contribution of superoxide to total ROS production by membrane bound Complex I may not exceed 1/3 (and drops even more at physiologically relevant millimolar concentrations of NADH [22]). This assessment, however, will be eventually dependent on affirmation of the robustness of superoxide detection systems that produced the conflicting results [18, 22].
Understanding the nature of primary mitochondria-derived ROS and their relative contributions might be as important as the identification of ROS generation sites. From a therapeutic standpoint, if hydrogen peroxide is indeed a major species directly generated by mitochondria, SOD-mimetics would have limited efficacy in alleviating oxidative stress, and the focus should be shifted to catalase-mimetics instead.
Are mitochondria a “major” source of ROS production? It is conventionally accepted that mitochondria are a major if not the main source of oxidative stress in the cell. However, this notion was critically assessed several years ago in a thorough review by Brown and Borutaite [23] with the conclusion that liver tissue mitochondria are a significant but not the main source of ROS, whereas there were no convincing data to argue either way for other tissues and cell types. It should be noted, however, that the maximal achievable rates of ROS production might be irrelevant for this assessment. Unlike inducible sources of ROS (e.g. NOX enzymes), ROS production in mitochondria is a byproduct of core metabolism of the cell that cannot be easily down-regulated without undermining cell function. In our view, it is not the maximal capacity to produce ROS but overall persistence that potentially renders mitochondria one of the more significant sources of endogenous ROS in cells.
The fact that mitochondria can serve as a net sink rather than net source of ROS ([15, 24] and references therein) does not completely eliminate the harm from mitochondria-generated ROS. The ROS removal acts only on the ROS that is actually present at non-zero concentration. In turn, a non-zero concentration of ROS will necessarily cause a non-zero rate of cell damaging reactions. Moreover, no matter how high the ROS removal capacity is, any increase in ROS generation will result in rising ROS concentrations and a consequent increase of the damage, unless, of course, ROS removal is actively upregulated in response.
It should be noted that, although mitochondrial ROS production is often studied under non-physiological conditions, such as in the presence of inhibitors or with induction of resting state, these are just experimental approaches to maximize the responses for purposes of detection and to probe the mechanisms. Once the mechanisms are established, we can infer to what degree they are engaged under more physiological conditions where direct measurements of ROS production might be difficult. For example, due to a very negative standard redox potential of the proximal (possibly, Complex I, or dihydrolipoamide dehydrogenase) sites of ROS production, their full activity requires a hyper-reduced state of mitochondria. However, the redox status of these sites follows Nernst’s law, which means that it could only asymptotically approach but never reach a completely oxidized state. In other words, under physiologically relevant, rather oxidized conditions, ROS producing activity from these sites is guaranteed. This activity is at the limit of detection of current methods, but it can be calculated from the redox properties of the sites. In addition, under pathophysiological conditions, mitochondrial ROS production from the proximal site(s) might be excessively activated. A recent in vivo study from Michael Murphy’s group has demonstrated that ROS production driven by reverse electron transport from succinate to the NADH pool, one of the classic paradigms for activation of the proximal site(s), is strongly increased in ischemia–reperfusion injury [25].
We can rather certainly rule out the possibility that mitochondrial ROS production at these proximal sites is a mere artifact of inhibitors “warping” electron carriers and causing them “to leak”. First, ROS production can be activated in the absence of inhibitors, by placing mitochondria in State 4, removing cytochrome c [26] or, for isolated enzyme, removing coenzyme Q [18]. Second, ROS production from the proximal sites can be elicited not only by Complex I inhibitors but also by inhibitors of Complex III (stigmatellin, myxothiazol, and antimycin A). Third, the dose–response of ROS production to the Complex I inhibitor rotenone is strongly shifted from the dose–response of respiration (that reflects inhibitor binding to the enzyme) – ~90% inhibition of Complex I is required to elicit just 10% of maximal ROS production [26].
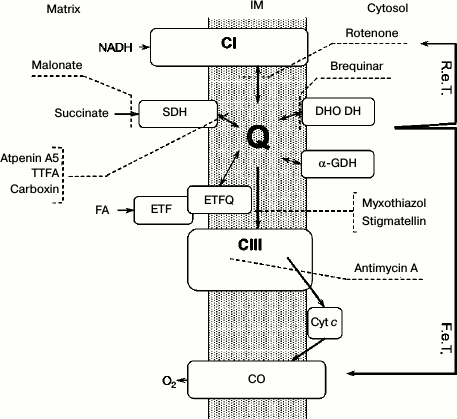
On the role of respiratory Complexes I and III. Conventionally, Complex I and Complex III (Fig. 1) are considered the major contributors to ROS production. However, localizing ROS-producing activity to a specific site is quite uncertain in intact mitochondria. What is commonly called Complex I-mediated ROS production might originate not only from Complex I itself but also from any of NAD+-linked oxidoreductases in the mitochondrial matrix. For example, a major ROS-producing activity of the DLD component of α-ketoglutarate and pyruvate dehydrogenases was convincingly demonstrated in several laboratories [27-34]. These sites require highly negative redox poise for complete activation, so we prefer to call this activity hyper-reduction-mediated ROS generation.
Fig. 1. General scheme of the respiratory chain with the sites of inhibitors of electron transfer. IM, inner mitochondrial membrane; R.e.T., reverse electron transport; F.e.T., forward electron transport; C I(III), Complex I(III) of mitochondrial respiratory chain; SDH, succinate dehydrogenase; ETF, electron-transferring flavoprotein; ETFQ, electron transfer flavoprotein:quinone oxidoreductase; CO, cytochrome c oxidase; Cyt c, cytochrome c; DHO DH, dihydroorotate dehydrogenase; α-GDH, α-glycerophosphate dehydrogenase; TTFA, thenoyltrifluoroacetone; FA, fatty acids.
Dispelling this ambiguity, however, recent progress has provided compelling evidence confirming a robust ROS-producing site in Complex I itself. It has been shown that redox properties of a ROS-producing site in both isolated enzyme [18] and membrane-bound enzyme in submitochondrial particles [22] closely resemble the site that was earlier characterized in intact mitochondria [26]. Its ability to produce ROS driven by both direct and reverse electron flow has also been recapitulated [35, 36]. Persistence of the same activity in the experimental systems with different degrees of complexity dispels concerns about an artifactual activity of isolated enzyme on one hand, and the ambiguity of site localization on the other.
Despite the attempts to create a unifying concept [35] or a consensus model [37], the community is still in a disagreement on what is the site(s) of ROS production within Complex I. In our opinion, the pivotal point should be the properties of ROS-producing center in intact mitochondria [26] as existing in the closest to a natural environment. Our analysis of the literature prompts us to conclude the following.
First, a flavosemiquinone radical should be ruled out, because no characteristic bell-shaped dependence on ambient redox potential (Fig. 1 in [38]) was observed in any of the studies [18, 22, 26, 35, 36].
Second, iron–sulfur cluster N2 should be ruled out because of its high midpoint redox potential (between –20 mV [39] and –50 to –150 mV [40]), conditions under which less than 0.01% of maximal ROS production should be occurring for the site identified in intact mitochondria [26]. Similarly, it is inconsistent with redox properties of isolated [18] and membrane-bound [22] enzyme (midpoint potentials –360 and –338 mV, respectively). Additionally, a shift towards the oxidized state of the site accompanies increased ROS production [37].
Third, reduced flavin [18, 35] has a correct midpoint potential but is a two-electron carrier and is, therefore, inconsistent with n = 1.18 obtained with intact mitochondria [26]. However, the slopes of redox titration curves are usually poorly resolved [18, 22], so that flavin might become a viable possible site.
Fourth, N-1 iron–sulfur center(s) remain the best candidates for the ROS-producing site. It has been previously suggested to be the N-1a cluster [26] based on the original description of this cluster [39]. However, this cluster remains silent in many cases, apparently because of an even more negative midpoint potential than originally thought [40]. On the other hand, cluster N-1b becomes reduced in the correct range of redox potentials in an isolated Complex I [18], and can therefore be an alternative candidate for the ROS-producing site of Complex I.
The site conventionally referred to as the Complex III site is actually just the semiquinone form of coenzyme Q. It has been proposed [41] and widely accepted that this semiquinone is tightly bound to the so-called “O”-site in Complex III. In contrast, we have proposed [6], based on redox properties of this site, that it is a free (or loosely bound to any available binding site) semiquinone in equilibrium with both reduced and oxidized coenzyme Q that acts as the actual ROS-producing site. Additionally, given structural similarity of all three redox forms of quinone, it seems highly unlikely that one of them (semiquinone) is tightly bound while two others are freely exchangeable. Accordingly, we propose to refer to this site simply as the Q-site of ROS production. Semiquinone formation has a bell-shaped dependence on redox potential, and therefore, depending on the initial redox poise, activation of this site can require either reduction or oxidation. There are multiple oxidoreductases that feed electrons to the coenzyme Q pool (Complex I, succinate dehydrogenase, glycerol-3-phosphate dehydrogenase, dihydroorotate dehydrogenase, electron-transferring flavoprotein (ETF), ETF-ubiquinone oxidoreductase, etc.). All of these enzymes might be capable of activating the Q-site of ROS production in addition, or as an alternative, to their proposed intrinsic ROS-producing activities. In our opinion, perturbations of the coenzyme Q redox state must be assessed as a part of inhibitor analysis to probe the intrinsic ROS producing capabilities of the ubiquinone-linked oxidoreductases.
Succinate dehydrogenase. The ability of succinate dehydrogenase (Complex II, CII) to generate ROS had been debated in the past (see [42] and references therein). It was concluded [42] that CII can be a substantial source of ROS both in situ (intact COS7 cells) and in vitro (bovine heart submitochondrial particles). The reasoning was based on the effects of antimycin A and inhibitors of CII on succinate-driven ROS production (see Fig. 1). The source of ROS was ascribed to stabilized ubisemiquinone at the CII quinone-binding site. The formation of this CII-bound semiquinone in isolated CII + CIII is, somewhat paradoxically, enhanced by antimycin A (a CIII inhibitor that is implicated in ROS generation conventionally attributed to CIII – the Q-site ROS production, see above) but is abolished by CII inhibitors, such as thenoyltrifluoroacetone (TTFA) and carboxins [43]. Accordingly, the observed ROS suppression by the CII inhibitors was attributed to semiquinone bound to CII [42]. It should be noted, however, that CII inhibitors are supposed to block electron provision to coenzyme Q regardless of its association, or lack thereof, with CII (or with the “O”-site in CIII). The authors also speculated that the CII flavin could be involved in ROS generation [42]. However, interpreting their data is difficult because of the detection system used. Dichlorofluorescin diacetate (DCF-DA) in the absence of horseradish peroxidase (HRP) was employed despite the fact that HRP increased the apparent rate of ROS production approximately 7-fold [42], demonstrating that peroxidase activity of mitochondria (rather than their ROS producing activity) was the rate-limiting step.
Recently, more rigorous assessment of ROS generation at CII site was done by the groups of Brand (in intact mitochondria) [44] and Drose (in bovine heart submitochondrial particles) [45]. The former study identified a specific set of conditions under which CII in isolated rat skeletal muscle mitochondria generated H2O2 with a significant (~1 nmol/min per mg protein) rate. These conditions include a low concentration of succinate (with peak ROS production at 0.4 mM [44]) and an inhibited respiratory chain downstream of CII. The inhibition was achieved either with inhibitors of CIII [44, 45] or with atpenin A5, which prevents electron transfer from CII to the ubiquinone pool [45]. The latter inhibitor is very specific to CII and much more potent (with Ki ~ 0.004 µM) than inhibitors that were used in earlier studies (TTFA, carboxins). Atpenin A5 presumably binds to a region that partially overlaps with the coenzyme Q binding site in CII, such that the inhibition of ubiquinone reduction can be 100% effective, whereas inhibition of CII “dehydrogenase” activity (reduction of an artificial acceptor in assays of the enzymatic activity) is potent but incomplete even at 10 µM [46].
The ROS production in the presence of CIII inhibitors is completely suppressed by malonate (which competes for the succinate-binding site, thereby preventing the flow of electrons into CII) and is inhibited by approximately 50% by atpenin A5 [44]. This indicates at least two sources of ROS production – one in CII itself and another in the coenzyme Q pool. Consistently, the CIII inhibitor stigmatellin causes an approximately three times greater succinate-driven ROS production than atpenin A5 [45], indicating larger contribution of the ubiquinone pool in comparison to CII. Thus, the inhibitory effect of atpenin A5 in the presence of CIII inhibitor is apparently a (larger) decrease in ROS production in the coenzyme Q pool superimposed on a (smaller) increase in CII. Although Quinlan and coauthors reached a paradoxical conclusion that all succinate-driven ROS production comes from CII [44], the complex effects of atpenin A5 place their line of reasoning in question, especially given the inhibitory effects on the “dehydrogenase” activity [46] of CII.
Inhibition by excess succinate suggests that ROS production occurs only when the succinate-binding site is not occupied by substrate [44]. This conclusion was corroborated in the study by Siebel and Drose [45] that demonstrated that CII ROS generation was diminished by all dicarboxylates that are known to bind to the substrate-binding site of CII. Consistently, the inhibition of ROS production by malonate was shown to be noncompetitive with succinate [44].
CII can also produce ROS in the reverse reaction, when the electrons are supplied to CII from the reduced ubiquinol pool [44]. This reaction is equally sensitive to atpenin A5 and malonate, implicating reduced flavin adjacent to the succinate-binding site as the primary site of ROS production in CII [44].
The CII-specific ROS generation is unaffected by the redox state of the Q pool and the activity of other respiratory chain complexes. The estimated composition of ROS produced in this reaction was approximately 75% H2O2 and 25% superoxide [45]. However, reliability of this estimate will depend on affirmation of the robustness of the superoxide detection system.
Although the complex mechanism of ROS production by SDH can be debated, it might be most important to note that the robust ROS production by this enzyme occurs under a very restrictive and internally conflicting set of conditions (a high degree of reduction of CII electron carriers induced by inhibitors acting downstream and, at the same time, a low concentration of substrate providing reducing equivalents). Omission of the inhibitors leads to greatly diminished [44] or completely abolished [45] contribution of CII-generated ROS. Also, it was reported that at least in experiments with isolated rat heart, muscle, or liver mitochondria, CII did not produce superoxide or H2O2 under “normal” incubation conditions [47].
Thus, the question that remains is how relevant are those restrictive conditions to metabolism and physiology? Estimated succinate concentrations in cells/tissues are in the range of 0.1-0.4 mM [15], appropriate for ROS production in CII. Hyper-reduction of CII might happen in tissue hypoxia or ischemia when oxygen is limiting. However, succinate is known to accumulate many fold under such conditions (up to 10-15 mM) [15, 25]. Similarly, succinate is reported to accumulate during inflammation [48]. Even under normal conditions, succinate concentration exhibits several-fold fluctuations from 0.3 to 1 mM in perfused heart; it also accumulates in muscle tissue during exercise [15]. This should preclude ROS generation. Additionally, this site of ROS production is sensitive to other dicarboxylic intermediates of the tricarboxylic acid cycle [45], so the overall suppression by ligand binding might be even greater. These ligands would also inhibit provision of reducing equivalents to CII further minimizing ROS production.
From a mechanistic standpoint, blocked electron flow in the presence of inhibitors both up and downstream of CII renders the conditions of ROS production near equilibrium. Therefore, thermodynamic control must play the major role in its regulation. Unfortunately, thermodynamic characterization of the ROS-producing site(s) (redox potential, etc.) is currently lacking, severely limiting our understanding of ROS production in CII.
Dihydroorotate dehydrogenase. Existence of an intrinsic ROS generating site within the mitochondrial enzyme DHO DH has been a subject of debate for nearly three decades. Generation of ROS during oxidation of dihydroorotate (DHO) by rat liver mitochondria was first inferred in 1974 from SOD-dependent inhibition of the dehydrogenase activity in the presence of an artificial electron acceptor [49]. Originally, the superoxide generation was attributed directly to a site within DHO DH [49, 50] based on its inhibition by orotate, the product and competitive inhibitor of DHO DH, but not by the respiratory chain inhibitors antimycin A or TTFA, suggesting a site alternative to known sites in the electron transport chain (ETC) [50]. However, in a follow-up study that used cytochrome c as acceptor [51], TTFA and antimycin A eliminated the SOD effect. These results were used to argue that superoxide generation occurred in the ETC (primarily at CIII) rather than in the DHO DH. Methodological limitations and lack of appropriate inhibitors led to ambiguity of these conclusions. Nonetheless, the hypothesis of ROS production by DHO DH remained viable and re-emerged in studies with isolated enzyme. Along with a dehydrogenase activity, in the absence of coenzyme Q, isolated DHO DH displayed a pronounced “DHO oxidase” activity [52]. Direct assay using dichlorofluorescin (DCF) + horseradish peroxidase (HRP) detection system demonstrated that in this reaction, oxygen was reduced to H2O2, and the activity equaled about 10% of DHO DH activity [52]. Staining for H2O2 was positive in the presence of DHO in histochemical samples from various tissues [53]. However, it remained unclear to what extent this activity would engage in intact mitochondrial membrane and whether it is identical to ROS-producing activity of intact mitochondria.
Recently, Brand and coworkers [54] separated two components of ROS generation linked to DHO oxidation. In skeletal muscle mitochondria, where the level and activity of the enzyme are so low that DHO-dependent oxygen consumption could not be detected, they were able to detect measurable DHO-dependent H2O2 production. Based on sensitivity to specific inhibitors malonate and atpenin A5, it was concluded that the majority of ROS apparently originated from CII [54]. The rate of superoxide/H2O2 generation attributed to DHO DH itself (~20 pmol/min per mg protein) constituted less than 10% of the total rate. Based on the inhibitory effect of brequinar that blocks electron transfer between the flavin and ubiquinone-binding site of DHO DH, the authors concluded that the site of ROS generation is the ubiquinone-binding site [54]. However, brequinar has been shown to block normal dehydrogenase activity (electron transfer from DHO to coenzyme Q) but not the ROS-producing “DHO oxidase” activity of isolated enzyme [52], rendering this conclusion controversial. Since ROS-producing “DHO oxidase” activity is differentially distributed among tissues [53], the contribution of ROS from the putative DHO DH site to overall mitochondrial ROS emission requires further investigation.
ROS generation during DHO oxidation, either directly by DHO DH or linked to its catalytic activity, might have therapeutic relevance to diseases involving dysregulation of apoptosis. Hail and coauthors [55] demonstrated that various transformed cells expressing DHO DH were prone to undergo apoptosis induced by fenretinide, a potential anticancer drug with prooxidant effects, while cells lacking detectable DHO DH expression (such as SW480 colon cancer cells) were resistant to the cytotoxic effects of the drug. Moreover, downregulation or chemical inhibition of DHO DH in cancer cell lines reduced fenretinide-induced ROS generation and apoptosis, while the effect on mitochondrial respiration was relatively small [55].
p66shc. The novel and intriguing putative source of ROS in mitochondria that was discovered during the last decade is senescence-related protein p66shc. It is the first example of a ROS-producing site that is imported to mitochondria, where it is activated. This protein is proposed to be normally cytosolic but to translocate to mitochondria upon oxidative stress-induced phosphorylation at Ser36 by protein kinase Cβ and recognition by prolyl isomerase Pin1 [56]. Consistently, the corresponding ROS-producing activity is undetectable in mitochondria from control animals but is triggered by their injection with CCl4 [57]. The S36D mutant that mimics Ser36-phosphorylated p66shc is capable of causing ROS generation in intact mitochondria [58] as opposed to wild-type protein that interacts with mitoplasts, mitochondria devoid of the outer membrane [57]. The magnitude of this activity is comparable to the most potent classic ROS producing mechanism (the Q-site) and can reach 10 nmol/min per mg protein [57].
The original study provided some data arguing that in model systems p66shc could interact with cytochrome c, accept electrons from it, and donate them to oxygen, thus serving as the site of ROS production [57]. This site has a rather positive midpoint potential estimated to be –35 mV [57]. It should be noted, however, that this value is apparently relative to saturated calomel reference electrode (SCE), as the cytochrome c midpoint potential measured in the same experiment was +17 mV. Given the textbook value of the midpoint potential for SCE equal to +244 mV [59], the standard midpoint potential of p66shc can be estimated as approximately +209 mV (relative to standard hydrogen electrode conventionally used as the reference point in mitochondrial bioenergetics). This is by far the most redox positive site that must be capable of producing ROS virtually independently of redox poise of the core metabolic pathways in mitochondria (i.e. producing ROS equally under the most reduced and most oxidized conditions).
Surprisingly, however, in the 10 years after the original report there has been very little direct corroboration of the behavior of this potential ROS site, despite the fact that the original studies left some questions open.
First, the localization of the protein to mitochondrial intermembrane space necessary for its interaction with cytochrome c was not convincingly demonstrated. The bulk of this protein appears in the microsomal (mainly endoplasmic reticulum (ER)) fraction, and its distribution among differential centrifugation fractions mirrors exactly the distribution of the ER marker calnexin [57]. It is impossible, therefore, to conclude whether the p66shc detected in mitochondrial fraction resides in mitochondria or in contaminating ER. Its apparent increase in the mitochondrial fraction upon oxidative stress [57] could be either due to real translocation, upregulated ectopic expression (evident from Fig. 4E in [56]), or tighter association of ER and mitochondria. There has been no attempt to further purify the mitochondrial fraction using a density gradient. The effect of digitonin that normally releases intermembrane space proteins was marginal at best. On the other hand, the very fast (tens of seconds) response of mitochondria with intact outer membrane to exogenously added Ser36Asp mutant protein [58] might indicate that the true interacting partner of p66shc is outside of mitochondria.
Second, dichlorofluorescin diacetate (DCF-DA) was employed to assay ROS production in mitochondria/mitoplasts. This probe, typically used in intact cells rather than mitochondria, relies on two cellular catalytic activities prerequisite for its reactivity with hydrogen peroxide (see discussion of DCF-DA below). The observed atypically nonlinear probe responses [57, 58] indicate some deficiencies in the assay.
Third, it is not clear what prosthetic group, if any, underlies the redox cycling of p66shc. It cannot be a heme because it does not show on the absorption spectrum [57]. There is just one cysteine residue (Cys81) in the sequence proposed to be the redox center – not enough to form an iron–sulfur center, and the high redox potential of the protein is inconsistent with the reactivity of the cysteine thiol group itself.
Fourth, the model states that p66shc accepts electrons from reduced cytochrome c and donates them to oxygen. However, this mechanism clearly does not work if only these two components are present, and additionally, copper ions are required [57]. Copper ions also appear to be indispensable for the reaction in the presence of intact mitochondria and the Ser36Asp p66shc mutant [58].
Fifth, the proposed binding site for cytochrome c has more cationic than anionic residues and is, therefore, likely to carry a net positive charge. This should lead to a repulsion of the positively charged cytochrome c rather than its binding. It also presents a stark contrast to conventional models of cytochrome c binding in which the positively charged surface of cytochrome c electrostatically interacts with negatively charged binding sites of its partners (e.g. see [60] and references therein). Also, it should be noted that the difference in voltammetric curves between p66shc alone and in combination with cytochrome c (Fig. 3A vs 3B in [57]) could be due to displacement of p66shc by cytochrome c rather than their binding. Indeed, the p66shc + cytochrome c curve is very similar to the one with cytochrome c alone; a modest difference in the apparent redox potential is well within variability of the assay (see cytochrome c curves on Fig. 3, A and B vs Fig. 5, A and B in [57]).
On the other hand, there is a large body of literature describing cell-based and in vivo phenomenology consistent with the proposed pro-oxidant function of p66shc (for review, see [61, 62]). The involvement of a mitochondrial oxidative stress component in the cell responses was assessed using mitochondria-targeted antioxidants, so-called SkQs (“Skulachev-Qs”), and demonstrated a 20-40% saturable protection [63]. In our opinion, this is the higher limit for the mitochondrial contribution to p66shc-mediated oxidative stress. Given the significant role of p66shc in determining longevity and susceptibility to disease like cancer and diabetes, it appears important to resolve the outstanding mechanistic issues in the mitochondrial prooxidant function of this protein.
MITOCHONDRIAL ROS SCAVENGING
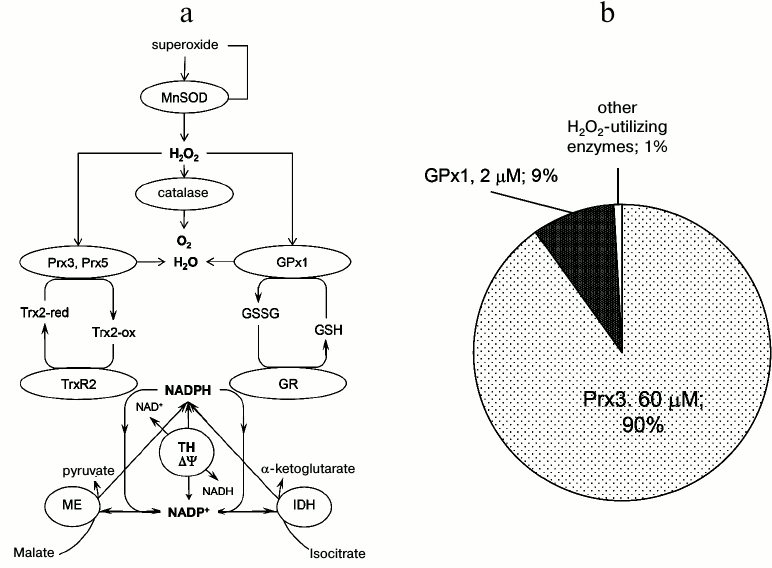
Significant progress has been made since 2005 in studies of the enzyme-based mitochondrial ROS defense system. The components of this system are reasonably well defined; it can be divided into three “branches” (Fig. 2). The first is independent of reducing equivalents for ROS decomposition activity, and includes superoxide dismutase 2 (MnSOD) and catalase. The second branch depends on thioredoxin (Trx) and thioredoxin reductase (TRx2) for regeneration after the reaction with ROS, and also includes peroxiredoxins 3 and 5 (Prx3 and Prx5), which are located in the mitochondrial matrix. The third branch depends on glutathione (GSH) and glutathione reductase (GR) to regenerate GSH, and consists of glutathione peroxidase 1 (GPx1; Fig. 2), glutathione peroxidase 4 (GPx4), and glutaredoxins (not discussed in this review and not shown on Fig. 2 for clarity; see [6, 15] for details). The latter two branches ultimately depend on NADPH, which in turn is regenerated by three matrix-located enzymes, namely isocitrate dehydrogenase (NADP+-linked), malic enzyme, and the transhydrogenase (Fig. 2) [6, 15]. It is not known which of these three enzymes contributes the most to the regeneration of NADPH in mitochondria, and this likely depends on their expression level in various tissues and on specific metabolic conditions [64]. Pharmacological inhibition of transhydrogenase in isolated rat brain (but not liver) mitochondria significantly decreased their ability to scavenge H2O2 in the presence, but not in the absence of respiration substrates [65]. On the other hand, mice with a natural mutation that ablates the transhydrogenase completely (C57Bl/6J strain [66, 67]) have no particular oxidative stress-linked phenotype, thereby implying that the transhydrogenase is disposable as a source of NADPH. It is worth noting that this specific strain of mice is one of the most frequently used in various studies and for creating transgenic animals, with no attention paid to the fact that one of the three mitochondrial NADPH-regenerating enzymes is absent from these animals.
Fig. 2. Mitochondrial ROS removal system. a) General scheme of enzymatic mitochondrial ROS removal system. b) Contribution of individual enzymes to ROS removal. See text for details. MnSOD, manganese-containing superoxide dismutase 2 (SOD2); Prx3, peroxiredoxin 3; Prx5, peroxiredoxin 5; GPx1, glutathione peroxidase 1; GSH, glutathione; GSSG, glutathione disulfide (oxidized glutathione); Trx2-red, thioredoxin 2, reduced; Trx2-ox, thioredoxin 2, oxidized; TrxR2, thioredoxin reductase 2; TH, transhydrogenase; GR, glutathione reductase; ME, malic enzyme; IDH, isocitrate dehydrogenase, NADP+-linked; ΔΨ, membrane potential. For the characteristics of individual enzymes and more details, see [6, 15, 74].
MnSOD. This enzyme has long been regarded as a simple non-regulated superoxide scavenger that dismutates superoxide to H2O2. However, it was found that the activity of MnSOD can be modulated by a sirtuin (SIRT3) that is also located in the matrix of mitochondria. SIRT3 can significantly increase the activity of MnSOD by deacetylating Lys122, which is evolutionarily highly conserved [68-70].
Catalase. In addition to rodent heart mitochondria that were shown to contain a modest amount of catalase (~20 U/mg protein [71]), this enzyme had been found in the matrix of liver mitochondria (~825 U/mg protein [72] and ~1100 U/mg protein or 80 µg/mg protein in Percoll-purified mouse liver mitochondria; our unpublished results). Some trace amounts have also been measured in mouse brain mitochondria (purified by Percoll gradient, ~1.8 U/mg or 72 ng/mg mitochondria [24]). Due to its low content, it is unlikely that catalase plays a significant role in decomposing H2O2 in heart and brain mitochondria; however, it is most likely important in protecting liver mitochondria against H2O2 [72].
Glutathione peroxidase-1 and peroxiredoxins. The former enzyme (GPx1) had long been considered as one of the major H2O2 scavengers, despite earlier estimates that it detoxifies only approximately 15% of H2O2 produced in mitochondria [73]. However, a few recent studies strongly challenged the importance GPx1 in H2O2 scavenging, placing the emphasis on mitochondrial “oxin” enzymes (peroxiredoxins, thioredoxin, thioredoxin reductase). Mitochondria from nearly all mammalian tissues contain two peroxiredoxins (Prx3 and Prx5), thioredoxin (Trx2), and thioredoxin reductase 2 (TrxR2) (Fig. 2). Based on its very high rate constant for the reaction with H2O2 (comparable with that of catalase) and plentiful abundance in the matrix of mitochondria (~60 µM), Prx3 had been proposed as the major mitochondrial H2O2 scavenging enzyme [74]. Considering the known reaction rate constants and abundance of enzymes, Cox and colleagues proposed that 99.9% of H2O2 in the mitochondrial matrix could be metabolized by only four enzymes – Prx3 (~60 µM, rate constant k = 2·107 M−1·s−1, Km for H2O2 < 20 µM, 90%), GPx1 (2 µM and k = 6·107 M−1·s−1, 9%), Prx5 (20 µM and k = 7·107 M−1·s−1, 0.45%), and glutathione peroxidase 4 (GPx4, not shown on Fig. 2; 2 µM and 3·106 M−1·s−1, 0.45%) [74]. Typical 2-Cys peroxiredoxins, such as Prx3, catalyze utilization of H2O2 in two reaction steps. First, H2O2 reacts with the so-called peroxidase cysteine residue in the protein to form a sulfenic acid (Cysp-SOH), which condenses with the so-called resolving cysteine of the second enzyme subunit to form an intermolecular disulfide bond. Second, the oxidized form of mitochondrial Prx is reduced back to the native state by Trx2, which is itself reduced by TrxR2 (Fig. 2). It should be noted that rate constants for the reaction of mitochondrial peroxiredoxins with Trx2 have not been determined [74], but likely are much slower than the rate of their reaction with H2O2. In addition, Trx2 is present in mitochondria at a much lower concentration than Prx3 (cf. [74]). Another important feature of Prx3 is that in the presence of excess H2O2, the enzyme is very sensitive to oxidative inactivation (“hyperoxidation”). This happens upon oxidation of Cysp-SOH by a second H2O2, forming a sulfinic acid derivative (Cysp-SO2H) that is enzymatically inactive (however, Prx5 is insensitive to hyperoxidation) [74]. Hyperoxidized peroxiredoxins are restored by ATP-dependent sulforedoxin in a very slow (kcat = 0.18 min−1) reaction.
Altogether, these features place in question whether mitochondrial peroxiredoxins are actually capable of sustained H2O2 removal under conditions of continuous endogenous H2O2 generation or upon an exogenous H2O2 challenge, when the recycling rate should become an important factor [74]. Nevertheless, several studies seem to corroborate the prevalence of “oxins” over GPx1 in detoxifying mitochondria-generated H2O2. Patel’s group [75] reported very high rates of H2O2 scavenging by brain mitochondria, ~9-12 nmol H2O2/min per mg protein, which is ~100 times higher than the highest rate of ROS generation by brain mitochondria oxidizing NAD+-linked (physiological) substrates (~0.06-0.1 nmol/min per mg [15]). Inhibition of GPx1 had no consequence on the rate of H2O2 conversion, whereas inhibiting TrxR2 or oxidative inactivation of Prx3 resulted in a significant inhibition of H2O2 utilization rate (80 and 50%, correspondingly) [75]. The results from a more recent study [24] are in a very good agreement with those published by Drechsel and colleagues [75]. It was also shown that brain mitochondria isolated from GPx1-ablated mice [76] exhibited exactly the same rates of H2O2 removal as wild-type mouse brain mitochondria [15]. An additional argument in favor of a limited role of GPx1 in ROS defense is that GPx1-ablated mice were healthy and fertile and showed neither an increased sensitivity to hyperoxia, nor an increased burden of oxidative stress markers [76]. Thus, it seems that mitochondrial “oxins” play the major role in removal of H2O2, whereas the GSH-dependent system likely plays a different role, e.g. preventing “oxins” from hyperoxidation or removing small organic hydroperoxides (although Prx5 can decompose the latter even more efficiently than H2O2) [77, 78].
MITOCHONDRIAL ROS EMISSION. THE UNCERTAINTY PRINCIPLE
The appreciation that mitochondria are at the same time both a source and a sink for ROS is becoming increasingly common. On the other hand, an oversimplified view of the ROS emission as a difference between ROS generation and removal in mitochondria is also taking root. The latter implies that there is a certain portion of the produced ROS that is “emitted” into surrounding milieu. In fact, however, the ROS removal is so efficient that mitochondria act predominantly as a sink ([24] and references therein), and no detectable accumulation of ROS occurs in intact isolated mitochondria [6].
Of course, an apparent ROS emission by isolated mitochondria is readily detectable using various probes (e.g. Amplex Red + HRP, etc.). However, it is important to realize that any efficient ROS detection system perturbs the natural state of ROS-metabolizing pathways. Any ROS detection system is in essence an “antioxidant”, actively competing for ROS with the ROS removal pathways. It, therefore, overestimates the magnitude of ROS emission by mitochondria. In other words, the observable ROS emission is an artifact of the presence of the detection system. Nevertheless, it is useful for practical purposes as an easy integral readout of the net result of interplay between ROS generating and utilizing pathways. This assessment is a semiquantitative relative measure of the changes or differences between different states of the same sample or between different samples of mitochondria. However, it is meaningful only if the activity of the detection system is kept constant.
From a physiological standpoint, mitochondrial “ROS emission” is the fraction of produced ROS that escapes detoxification and that is capable of inflicting damage to the cell components. For physical chemistry, however, the process of damaging cell constituents is just competing reaction(s) that diverts some ROS from the removal pathways, similar to exogenous ROS detection systems discussed above. The problem is that assessing it directly with a conventional ROS detection system is not possible without changing it (see above). This constitutes what we propose to call an uncertainty principle for ROS emission (borrowing the term from quantum physics and using it in a somewhat similar sense). It should be noted, however, that the inability to measure ROS emission does not preclude measuring separately ROS generation and ROS removal capacities of mitochondria or other ROS metabolizing organelles (see below).
On the other hand, the chemistry approach suggests that a “steady-state” level (as opposed to a rate of change) of ROS could be a better measure of the physiological “ROS emission”. Indeed, according to mass action law the rate of an elementary reaction (including mechanistic steps of “infliction of damage”) is proportional to the concentration of reactant. Hence, knowledge of the ROS concentration would allow one to infer the rates of the damaging processes. This requires methods of detection that are practically devoid of ROS removal activity. In other words, the method must be based on a reversible binding of ROS. The ideal tool would have a low affinity and high intensity of response (i.e. for optical probes, to be very bright).
The knowledge of physiological “ROS emission” per se, however, would not allow identifying targets of oxidative injury or determine extent of the damage, and whether it is above the threshold of a biological effect. Secondary readouts, such as modification of cellular components, signaling processes and/or biological function, are necessary to complete the picture of oxidative stress.
Spatiotemporal complexity of the cellular oxidative stress is poorly resolved by most conventional methods and approaches. ROS production is localized to specific sites, whereas the majority of detection systems measure average (or bulk) ROS emission. Localizing the ROS source requires a detection system that can be targeted to various subcellular compartments/locations. Genetically encoded fluorescent indicators (GEFIs) fulfill this requirement (discussed in the next section).
NOVEL APPROACHES TO EVALUATE SPATIOTEMPORAL LEVELS OF
H2O2 in situ AND in vivo
Although this review was meant to describe the recent advances in studies of ROS metabolism in mitochondria, it would be incomplete without at least a brief look at the arsenal of research tools. To date, fluorogenic probes remain the workhorses in these studies.
Reliable measurement of superoxide is quite difficult because of its short half-life and compartmentalization. More stable and membrane permeable hydrogen peroxide can be readily measured using H2O2-specific enzyme HRP and a variety of its fluorogenic substrates [79]. It should be noted that measurement of ROS generation in these assays requires internal calibration [80]. ROS removal can be measured separately [24] or determined from the same internal calibration. Currently, Amplex Red (10-acetyl-3,7-dihydroxyphenoxazine) and its recent, more stable derivative Amplex UltraRed are the compounds of choice in HRP-based H2O2 assays [79, 81]. Another very popular compound that is used to measure ROS is DCF-DA. However, extreme care should be used when working with this probe. It was originally developed by Keston and Brandt in 1965 as an advanced substrate for HRP [82, 83] that showed no reactivity towards hydrogen peroxide in the absence of enzyme [84, 85]. Additionally, the acetylated compound had to be converted to non-fluorescent active probe DCF by alkaline hydrolysis prior to the assay [82-85]. Further research demonstrated that HRP can be substituted with iron-containing porphyrin hematin [84] but with a shift of DCF/peroxide stoichiometry from 2 : 1 [86] to 1 : 1 [84] and with extremely slow response times. Exact kinetics of the hematin-catalyzed reaction was not reported, but conversion of 500 pmol hydrogen peroxide required ~40 min at 50°C [84]. The rate of conversion was rather constant, so we can estimate it at ~12.5 pmol/min, which is much lower than rates of most ROS-producing reactions. Substituting HRP with divalent iron somewhat improved the response time (the assay completion required “only” 5-15 min at 37°C) [85] but at the expense of a significant loss of specificity towards H2O2 [85].
It should be noted that in the vast majority of current publications DCF-DA is employed in the absence of any peroxidase catalyst (HRP, hematin, or iron) and without prior deacetylation, therefore, relying on unknown endogenous components to catalyze the two requisite reactions. Unless these (unknown) catalytic activities exceed by far the ROS generation rate, DCF-DA would report these activities rather than the ROS production rate. For example, it has been observed that in submitochondrial particles HRP increased the apparent rate of ROS production several-fold [42]. This meant that the endogenous peroxidase activity was insufficient to match the ROS generation rate, and the use of DCF-DA in the absence of HRP was not justified. Moreover, if the endogenous activities change with time or between treated and untreated samples, one might observe false positive “oxidative stress” events.
Recent methodological progress in ROS research originates from advances in development of GEFIs. While there are several commercially available ROS-sensitive GEFIs, we will focus only on one class of these proteins, HyPer, which were among the first developed and, in our opinion, remain the best studied, most selective, widely used, and versatile GEFIs.
The design of HyPer family H2O2 sensors is based on E. coli transcription regulator OxyR that selectively senses tiny amounts of H2O2 by its regulatory domain, OxyR-RD [87]. OxyR-RD contains several Cys residues, two of which are critical for H2O2 sensing. The Cys199 has low pKa, and it is positioned in a hydrophobic surrounding [88]. The low pKa allows Cys199 to react rapidly with H2O2 with a rate constant 105-107 M–1·s–1 [89, 90]. A hydrophobic pocket restricts penetration of charged oxidants (e.g. superoxide anion) while allowing the penetration of amphiphilic H2O2. By reacting with H2O2, Cys199 becomes oxidized to sulfenic acid and repelled by the hydrophobic pocket due to the acquired electric charge. This lets Cys199 move proximal to Cys208 and form a disulfide bond with it [88]. In turn, the disulfide formation results in a profound conformational change in the OxyR-RD fold. The original HyPer was made by integrating cpYFP into the conformation-changing region in OxyR-RD, between residues 205 and 206 [91]. It has two excitation peaks, at 420 and 500 nm, and one emission peak at 516 nm. Oxidation of HyPer by H2O2 results in a decrease in the 420-nm excitation peak and a proportional increase in the 500-nm excitation peak, making the sensor ratiometric. This is a great advantage of this probe, as a ratiometric readout prevents many imaging artifacts caused by object movement and different expression levels between cells or compartments. Another great advantage of HyPer is its reversibility: similar to oxidized OxyR, it can be reduced by cellular thiol-reducing systems. High sensitivity to H2O2 (low-to-middle nanomolar range) [91], fast reaction rate constant (105 M–1·s–1) [92], and reversibility [91] make HyPer a versatile tool to assess real-time dynamics of H2O2 in the living cell.
The most important feature of HyPer (and other GEFIs) is that it is a protein and can be genetically manipulated. Hence, by simply adding a subcellular localization tag to the protein sequence, it is possible to target it to a specific compartment of the cell, such as the nucleus, mitochondrial compartments, peroxisomes [93], or other cell compartments for which the protein-targeting sequence is known. Moreover, it can be fused with various proteins of interest, therefore ensuring sub-compartmental measurement of H2O2 [94].
Recently, two enhanced versions of HyPer have been developed, namely HyPer-2 [95] and HyPer-3 [92]. Moreover, a red fluorescent version of HyPer is now available. This probe has been recently used to detect the real time mitochondrial H2O2 production upon inhibition of the ER SERCA Ca2+ pump [96].
It should be noted that there are serious limitations of HyPer. First, the midpoint potential of the redox-active Cys pair in the OxyR domain is –185 mV [87]. Thus, HyPer can be used only in the relatively reducing environment of the nucleocytoplasmic compartment [91, 93, 94], mitochondria [91, 93], and peroxisomes [93, 97, 98]; it is not suitable for use in the relatively oxidized environment of the lumen of the endoplasmic reticulum. Second, the chromophore of wtGFP contains a Tyr residue that can be either protonated (neutral) or deprotonated (anionic) [99-101]. In pH-sensitive proteins, the chromophore environment is organized in a way that allows proton transfer from the chromophore Tyr to the media [100]. Therefore, changes in pH lead to changes in chromophore protonation. Most cpYFPs have a chromophore connected to the surrounding milieu. This means that these H2O2 probes are also pH-sensitive, and HyPer is no exception to this rule. Its 420 and 500 nm excitation peaks correspond to protonated and anionic forms of the chromophore, respectively. Acidification of the environment leads to an increase in the protonated form (ex. 420 nm) and a decrease in the deprotonated form (ex. 500 nm), thereby mimicking a reduction of the probe [91]. Alkalization, in contrast, mimics an oxidation of HyPer. This pH sensitivity can result in pH-driven artifacts, especially inside the matrix of mitochondria, where pH fluctuations can be high and the pH value in the matrix is close to the pKa of the sensor. To address the pH sensitivity issue, several versions of HyPer were recently developed on the base of pH-stable fluorescent proteins (Dr. Belousov, unpublished results). Three colors, blue, green, and red, are now available. All of the new probes have superior pH-stability as compared to previous HyPer versions. Moreover, green and red probes are of exceptional brightness (140 and 80% compared to EGFP, respectively), making them the brightest of all other contemporary GEFIs. This new generation of HyPer family of H2O2 sensors appears to be the most robust tool so far to study the spatiotemporal relationships between intracellular ROS sources and targets, to further our understanding of the role of mitochondria in oxidative stress.
This review emphasizes the progress that has been made over the last decade in understanding the sources and mechanisms of ROS production in mitochondria, but the story is far from over. There is still no well-developed technology to evaluate the capacity and significance of these sources in cells and tissue. There is still no understanding of the role of mitochondrial ROS in living beings. What are the relevant ROS sources under relevant conditions, what are the rates of ROS generation, what is the damage or physiological responses it causes? These questions remain to be answered by future research.
The endogenous antioxidant system of mitochondria is efficient and potent, and reasonably well studied. What remains to be found is its true capacity under “real life” conditions, how it is regulated, and how the ability to detoxify endogenous and exogenous ROS defines the role of mitochondria in cell signaling and pathological processes. The exciting new tools that were developed over the last decade, such as GEFIs discussed above, will certainly help to move this research from chopped tissue and extracted mitochondria in a test tube to the more physiological level and will advance our understanding of mitochondrial ROS metabolism in situ. The new generations of mitochondria-targeted antioxidants such as those developed by Murphy’s [12] and Skulachev’s [13] groups promise to become indispensable in researching the role of mitochondrial ROS metabolism at the level of organisms and give us a valuable pharmacological tool to treat oxidative stress-related pathologies.
What emerges in the light of dawn we are still discovering bit-by-bit. Is the evil as deadly as it seemed? Are there other dangers we have overlooked? Are we close to understanding the role of mitochondria in ROS metabolism? Are we winning the battle?
Authors are very grateful to Dr. Vsevolod Belousov for thorough discussion and help with writing the section on GEFIs, and to Dr. Natalia Starkova for translating the article into Russian.
Supported by NIH NS087611, DK094352, DK054441 to ANM and AYA, and NIH AG/NIA P0 AG014930 to AAS.
REFERENCES
1.Zimorski, V., Ku, C., Martin, W. F., and Gould, S.
B. (2014) Endosymbiotic theory for organelle origins, Curr. Opin.
Microbiol., 22C, 38-48.
2.Galluzzi, L., Bravo-San Pedro, J. M., and Kroemer,
G. (2014) Organelle-specific initiation of cell death, Nat. Cell
Biol., 16, 728-736.
3.Skulachev, V. P. (2000) Mitochondria in the
programmed death phenomena; a principle of biology: “it is better
to die than to be wrong”, IUBMB Life, 49,
365-373.
4.Kushnareva, Y., and Newmeyer, D. D. (2010)
Bioenergetics and cell death, Ann. NY Acad. Sci., 1201,
50-57.
5.Tait, S. W., and Green, D. R. (2012) Mitochondria
and cell signaling, J. Cell Sci., 125, 807-815.
6.Andreyev, A. Y., Kushnareva, Y. E., and Starkov, A.
A. (2005) Mitochondrial metabolism of reactive oxygen species,
Biochemistry (Moscow), 70, 200-214.
7.Drose, S., Brandt, U., and Wittig, I. (2014)
Mitochondrial respiratory chain complexes as sources and targets of
thiol-based redox-regulation, Biochim. Biophys. Acta,
1844, 1344-1354.
8.Grivennikova, V. G., and Vinogradov, A. D. (2013)
Mitochondrial production of reactive oxygen species,
Biochemistry (Moscow), 78, 1490-1511.
9.Kaludercic, N., Deshwal, S., and Di Lisa, F. (2014)
Reactive oxygen species and redox compartmentalization, Front.
Physiol., 5, 285.
10.Lambert, A. J., and Brand, M. D. (2009) Reactive
oxygen species production by mitochondria, Methods Mol. Biol.,
554, 165-181.
11.Murphy, M. P. (2009) How mitochondria produce
reactive oxygen species, Biochem. J., 417, 1-13.
12.Murphy, M. P. (2014) Antioxidants as therapies:
can we improve on nature? Free Radic. Biol. Med., 66,
20-23.
13.Skulachev, V. P. (2013) Cationic antioxidants as
a powerful tool against mitochondrial oxidative stress, Biochem.
Biophys. Res. Commun., 44, 275-279.
14.Zorov, D. B., Juhaszova, M., and Sollott, S. J.
(2014) Mitochondrial reactive oxygen species (ROS) and ROS-induced ROS
release, Physiol. Rev., 94, 909-950.
15.Starkov, A. A. (2008) The role of mitochondria in
reactive oxygen species metabolism and signaling, Ann. NY Acad.
Sci., 1147, 37-52.
16.Boveris, A., and Chance, B. (1973) The
mitochondrial generation of hydrogen peroxide. General properties and
effect of hyperbaric oxygen, Biochem. J., 134,
707-716.
17.Kareyeva, A. V., Grivennikova, V. G., and
Vinogradov, A. D. (2012) Mitochondrial hydrogen peroxide production as
determined by the pyridine nucleotide pool and its redox state,
Biochim. Biophys. Acta, 1817, 1879-1885.
18.Kussmaul, L., and Hirst, J. (2006) The mechanism
of superoxide production by NADH:ubiquinone oxidoreductase (complex I)
from bovine heart mitochondria, Proc. Natl. Acad. Sci. USA,
103, 7607-7612.
19.Vinogradov, A. D., and Grivennikova, V. G. (2005)
Generation of superoxide-radical by the NADH:ubiquinone oxidoreductase
of heart mitochondria, Biochemistry (Moscow), 70,
120-127.
20.Hoffman, D. L., and Brookes, P. S. (2009) Oxygen
sensitivity of mitochondrial reactive oxygen species generation depends
on metabolic conditions, J. Biol. Chem., 284,
16236-16245.
21.Hoffman, D. L., Salter, J. D., and Brookes, P. S.
(2007) Response of mitochondrial reactive oxygen species generation to
steady-state oxygen tension: implications for hypoxic cell signaling,
Am. J. Physiol. Heart Circ. Physiol., 292, H101-108.
22.Grivennikova, V. G., and Vinogradov, A. D. (2013)
Partitioning of superoxide and hydrogen peroxide production by
mitochondrial respiratory complex I, Biochim. Biophys. Acta,
1827, 446-454.
23.Brown, G. C., and Borutaite, V. (2012) There is
no evidence that mitochondria are the main source of reactive oxygen
species in mammalian cells, Mitochondrion, 12, 1-4.
24.Starkov, A. A., Andreyev, A. Y., Zhang, S. F.,
Starkova, N. N., Korneeva, M., Syromyatnikov, M., and Popov, V. N.
(2014) Scavenging of H2O2 by mouse brain
mitochondria, J. Bioenerg. Biomembr., 46, 471-477.
25.Chouchani, E. T., Pell, V. R., Gaude, E.,
Aksentijevic, D., Sundier, S. Y., Robb, E. L., Logan, A., Nadtochiy, S.
M., Ord, E. N., Smith, A. C., Eyassu, F., Shirley, R., Hu, C. H., Dare,
A. J., James, A. M., Rogatti, S., Hartley, R. C., Eaton, S., Costa, A.
S., Brookes, P. S., Davidson, S. M., Duchen, M. R., Saeb-Parsy, K.,
Shattock, M. J., Robinson, A. J., Work, L. M., Frezza, C., Krieg, T.,
and Murphy, M. P. (2014) Ischaemic accumulation of succinate controls
reperfusion injury through mitochondrial ROS, Nature,
515, 431-435.
26.Kushnareva, Y., Murphy, A. N., and Andreyev, A.
(2002) Complex I-mediated reactive oxygen species generation:
modulation by cytochrome c and NAD(P)+
oxidation-reduction state, Biochem. J., 368 (Pt. 2),
545-553.
27.Ambrus, A., and Adam-Vizi, V. (2013) Molecular
dynamics study of the structural basis of dysfunction and the
modulation of reactive oxygen species generation by pathogenic mutants
of human dihydrolipoamide dehydrogenase, Arch. Biochem.
Biophys., 538, 145-155.
28.Ambrus, A., Tretter, L., and Adam-Vizi, V. (2009)
Inhibition of the alpha-ketoglutarate dehydrogenase-mediated reactive
oxygen species generation by lipoic acid, J. Neurochem., 109
(Suppl. 1), 222-229.
29.Kareyeva, A. V., Grivennikova, V. G., Cecchini,
G., and Vinogradov, A. D. (2011) Molecular identification of the enzyme
responsible for the mitochondrial NADH-supported ammonium-dependent
hydrogen peroxide production, FEBS Lett., 585,
385-389.
30.Quinlan, C. L., Goncalves, R. L., Hey-Mogensen,
M., Yadava, N., Bunik, V. I., and Brand, M. D. (2014) The 2-oxoacid
dehydrogenase complexes in mitochondria can produce superoxide/hydrogen
peroxide at much higher rates than complex I, J. Biol. Chem.,
289, 8312-8325.
31.Starkov, A. A., Fiskum, G., Chinopoulos, C.,
Lorenzo, B. J., Browne, S. E., Patel, M. S., and Beal, M. F. (2004)
Mitochondrial alpha-ketoglutarate dehydrogenase complex generates
reactive oxygen species, J. Neurosci., 24, 7779-7788.
32.Tahara, E. B., Barros, M. H., Oliveira, G. A.,
Netto, L. E., and Kowaltowski, A. J. (2007) Dihydrolipoyl dehydrogenase
as a source of reactive oxygen species inhibited by caloric restriction
and involved in Saccharomyces cerevisiae aging, FASEB J.,
21, 274-283.
33.Tretter, L., and Adam-Vizi, V. (2004) Generation
of reactive oxygen species in the reaction catalyzed by
alpha-ketoglutarate dehydrogenase, J. Neurosci., 24,
7771-7778.
34.Zundorf, G., Kahlert, S., Bunik, V. I., and
Reiser, G. (2009) α-Ketoglutarate dehydrogenase contributes to
production of reactive oxygen species in glutamate-stimulated
hippocampal neurons in situ, Neuroscience, 158,
610-616.
35.Pryde, K. R., and Hirst, J. (2011) Superoxide is
produced by the reduced flavin in mitochondrial complex I: a single,
unified mechanism that applies during both forward and reverse electron
transfer, J. Biol. Chem., 286, 18056-18065.
36.Treberg, J. R., Quinlan, C. L., and Brand, M. D.
(2011) Evidence for two sites of superoxide production by mitochondrial
NADH-ubiquinone oxidoreductase (complex I), J. Biol. Chem.,
286, 27103-27110.
37.Ohnishi, S. T., Shinzawa-Itoh, K., Ohta, K.,
Yoshikawa, S., and Ohnishi, T. (2010) New insights into the superoxide
generation sites in bovine heart NADH-ubiquinone oxidoreductase
(complex I): the significance of protein-associated ubiquinone and the
dynamic shifting of generation sites between semiflavin and semiquinone
radicals, Biochim. Biophys. Acta, 1797, 1901-1909.
38.Sled, V. D., Rudnitzky, N. I., Hatefi, Y., and
Ohnishi, T. (1994) Thermodynamic analysis of flavin in mitochondrial
NADH:ubiquinone oxidoreductase (complex I), Biochemistry,
33, 10069-10075.
39.Ohnishi, T. (1975) Thermodynamic and EPR
characterization of iron-sulfur centers in the NADH-ubiquinone segment
of the mitochondrial respiratory chain in pigeon heart, Biochim.
Biophys. Acta, 387, 475-490.
40.Ohnishi, T. (1998) Iron-sulfur
clusters/semiquinones in complex I, Biochim. Biophys. Acta,
1364, 186-206.
41.Ksenzenko, M., Konstantinov, A. A., Khomutov, G.
B., Tikhonov, A. N., and Ruuge, E. K. (1983) Effect of electron
transfer inhibitors on superoxide generation in the cytochrome
bc1 site of the mitochondrial respiratory chain,
FEBS Lett., 155, 19-24.
42.McLennan, H. R., and Degli Esposti, M. (2000) The
contribution of mitochondrial respiratory complexes to the production
of reactive oxygen species, J. Bioenerg. Biomembr., 32,
153-162.
43.Ohnishi, T., and Trumpower, B. L. (1980)
Differential effects of antimycin on ubisemiquinone bound in different
environments in isolated succinate:cytochrome c reductase
complex, J. Biol. Chem., 255, 3278-3284.
44.Quinlan, C. L., Orr, A. L., Perevoshchikova, I.
V., Treberg, J. R., Ackrell, B. A., and Brand, M. D. (2012)
Mitochondrial complex II can generate reactive oxygen species at high
rates in both the forward and reverse reactions, J. Biol. Chem.,
287, 27255-27264.
45.Siebels, I., and Drose, S. (2013) Q-site
inhibitor induced ROS production of mitochondrial complex II is
attenuated by TCA cycle dicarboxylates, Biochim. Biophys. Acta,
1827, 1156-1164.
46.Miyadera, H., Shiomi, K., Ui, H., Yamaguchi, Y.,
Masuma, R., Tomoda, H., Miyoshi, H., Osanai, A., Kita, K., and Omura,
S. (2003) Atpenins, potent and specific inhibitors of mitochondrial
complex II (succinate-ubiquinone oxidoreductase), Proc. Natl. Acad.
Sci. USA, 100, 473-477.
47.St-Pierre, J., Buckingham, J. A., Roebuck, S. J.,
and Brand, M. D. (2002) Topology of superoxide production from
different sites in the mitochondrial electron transport chain, J.
Biol. Chem., 277, 44784-44790.
48.Mills, E., and O’Neill, L. A. (2014)
Succinate: a metabolic signal in inflammation, Trends Cell
Biol., 24, 313-320.
49.Forman, H. J., and Kennedy, J. A. (1974) Role of
superoxide radical in mitochondrial dehydrogenase reactions,
Biochem. Biophys. Res. Commun., 60, 1044-1050.
50.Forman, H. J., and Kennedy, J. (1975) Superoxide
production and electron transport in mitochondrial oxidation of
dihydroorotic acid, J. Biol. Chem., 250, 4322-4326.
51.Dileepan, K. N., and Kennedy, J. (1985) Complete
inhibition of dihydro-orotate oxidation and superoxide production by
1,1,1-trifluoro-3-thenoylacetone in rat liver mitochondria, Biochem.
J., 225, 189-194.
52.Lakaschus, G., and Loffler, M. (1992)
Differential susceptibility of dihydroorotate dehydrogenase/oxidase to
brequinar sodium (NSC 368 390) in vitro, Biochem.
Pharmacol., 43, 1025-1030.
53.Loffler, M., Becker, C., Wegerle, E., and
Schuster, G. (1996) Catalytic enzyme histochemistry and biochemical
analysis of dihydroorotate dehydrogenase/oxidase and succinate
dehydrogenase in mammalian tissues, cells and mitochondria,
Histochem. Cell Biol., 105, 119-128.
54.Hey-Mogensen, M., Goncalves, R. L., Orr, A. L.,
and Brand, M. D. (2014) Production of
superoxide/H2O2 by dihydroorotate dehydrogenase
in rat skeletal muscle mitochondria, Free Radic. Biol. Med.,
72, 149-155.
55.Hail, N., Jr., Chen, P., Kepa, J. J., Bushman, L.
R., and Shearn, C. (2010) Dihydroorotate dehydrogenase is required for
N-(4-hydroxyphenyl)retinamide-induced reactive oxygen species
production and apoptosis, Free Radic. Biol. Med., 49,
109-116.
56.Pinton, P., Rimessi, A., Marchi, S., Orsini, F.,
Migliaccio, E., Giorgio, M., Contursi, C., Minucci, S., Mantovani, F.,
Wieckowski, M. R., Del Sal, G., Pelicci, P. G., and Rizzuto, R. (2007)
Protein kinase Cβ and prolyl isomerase 1 regulate mitochondrial
effects of the life-span determinant p66Shc, Science,
315, 659-663.
57.Giorgio, M., Migliaccio, E., Orsini, F.,
Paolucci, D., Moroni, M., Contursi, C., Pelliccia, G., Luzi, L.,
Minucci, S., Marcaccio, M., Pinton, P., Rizzuto, R., Bernardi, P.,
Paolucci, F., and Pelicci, P. G. (2005) Electron transfer between
cytochrome c and p66Shc generates reactive oxygen species that
trigger mitochondrial apoptosis, Cell, 122, 221-233.
58.Gertz, M., Fischer, F., Leipelt, M., Wolters, D.,
and Steegborn, C. (2009) Identification of peroxiredoxin 1 as a novel
interaction partner for the lifespan regulator protein p66Shc,
Aging (Albany NY), 1, 254-265.
59.Banus, M. G. (1941) A design for a saturated
calomel electrode, Science, 93, 601-602.
60.Zhen, Y., Hoganson, C. W., Babcock, G. T., and
Ferguson-Miller, S. (1999) Definition of the interaction domain for
cytochrome c on cytochrome c oxidase. I. Biochemical,
spectral, and kinetic characterization of surface mutants in subunit ii
of Rhodobacter sphaeroides cytochrome aa3,
J. Biol. Chem., 274, 38032-38041.
61.Gertz, M., and Steegborn, C. (2010) The
lifespan-regulator p66Shc in mitochondria: redox enzyme or redox
sensor? Antioxid. Redox Signal., 13, 1417-1428.
62.Galimov, E. R. (2010) The role of p66shc in
oxidative stress and apoptosis, Acta Naturae, 2,
44-51.
63.Galimov, E. R., Chernyak, B. V., Sidorenko, A.
S., Tereshkova, A. V., and Chumakov, P. M. (2014) Prooxidant properties
of p66shc are mediated by mitochondria in human cells, PLoS One,
9, e86521.
64.Vogel, R., Wiesinger, H., Hamprecht, B., and
Dringen, R. (1999) The regeneration of reduced glutathione in rat
forebrain mitochondria identifies metabolic pathways providing the
NADPH required, Neurosci. Lett., 275, 97-100.
65.Lopert, P., and Patel, M. (2014) Nicotinamide
nucleotide transhydrogenase (Nnt) links the substrate requirement in
brain mitochondria for hydrogen peroxide removal to the
thioredoxin/peroxiredoxin (Trx/Prx) system, J. Biol. Chem.,
289, 15611-15620.
66.Freeman, H. C., Hugill, A., Dear, N. T.,
Ashcroft, F. M., and Cox, R. D. (2006) Deletion of nicotinamide
nucleotide transhydrogenase: a new quantitative trait locus accounting
for glucose intolerance in C57BL/6J mice, Diabetes, 55,
2153-2156.
67.Huang, T. T., Naeemuddin, M., Elchuri, S.,
Yamaguchi, M., Kozy, H. M., Carlson, E. J., and Epstein, C. J. (2006)
Genetic modifiers of the phenotype of mice deficient in mitochondrial
superoxide dismutase, Hum. Mol. Genet., 15,
1187-1194.
68.Chen, Y., Zhang, J., Lin, Y., Lei, Q., Guan, K.
L., Zhao, S., and Xiong, Y. (2011) Tumor suppressor SIRT3 deacetylates
and activates manganese superoxide dismutase to scavenge ROS, EMBO
Rep., 12, 534-541.
69.Tao, R., Coleman, M. C., Pennington, J. D.,
Ozden, O., Park, S. H., Jiang, H., Kim, H. S., Flynn, C. R., Hill, S.,
Hayes McDonald, W., Olivier, A. K., Spitz, D. R., and Gius, D. (2010)
Sirt3-mediated deacetylation of evolutionarily conserved lysine 122
regulates MnSOD activity in response to stress, Mol. Cell,
40, 893-904.
70.Tao, R., Vassilopoulos, A., Parisiadou, L., Yan,
Y., and Gius, D. (2014) Regulation of MnSOD enzymatic activity by Sirt3
connects the mitochondrial acetylome signaling networks to aging and
carcinogenesis, Antioxid. Redox Signal., 20,
1646-1654.
71.Radi, R., Turrens, J. F., Chang, L. Y., Bush, K.
M., Crapo, J. D., and Freeman, B. A. (1991) Detection of catalase in
rat heart mitochondria, J. Biol. Chem., 266,
22028-22034.
72.Salvi, M., Battaglia, V., Brunati, A. M., La
Rocca, N., Tibaldi, E., Pietrangeli, P., Marcocci, L., Mondovi, B.,
Rossi, C. A., and Toninello, A. (2007) Catalase takes part in rat liver
mitochondria oxidative stress defense, J. Biol. Chem.,
282, 24407-24415.
73.Cadenas, E. (2004) Mitochondrial free radical
production and cell signaling, Mol. Aspects Med., 25,
17-26.
74.Cox, A. G., Winterbourn, C. C., and Hampton, M.
B. (2010) Mitochondrial peroxiredoxin involvement in antioxidant
defense and redox signaling, Biochem. J., 425,
313-325.
75.Drechsel, D. A., and Patel, M. (2010)
Respiration-dependent H2O2 removal in brain
mitochondria via the thioredoxin/peroxiredoxin system, J. Biol.
Chem., 285, 27850-27858.
76.Ho, Y. S., Magnenat, J. L., Bronson, R. T., Cao,
J., Gargano, M., Sugawara, M., and Funk, C. D. (1997) Mice deficient in
cellular glutathione peroxidase develop normally and show no increased
sensitivity to hyperoxia, J. Biol. Chem., 272,
16644-16651.
77.Cao, Z., Bhella, D., and Lindsay, J. G. (2007)
Reconstitution of the mitochondrial PrxIII antioxidant defense pathway:
general properties and factors affecting PrxIII activity and oligomeric
state, J. Mol. Biol., 372, 1022-1033.
78.Trujillo, M., Clippe, A., Manta, B.,
Ferrer-Sueta, G., Smeets, A., Declercq, J. P., Knoops, B., and Radi, R.
(2007) Pre-steady state kinetic characterization of human peroxiredoxin
5: taking advantage of Trp84 fluorescence increase upon oxidation,
Arch. Biochem. Biophys., 467, 95-106.
79.Starkov, A. A. (2014) Measuring mitochondrial
reactive oxygen species (ROS) production, in Systems Biology of Free
Radicals and Antioxidants (Laher, I., ed.) Springer,
Berlin-Heidelberg, pp. 265-278.
80.Starkov, A. A. (2010) Measurement of
mitochondrial ROS production, Methods Mol. Biol., 648,
245-255.
81.Zhou, M., Diwu, Z., Panchuk-Voloshina, N., and
Haugland, R. P. (1997) A stable nonfluorescent derivative of resorufin
for the fluorometric determination of trace hydrogen peroxide:
applications in detecting the activity of phagocyte NADPH oxidase and
other oxidases, Anal. Biochem., 253, 162-168.
82.Cathcart, R., Schwiers, E., and Ames, B. N.
(1983) Detection of picomole levels of hydroperoxides using a
fluorescent dichlorofluorescein assay, Anal. Biochem.,
134, 111-116.
83.LeBel, C. P., Ischiropoulos, H., and Bondy, S. C.
(1992) Evaluation of the probe 2′,7′-dichlorofluorescin as
an indicator of reactive oxygen species formation and oxidative stress,
Chem. Res. Toxicol., 5, 227-231.
84.Brandt, R., and Keston, A. S. (1965) Synthesis of
diacetyldichlorofluorescin: a stable reagent for fluorometric analysis,
Anal. Biochem., 11, 6-9.
85.Keston, A. S., and Brandt, R. (1965) The
fluorometric analysis of ultramicro quantities of hydrogen peroxide,
Anal. Biochem., 11, 1-5.
86.Black, M. J., and Brandt, R. B. (1974)
Spectrofluorometric analysis of hydrogen peroxide, Anal.
Biochem., 58, 246-254.
87.Zheng, M., Aslund, F., and Storz, G. (1998)
Activation of the OxyR transcription factor by reversible disulfide
bond formation, Science, 279, 1718-1721.
88.Choi, H., Kim, S., Mukhopadhyay, P., Cho, S.,
Woo, J., Storz, G., and Ryu, S. E. (2001) Structural basis of the redox
switch in the OxyR transcription factor, Cell, 105,
103-113.
89.Aslund, F., Zheng, M., Beckwith, J., and Storz,
G. (1999) Regulation of the OxyR transcription factor by hydrogen
peroxide and the cellular thiol-disulfide status, Proc. Natl. Acad.
Sci. USA, 96, 6161-6165.
90.Lee, C., Lee, S. M., Mukhopadhyay, P., Kim, S.
J., Lee, S. C., Ahn, W. S., Yu, M. H., Storz, G., and Ryu, S. E. (2004)
Redox regulation of OxyR requires specific disulfide bond formation
involving a rapid kinetic reaction path, Nat. Struct. Mol.
Biol., 11, 1179-1185.
91.Belousov, V. V., Fradkov, A. F., Lukyanov, K. A.,
Staroverov, D. B., Shakhbazov, K. S., Terskikh, A. V., and Lukyanov, S.
(2006) Genetically encoded fluorescent indicator for intracellular
hydrogen peroxide, Nat. Methods, 3, 281-286.
92.Bilan, D. S., Pase, L., Joosen, L.,
Gorokhovatsky, A. Y., Ermakova, Y. G., Gadella, T. W., Grabher, C.,
Schultz, C., Lukyanov, S., and Belousov, V. V. (2013) HyPer-3: a
genetically encoded H2O2 probe with improved
performance for ratiometric and fluorescence lifetime imaging, ACS
Chem. Biol., 8, 535-542.
93.Malinouski, M., Zhou, Y., Belousov, V. V.,
Hatfield, D. L., and Gladyshev, V. N. (2011) Hydrogen peroxide probes
directed to different cellular compartments, PLoS One, 6,
e14564.
94.Mishina, N. M., Tyurin-Kuzmin, P. A.,
Markvicheva, K. N., Vorotnikov, A. V., Tkachuk, V. A., Laketa, V.,
Schultz, C., Lukyanov, S., and Belousov, V. V. (2011) Does cellular
hydrogen peroxide diffuse or act locally? Antioxid. Redox
Signal., 14, 1-7.
95.Markvicheva, K. N., Bilan, D. S., Mishina, N. M.,
Gorokhovatsky, A. Y., Vinokurov, L. M., Lukyanov, S., and Belousov, V.
V. (2011) A genetically encoded sensor for H2O2
with expanded dynamic range, Bioorg. Med. Chem., 19,
1079-1084.
96.Ermakova, Y. G., Bilan, D. S., Matlashov, M. E.,
Mishina, N. M., Markvicheva, K. N., Subach, O. M., Subach, F. V.,
Bogeski, I., Hoth, M., Enikolopov, G., and Belousov, V. V. (2014) Red
fluorescent genetically encoded indicator for intracellular hydrogen
peroxide, Nat. Commun., 5, 5222.
97.Costa, A., Drago, I., Behera, S., Zottini, M.,
Pizzo, P., Schroeder, J. I., Pozzan, T., and Lo Schiavo, F. (2010)
H2O2 in plant peroxisomes: an in vivo
analysis uncovers a Ca2+-dependent scavenging system,
Plant J., 62, 760-772.
98.Elsner, M., Gehrmann, W., and Lenzen, S. (2011)
Peroxisome-generated hydrogen peroxide as important mediator of
lipotoxicity in insulin-producing cells, Diabetes, 60,
200-208.
99.Brejc, K., Sixma, T. K., Kitts, P. A., Kain, S.
R., Tsien, R. Y., Ormo, M., and Remington, S. J. (1997) Structural
basis for dual excitation and photoisomerization of the Aequorea
victoria green fluorescent protein, Proc. Natl. Acad. Sci.
USA, 94, 2306-2311.
100.Elsliger, M. A., Wachter, R. M., Hanson, G. T.,
Kallio, K., and Remington, S. J. (1999) Structural and spectral
response of green fluorescent protein variants to changes in pH,
Biochemistry, 38, 5296-5301.
101.Hanson, G. T., McAnaney, T. B., Park, E. S.,
Rendell, M. E., Yarbrough, D. K., Chu, S., Xi, L., Boxer, S. G.,
Montrose, M. H., and Remington, S. J. (2002) Green fluorescent protein
variants as ratiometric dual emission pH sensors. 1. Structural
characterization and preliminary application, Biochemistry,
41, 15477-15488.