Effect of Light Intensity under Different Photoperiods on Expression Level of Carbonic Anhydrase Genes of the α- and β-Families in Arabidopsis thaliana Leaves
N. N. Rudenko, D. V. Vetoshkina, T. P. Fedorchuk, and B. N. Ivanov*
Institute of Basic Biological Problems, Russian Academy of Sciences, 142290 Pushchino, Moscow Region, Russia; E-mail: ivboni@rambler.ru* To whom correspondence should be addressed.
Received May 22, 2017; Revision received June 13, 2017
Changes in expression levels of genes encoding carbonic anhydrases α-CA1, α-CA2, α-CA4, β-CA1, β-CA2, β-CA3, β-CA4, β-CA5, and β-CA6 in Arabidopsis thaliana leaves after light increase from 80 to 400 µmol PAR quanta·m−2·s−1 were investigated under short day (8 h) and long day (16 h) photoperiods. The expression of two forms of the gene, At3g01500.2 and At3g01500.3, encoding the most abundant carbonic anhydrase of leaves, β-CA1, situated in chloroplast stroma, was found. The content of At3g01500.3 transcripts was higher by approximately an order of magnitude compared to the content of At3g01500.2 transcripts. When plants were adapted to high light intensity under short day photoperiod, the expression level of both forms increased, whereas under long day photoperiod, the content of At3g01500.3 transcripts increased, and the content of transcripts of At3g01500.2 decreased. The expression levels of the At3g01500.3 gene and of genes encoding chloroplast carbonic anhydrases α-CA1, α-CA4, α-CA2 and cytoplasmic carbonic anhydrase β-CA2 increased significantly in response to increase in light intensity under short day, and these of the first three genes increased under long day as well. The expression level of the gene encoding α-CA2 under long day photoperiod as well as of genes of chloroplast β-CA5 and β-CA4 from plasma membranes and mitochondrial β-CA6 under both photoperiods depended insignificantly on light intensity. Hypotheses about the roles in higher plant metabolism of the studied carbonic anhydrases are discussed considering the effects of light intensity on expression levels of the correspondent genes.
KEY WORDS: photosynthesis, Arabidopsis, light intensity, photoperiod, gene expression, carbonic anhydrase, chloroplastsDOI: 10.1134/S000629791709005X
Abbreviations: CA, carbonic anhydrase; Chl, chlorophyll; HL, high light (light of high intensity); LL, low light (light of low intensity); PAR, photosynthetically active radiation; PSII, photosystem II; Rubisco, ribulose-bisphosphate-carboxylase/oxygenase.
Nineteen genes encoding carbonic anhydrases (CA) belonging to three
families, α, β, and γ [1], out of
six families known to date, have been found in the Arabidopsis
thaliana genome [2]. All five carbonic
anhydrases of the γ-family were found in mitochondria as part of
the so-called CA domain located on the inner surface of the
mitochondrial membrane [3]. The CAs of the
β-family were found in different parts of the cell: β-CA1 and
β-CA5 in chloroplasts, β-CA2 and β-CA3 in cytoplasm,
β-CA4 in cell membrane, β-CA6 in mitochondria (nomenclature
proposed by Fabre et al. is used [1]). The product
of the At4g20990 gene encoding α-CA4 was found using
proteome analysis of thylakoid membrane proteins [4]. Another CA of this family, α-CA1, was found
in chloroplast stroma [5]. The expression of the
gene encoding α-CA3 is detected in flowers and pods, and
α-CA2 in is detected in roots, stems, and leaves of
Arabidopsis [1]. In an article by Zhurikova
et al. [6], evidence of α-CA2 functioning in
the thylakoid membranes was presented.
The components of the reversible hydration reaction of carbon dioxide, CO2 + H2O ↔ HCO3− + H+, are involved in virtually all metabolic processes, and although the participation of CA in the catalysis of this reaction in several processes is assumed, it is not reliably established. For the most abundant CA in leaves, β-CA1 located in the stroma of chloroplasts, the most rational assumption about its function was its participation in the acceleration of the conversion of bicarbonate to CO2, the substrate of ribulose-bisphosphate-carboxylase/oxygenase (Rubisco). However, in transgenic plants, where the expression of the CA gene was suppressed by 99% using antisense sequence, no significant changes in the rate of photosynthesis were observed [7]. It was hypothesized that another stromal CA, α-CA1, participated in the delivery of CO2 to Rubisco [8]. Studies of the carbonic anhydrase activity of thylakoid membranes and their fragments have led to the assumption that CAs can participate in many reactions there [9], but these CAs have not been identified. Many observations indicate that CAs can play a role in the plant’s system of stress protection [10, 11].
One approach to clarifying the functions of enzymes in plant metabolism is to study the dependence of their content and the expression of the genes encoding them on the intensity of light. Changes in illumination cause significant rearrangements in plants, primarily in the structure and activity of the photosynthetic apparatus: as illumination increases, the content of the components of the photosynthetic electron transport chain, ATP synthase [12], and Rubisco [13] increases, and the size of the Photosystem II (PSII) antenna decreases [14]. An important factor affecting the metabolism of plants is the duration of daylight (photoperiod). In addition to changing the active time of the photosynthetic apparatus during the day, the photoperiod is important for inducing the transition of plants to the flowering phase. This transition is accompanied by activation or inhibition of many processes in plants, including changes in gene expression [15]. In Eurasia, which is the native area for A. thaliana, the duration of daylight during the growing season is 14-20 h, and flowering is induced when plants stay in the light for 12 h or more during the day [16].
In this report, we show how the expression levels of nine CA genes are correlated and how they change in response to increased light intensity under “long” and “short” day conditions. The conditions of the “long” day, 16 h day/8 h night, are close to natural, and the “short” day, 8 h day/16 h night conditions, artificially created in a climate chamber, are usually used to study the long-term adaptation of plants to various external factors because it maintains Arabidopsis in the vegetative state for several weeks.
MATERIALS AND METHODS
Growing conditions. Wild-type A. thaliana plants, ecotype Columbia, were grown in heat-treated generic soil, trademark “Generous earth”, in a climate chamber. The scheme of cultivation is shown in Fig. 1. Eighteen days after sowing the seeds, at the stage of 2-3 true leaves, the plants were transplanted into separate containers filled with fresh soil mixture (replanting). After 21 days of growing the plants at 450 ppm CO2 concentration in air, 19°C temperature, and light intensity of 80 µmol PAR quanta·m−2·s−1 (low light, LL) at 8 h day/16 h night cycle (“short” day), one fourth of the plants were left under these conditions, and one fourth was transferred to light with intensity of 400 µmol PAR quanta·m−2·s−1 (high light, HL) while maintaining the “short” day. The remaining plants were placed under 16 h day/8 h night cycle (“long” day) while LL was preserved, and 10 days after adaptation to this photoperiod, half of these plants were left in such conditions, and the other half was transferred to HL while retaining “long” day. When studying the effect of plant illumination on the transcription of the carbonic anhydrase genes in leaves, the day of moving plants from LL to HL was considered as the beginning of the experiment under both “short” and “long” day conditions (i.e. “zero” day, see “Results and Discussion”). Measurements for the “short” day plants were carried out for 14 days, and for the “long” day plants – within 7 days after placing the plants under light of different intensity, because after a total of 17 days of growing in the “long” day the plants entered the generation phase.
Fig. 1. Scheme of cultivation of Arabidopsis plants during experiments on the influence of the intensity of the illumination on the expression of CA genes under different photoperiod conditions. Conditions of “short” day (indicated by light gray): 8 h day/16 h night; conditions of “long” day (indicated in dark gray): 16 h day/8 h night. LL (low light), light intensity 80 µmol PAR quanta·m−2·s−1; HL (high light), light intensity 400 µmol PAR quanta·m−2·s−1.
Measurement of fluorescence characteristics of chlorophyll (Chl) a in leaves. Prior to measurements, the plants were kept in the dark for 30 min; fluorescence was measured with a Walz Mini-PAM fluorometer (Germany). The effective quantum yield of PSII under illumination:
Y = (Fm′ – Fs)/Fm′,
and the coefficient of nonphotochemical quenching of Chl a fluorescence:
qN = (Fm – Fm′)/(Fm – F0′),
were measured; Fm – the maximum yield of Chl a fluorescence in the dark-adapted leaves in response to a flash of saturating light, Fs – the fluorescence yield under actinic light, Fm′ – the maximum value of the fluorescence yield in response to a flash of saturating light during actinic light illumination, and F0′ – the minimum level of fluorescence after illumination. Relaxation of nonphotochemical quenching of Chl a fluorescence from the moment of switching off the light to the third minute in the dark (qN3) was calculated as:
qN3 = (Fm3 – Fm′)/(Fm – F0′),
and relaxation to the 15th min of darkness as:
qI = (Fm – Fm15)/(Fm – F0′);
Fm3 and Fm15 – the fluorescence yield values in response to saturation light flashes delivered 3 and 15 min after the light was turned off, respectively. The photosynthetic active radiation (PAR) was measured with an LI-190SA Quantum Sensor, which is sensitive in the 400-700 nm wavelength range.
Measurement of protein content of light-harvesting complex of PSII. Isolation of thylakoids and determination of the chlorophyll content in them were carried out as described in Ignatova et al. [17]. Electrophoresis under denaturing conditions was carried out using the Shagger and Von Yago method [18] in a Protean II xi Cell (Bio-Rad, USA). Protein bands were visualized with Coomassie dye. The position of proteins Lhcb3 and Lhcb6 was determined in the gel after electrophoresis under denaturing conditions [19]. Western blotting with antibodies to Lhcb1 and Lhcb2 was carried out on nitrocellulose membranes by the method of Onda et al. [20]. Densitometric analysis of protein bands was performed using the gel-documenting system “Gel Doc System” (Bio-Rad) and Gel-Pro Analyzer 3.1 software.
Conventional PCR. RNA was isolated using the Aurum total RNA Mini Kit (Bio-Rad) from leaves previously frozen in liquid nitrogen. Reverse transcription was performed using the iScript Reverse Transcription Supermix reagent kit (Bio-Rad). The resulting cDNAs and specific primers to the CA genes (Table 1), designed in such a way that at least one primer from the pair is complementary to the terminal sequences of the two exons, were used in PCR, followed by electrophoresis in 1% agarose gel with 89 mM Tris borate buffer in the presence of 20 mM EDTA and ethidium bromide as an intercalating agent. The 2-Log DNA Ladder 100-3000 bp (New England Biolabs, USA) was used as size markers.
Table 1. Primers used for quantitative and
conventional polymerase chain reaction. F is the “forward”
and R is the “reverse” primer
Quantitative PCR. Quantitative PCR (qPCR) was carried out using an iQ5 Bio-Rad instrument with Evrogen reagents (Russia) in three biological and two statistical samples using leaves from three individual plants. The data were normalized to the actin 7 gene At5g09810 and calculated as 2−ΔCT.
RESULTS AND DISCUSSION
Characteristics of plants. Arabidopsis is a shade tolerant plant, thus the optimal light intensity for it is about 150 µmol PAR quanta·m−2·s−1 [21]; therefore, we designated the light intensities of 80 and 400 µmol PAR quanta·m−2·s−1 as LL and HL, respectively (see “Materials and Methods”). It is known that, when adapting to high light, the size of the light-harvesting complex of PSII decreases due to a decrease in the amounts of Lhcb1, Lhcb2, Lhcb3, and Lhcb6 proteins [22]. The data in Table 2 show that during 14 days in the plants of the “short” day, and during 5 days in the plants of the “long” day, there was a marked decrease in the content of these proteins in the leaves, which indicated the adequacy of the selected periods of adaptation of the photosynthetic apparatus to HL in various photoperiod conditions.
Table 2. Effect of light intensity on
content of proteins of light-harvesting complex of PSII in leaves of
Arabidopsis plants under conditions of “short”
(8 h day/16 h night) or “long” day (16 h
day/8 h night)
Note: Measurements with “short day” plants were carried out
after 14 days, and with “long day” plants – 5 days
after transfer of plants adapted to corresponding photoperiod, from
low-intensity light (80 µmol PAR
quanta·m−2·s−1) to
high-intensity light (400 µmol PAR
quanta·m−2·s−1).
Average values of five experiments are given ± standard error of
the mean. Differences between values at high and low light intensities
are statistically significant (p < 0.01).
Characteristics of the photosynthetic apparatus by measuring fluorescence of Chl a in leaves of plants growing at low or high light intensity were compared at the same light intensity at the end of the periods of plant adaptation to HL, i.e. after 14 days of parallel growth at both light intensities under “short day” conditions, and after 5 days – under “long day” conditions (Table 3). The effective quantum yield of PSII by this time was lower in plants under HL than in plants under LL, and the coefficient qN, characterizing nonphotochemical quenching of Chl a fluorescence, was higher. It is significant that the value of the quantum yield achieved during this period was higher, and the value of qN is lower than these values in the first days after the transfer of plants to HL (not shown), which, according to the data of Borisova-Mubarakshina et al. [23], reflects the adaptation that has taken place. We found that the difference in the nonphotochemical quenching under light of different intensities is due to processes that can be characterized by the parameter qN3 (Table 3), the rapidly relaxing component of the nonphotochemical quenching, which depends on protonation of the PsbS protein [24]. In the “short day” plants, increase in illumination leads to a greater increase in qN3 than in the “long day” plants, and this indicates a difference in the effect of the intensity of light for different daytime durations.
Table 3. Effect of light intensity on
parameters of Chl a fluorescence of Arabidopsis leaves
under conditions of “short day” (8 h day/16 h
night) or “long day” (16 h day/8 h night)
Note: Measurements with “short day” plants were carried out
in 14 days, and with “long day” plants – in 5 days
after moving the plants adapted to the corresponding photoperiod in low
light into high light. Measurements were carried out at saturating
concentration of CO2 (700 ppm) and intensity of light at
which the plants grew. The mean ± standard error of the mean is
presented. * Statistically significant differences between values under
different light intensity and same day length (p < 0.01).
Despite the adaptation to HL, the coefficient qI in plants under HL was higher than in plants under LL in both “long day” and “short day” conditions, which shows that photoinhibition of PSII was higher in plants under HL.
Expression of genes encoding CAs. Although the protein content in the plant does not always directly correlate with the content of the transcripts of the corresponding genes, the approach based on measuring the level of transcription when changing the plant’s living conditions is most convenient in the study of CAs, since the determination of the content of these proteins by Western blot analysis in leaves of higher plants is difficult due to the similarity of the amino acid sequences of representative proteins within one family of CAs. The construction of primers, sufficiently short DNA fragments used to measure the expression level of genes by the qPCR method, makes it possible to select specific sequences for each gene that do not occur in the genes of other CAs, and to determine the relative levels of expression of the genes of all CAs.
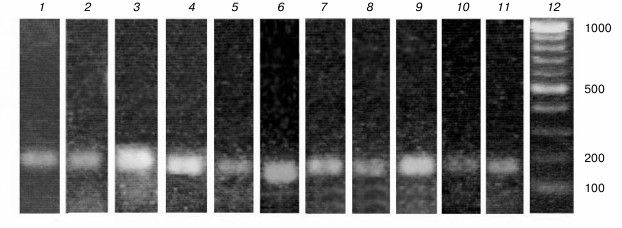
Primers for the At3g01500 gene encoding β-CA1, the most abundant CA of the plant cell located in the chloroplast stroma, were selected while considering the possible alternative splicing of this gene at the 3′-end: the last two exons can be spliced during transcription with excision of the last intron (At3g01500.2), or the last intron can serve as the untranslated region of the exon (At3g01500.3) (Fig. 2). We designed primers complementary to both forms of the gene (designated by us as β-ca1a and β-ca1b, respectively), and for the first time it was shown that both forms of this gene are expressed in the leaves of Arabidopsis (Fig. 3, lanes 1 and 2). In leaves of A. thaliana plants, all the genes of the β-family CAs and three genes of the α-family – α-CA1, α-CA2, and α-CA4 – were expressed. The size of the PCR products with the corresponding primers was 170-200 bp (Fig. 3, lanes 1-11). All primers reacted only with cDNA, because the size of the PCR products in each case corresponded to the calculated one, and there were no other bands in the gel. Thus, the use of these primers for qPCR made it possible to measure the content of the RNA of the corresponding genes. PCR products with primers to genes encoding α-CA3, α-CA5, α-CA6, α-CA7, and α-CA8 were not detected (not shown), which corresponds to literature data.
Fig. 2. Alternative splicing scheme of the At3g01500 gene encoding β-CA1. Rectangles denote the gene exon parts, connected by introns. Light areas are untranslated end regions. F1 and R1, and F2 and R2 are the locations of the sections complementary to the “forward” and “reverse” primers, respectively.
Fig. 3. Result of conventional PCR with designed for quantitative PCR primers to genes encoding: 1) actin; 2) β-CA1a; 3) β-CA1b; 4) β-CA2; 5) β-CA3; 6) β-CA4; 7) β-CA5; 8) β-CA6; 9) α-CA1; 10) α-CA2; 11) α-CA4; 12) markers of length of DNA fragments; numbers on the right are the sizes of double-stranded DNA fragments in base pairs.
In the leaves of 40-55-day plants, which were at the stage of vegetation (plants of the “short day”), all the studied CA genes were actively transcribed (Figs. 4 and 5, left columns). By the 55th day, there was an increase in the content of transcripts of some genes (β-ca3, β-ca6, α-ca2). Expression of other genes of CAs – β-ca2, β-ca4, and β-ca5 – also showed a tendency to increase. This is apparently because at the age of 39-55 days the Arabidopsis plants are still in the growth phase, when the mitotic index (the percentage of dividing cells from the total number of cells) in all annuals is high [25]. In the “long day” conditions, just before the plants started the formation of generative organs, approximately on the 17th-20th day of growth at this photoperiod, when leaves began to die and flower stems started to form, the contents of the transcripts of the CA genes fell practically to zero (Figs. 4 and 5, right columns), since changes in mRNA levels occur before visible changes in plants [25].
Fig. 4. Levels of expression of genes encoding extracellular carbonic anhydrases at low (80 µmol PAR quanta·m−2·s−1) and high (400 µmol PAR quanta·m−2·s−1) light intensities (white and dark bars, respectively) in Arabidopsis plants grown with “short day” (left column) or “long day” (right column). Numbers on the X-axis show the age of the plants and (in parentheses) the number of days after moving the plants adapted to the corresponding photoperiod from low-intensity light to high-intensity light. The data are presented as mean ± standard error of the mean. Asterisk denotes statistically significant differences between values for different illumination at the same day length, p < 0.01.
Fig. 5. Levels of expression of genes encoding chloroplast carbonic anhydrases at low (80 µmol PAR quanta·m−2·s−1) and high (400 µmol PAR quanta·m−2·s−1) light intensities (white and dark bars, respectively) in Arabidopsis plants grown with “short day” (left column) or “long day” (right column). Numbers on the X-axis show the age of the plants and (in parentheses) the number of days after moving the plants adapted to the corresponding photoperiod from low-intensity light to high-intensity light. Mean ± standard error of the mean is presented. Statistically significant differences between values for different illumination at the same day length; * p < 0.01, ** p < 0.05.
Adaptation of plants to an increased light intensity (Figs. 4 and 5) led to a change in the expression level of most CA genes, and these changes for many genes depended on the length of the photoperiod during cultivation. Obviously, in plants of both “short day” and “long day”, an increase in illumination leads to an intensification of photosynthesis in the leaves, but the different duration of this process during the day can have different demands on the functional activity of the CA in high-light conditions. In addition, the “long day” conditions in Arabidopsis plants is the main factor initiating the transition of the Arabidopsis plants to the generative phase by triggering the cascade of expression of groups of flowering genes [15], including a variety of genes not directly related to the formation of flower organs. The “long day” and “short day” plants were, therefore, in different ontogenetic phases, which could affect the transcription of the CA genes, changing the dependence of this process on the light intensity, and on the duration of photosynthesis during the day. Thus, the experimental conditions used in this study provide additional information on the possible functions of the CAs.
Effects of light intensity on level of gene expression of extrachloroplastic CAs. Under the “short day” conditions, the level of expression of the gene encoding β-CA2, the second most abundant CA in the cells of higher plants and located in the cytoplasm, following a slight decrease in the first day after transferring plants to HL in 14 days was six times higher than under LL. In the “long day” plants, the expression of this gene did not change significantly with increasing light intensity (Fig. 4). The content of the transcripts of the gene of the second cytoplasmic CA, the minor β-CA3 protein, was 3-4 orders of magnitude lower than that of β-ca2 transcripts (Fig. 4). The level of expression of the β-ca3 gene, in contrast to that of the β-ca2 gene, in HL was lower than in LL in both “short day” and “long day” conditions. It was suggested that the cytoplasmic CA is involved in the regulation of pH of the cytoplasm [26] and in the influx of inorganic carbon into the cell [27]. Although the effect of high light intensity on the number of transcripts of the genes of cytoplasmic CAs is opposite, and their content in the cell is very different, it is possible that they both fulfill these functions, but under different physiological conditions. An example is the presence of two CAs in the periplasmic space of Chlamydomonas reinhardtii cells: highly expressed CAH1, induced by low concentrations of CO2 in the environment, and very lowly expressed CAH2 [2], induced by high concentrations of CO2. It is believed that these CAs perform the same physiological function, facilitating the supply of inorganic carbon to the cell.
The content of transcripts of the β-ca4 gene, which encodes plasma membrane CA, changed very little during the two weeks of cultivation under the “short day” conditions and did not depend on the intensity of light (Fig. 4, left column). In the “long day” plants, it was approximately two times lower in HL than in LL (Fig. 4, right column), which is similar to the change in the β-ca3 gene transcript content. The function of β-CA4 was confirmed in processes taking place in stomata guard cells, where in cooperation with the β-CA1 located in the same cells it participated in regulation of the size of the stomatal pore [28]. It was suggested [29] that the function of the plasma membrane CA in the mesophyll cells of the leaf is the adjustment of the proton exchange between the cell and the environment that is provoked by the consumption of CO2 in photosynthesis.
Only contents of transcripts of the gene of mitochondrial β-CA6 remained approximately the same under both HL and LL, and in both “short day” and “long day” conditions, changing only with the age of the plant (Fig. 4). A hypothesis about the physiological role of this CA assumes its participation in cooperation with the γ-CA domain in the active inorganic carbon transport system from mitochondria to chloroplasts in conditions when the stomata are closed and CO2 inflow from the environment is limited [3]. In this case, the activity of β-CA6 should be induced by low concentration of carbon dioxide.
Effects of light intensity on level of expression of CA genes of chloroplasts. The adaptation of plants to increased illumination should obviously be reflected in the activation of processes taking place in chloroplasts. In “short day” plants, after two weeks of adaptation to HL the level of expression of the majority of chloroplast CAs was higher than under LL (Fig. 5). The level of β-ca1a transcripts in the “short day” conditions increased approximately 5-fold after 14 days under HL (Fig. 5, left column), while in the “long day” conditions, after just 3 days under HL it was 30 times lower than under LL (Fig. 5, right column). The level of transcripts of β-ca1b in “short day” plants under HL increased approximately 5-fold after 14 days (Fig. 5, left column), exactly like the level of expression of β-ca1a, but in the “long day” conditions, it showed a tendency to increase, and after 5 days it was more than three times higher than under LL (Fig. 5, right column). Light intensity had a similar effect on the expression of yet another stromal CA, α-CA1 (Fig. 5): its level of expression under high light was also higher for both “short day” and “long day” conditions, after the initial decrease in the “long day” conditions at both light intensities.
Thus, the study of the content of transcripts of stromal CA genes under “long day” conditions revealed significant differences in the expression level of these genes during the adaptation to high light intensity. The opposite effect of light intensity on the level of expression of the two forms of the gene encoding β-CA1, β-ca1a and β-ca1b, under these conditions may indicate different functions of the proteins encoded by them. The lack of the effect of the decrease in the content of β-CA1 on photosynthesis (see introduction) served as the basis for assumptions about a minor role of CA in this process [7]. However, it is likely that more than an order of magnitude difference in expression levels between the two forms of the α-CA1 gene should be considered. Considering the similar increase in the expression of α-ca1 and β-ca1b genes with increasing illumination, we assume their cooperation in the supply of CO2 to Rubisco. From the literature, the joint participation of two CAs is known to perform an important function. For example, it has been shown that β-CA1 and β-CA4 of the Arabidopsis stomatal guard cells together control the gas exchange of the plant [28]. It is possible that in this case β-CA1a functions together with β-CA4. This possibility is supported by the similar effect of HL on the genes β-ca1a and β-ca4 in “long day” plants (Figs. 4 and 5, right columns).
The level of expression of the thylakoid CA gene, α-ca4, did increase under HL in the “short day” conditions after the initial decrease, and became two times higher than under LL after 14 days (Fig. 5, left column). Under the “long day” conditions, the number of transcripts of this gene under HL became 16 times higher than under LL after five days (Fig. 5, right column). A study of α-CA4 function, using knockout plants lacking the α-ca4 gene, showed that in its absence energy-dependent nonphotochemical quenching of Chl a fluorescence was significantly suppressed, and it was suggested that this CA is involved in local protonation of the PsbS protein [30]. This function of α-CA4 is consistent with a significant increase in the level of expression of its gene in plants under HL, when the need for nonphotochemical quenching protecting PSII from photoinhibition increases: in plants adapted to HL, nonphotochemical quenching of Chl a fluorescence was indeed significantly higher than in plants under LL (Table 3).
The gene encoding α-CA2 had a relatively low level of expression, which, under “short day” conditions, in our experiments increased with increasing plant age (Fig. 5, left column). An increase in the illumination of plants under these conditions led to an additional increase in the level of its transcription, similar to the genes discussed above. In the “long day” conditions (Fig. 5, right column), there were no significant differences in the content of transcripts of the α-ca2 gene under both HL and LL, although there was a tendency for its decrease under HL, like that for β-ca1a and β-ca5 (Fig. 5). There are no direct data on the location of α-CA2, but some properties of knockout mutants lacking α-ca2 gene suggest that this CA is located in the thylakoid membranes: in these mutants, the level of energy-dependent nonphotochemical quenching was higher than in wild-type plants [6]. Similar trends in the level of expression of α-ca4 and α-ca2 genes with increasing illumination in plants under “short day” conditions and different trends in “long day” conditions can be compared with the data of Zhurikova et al. [6] about the opposite effects of α-CA4 and α-CA2 carbonic anhydrases on nonphotochemical quenching of Chl a fluorescence; these effects, owing to a change in the ratio of their contents, can provide the nonphotochemical quenching value that is necessary under the current environment conditions.
The level of transcription of only one gene encoding the chloroplast CA β-CA5 decreased under HL in “short day” conditions (Fig. 5, left column). Under HL in “long day” conditions, the level of transcription of this gene also decreased, which coincided only with the behavior of the β-ca1a gene. The location of β-CA5 in the chloroplasts of Arabidopsis has not been established [1]. Previously, we found that there is a soluble CA of the β-family in the lumen of the thylakoids of Arabidopsis and pea [31]. Even before the discovery of this enzyme, it was suggested [32] that the soluble CA could, with the participation of the CO2/HCO3− buffer, provide the facilitated diffusion of protons to the ATP synthase channel. The importance of such CA should obviously increase at low illumination, when the proton flux into the lumen is low, and they can be “lost” along the way to ATP synthase. This corresponds to the observed dependence of the expression of the β-ca5 gene on the intensity of illumination of plants, and one can safely assume that β-CA5 is a lumenal CA. Seeds of Arabidopsis with knocked out β-ca5 gene sprouted up only under increased CO2 concentration and the plants were far smaller than wild-type plants (J. V. Moroney, personal communication), and this is the only case where knockout of only one CA affected the phenotype so negatively.
The study provides data on the expression of genes of several CAs belonging to the α- and β-families in plant leaves. It is known that the roles of many enzymes can manifest themselves to a greater or lesser extent when placing the plant in stress conditions, and such a natural factor for plants as increased illumination can induce a stress response in Arabidopsis, a heliophobic plant. It turned out that the expression of the genes of some of the CAs during the adaptation of Arabidopsis plants to increased illumination depends on the photoperiod, i.e. the period of illumination of plants during the day; and with increasing illumination, the level of expression of the genes of some CAs changed in the opposite directions for different photoperiods. The results suggest that when the same external factor (light intensity, temperature, humidity, etc.) changes, the participation of CAs in the metabolism of higher plants, which for most of them is still not completely clear, can depend radically on accompanying conditions, which must be taken into account when analyzing the functions of these enzymes.
Acknowledgments
The authors are grateful to Prof. J. V. Moroney (University of Louisiana, USA) for useful discussion in the design of primers and V. A. Mudrik (IBBP, Russian Academy of Sciences) for help in growing plants.
This work was carried out with the financial support of the Russian Science Foundation (project No. 17-14-01371).
REFERENCES
1.Fabre, N., Reiter, I. M., Becuwe-Linkan, N.,
Genty, B., and Rumeau, D. (2007) Characterization and expression
analysis of genes encoding α and β carbonic anhydrases in
Arabidopsis, Plant Cell Environ., 30, 617-629.
2.Moroney, J. V., Ma, Y., Frey, W. D., Fusilier, K.
A., Pham, T. T., Simms, T. A., Di Mario, R. J., Yang, J., and
Mukherjee, B. (2011) The carbonic anhydrase isoforms of
Chlamydomonas reinhardtii: intracellular location, expression,
and physiological roles, Photosynth. Res., 109,
133-149.
3.Soto, D., Cordoba, J. P., Villarreal, F., Bartoli,
C., Schmitz, J., Maurino, V. G., Braun, H. P., Pagnussat, G. C., and
Zabaleta, E. (2015) Functional characterization of mutants affected in
the carbonic anhydrase domain of the respiratory complex I in
Arabidopsis thaliana, Plant J., 83, 831-844.
4.Friso, G., Giacomelli, L., Ytterberg, A. J.,
Peltier, J.-B., Rudella, A., Sun, Q., and Van Wijka, K. J. (2004)
In-depth analysis of the thylakoid membrane proteome of Arabidopsis
thaliana chloroplasts: new proteins, new functions, and a plastid
proteome database, Plant Cell, 16, 478-499.
5.Villarejo, A., Buren, S., Larsson, S., Dejardin,
A., Monne, M., Rudhe, Ch., Karlsson, J., Jansson, S., Lerouge, P.,
Rolland, N., Von Heijne, G., Grebe, M., Bako, L., and Samuelsson, G.
(2005) Evidence for a protein transported through the secretory pathway
en route to the higher plant chloroplast, Nat. Cell Biol.,
7, 1224-1231.
6.Zhurikova, E. M., Ignatova, L. K., Rudenko, N. N.,
Mudrik, V. A., Vetoshkina, D. V., and Ivanov, B. N. (2016)
Participation of two carbonic anhydrases of the alpha family in
photosynthetic reactions in Arabidopsis thaliana,
Biochemistry (Moscow), 81, 1463-1470.
7.Price, G. D., Von Caemmerer, S., Evans, J. R., Yu,
J.-W., Lloyd, J., Oja, V., Kell, P., Harrison, K., Gallagher, A., and
Badger, M. R. (1994) Specific reduction of chloroplast carbonic
anhydrase activity by anti-sense RNA in transgenic tobacco plants has a
minor effect on photosynthetic CO2 assimilation,
Planta, 193, 331-340.
8.Buren, S. (2010) Targeting and Function of
CAH1-Characterisation of a Novel Protein Pathway to the Plant Cell
Chloroplast, PhD Thesis, Umea University, Sweden.
9.Rudenko, N. N., Ignatova, L. K., Fedorchuk,
T. P., and Ivanov, B. N. (2015) Carbonic anhydrases in photosynthetic
cells of higher plants, Biochemistry (Moscow), 80,
674-687.
10.Restrepo, S., Myers, K. L., Del Pozo, O., Martin,
G. B., Hart, A. L., Buell, C. R., Fry, W. E., and Smart, C. D. (2005)
Gene profiling of a compatible interaction between Phytophthora
infestans and Solanum tuberosum suggests a role for carbonic
anhydrase, Mol. Plant Microbe Interact., 18, 913-922.
11.Frick, U. B., and Schaller, A. (2002) cDNA
microarray analysis of fusicoccin-induced changes in gene expression in
tomato plants, Planta, 216, 83-94.
12.De la Torre, W. R., and Burkey, K. O. (1990)
Acclimation of barley to changes in light intensity: chlorophyll
organization, Photosynth. Res., 24, 117-125.
13.Stitt, M. (1986) Limitation of photosynthesis by
carbon metabolism. Evidence for excess electron transport capacity in
leaves carrying out photosynthesis in saturating light and
CO2, Plant Physiol., 81, 1115-1122.
14.Maenpaa, P., and Andersson, B. (1989) Photosystem
II heterogeneity and long-term acclimation of light-harvesting, Z.
Naturforsch., 44, 403-406.
15.Blazquez, M. A. (2005) The right time and place
for making flowers, Science, 309, 1024-1025.
16.Wellmer, F., and Riechmann, J. L. (2010) Gene
networks controlling the initiation of flower development, Trends
Genet., 26, 519-527.
17.Ignatova, L. K., Rudenko, N. N., Mudrik, V. A.,
Fedorchuk, T. P., and Ivanov, B. N. (2011) Carbonic anhydrase activity
in Arabidopsis thaliana thylakoid membrane and fragments
enriched with PSI or PSII, Photosynth. Res., 110,
89-98.
18.Schagger, H., and Von Jagow, G. (1987)
Tricine-sodium dodecyl sulfate-polyacrylamide gel electrophoresis for
the separation of proteins in the range from 1 to 100 kDa,
Anal. Biochem., 166, 368-379.
19.Morosinotto, T., Bassi, R., Frigerio, S.,
Finazzi, G., Morris, E., and Barber, J. (2006) Biochemical and
structural analyses of a higher plant photosystem II supercomplex of a
photosystem I-less mutant of barley: consequences of a chronic
over-reduction of the plastoquinone pool, FEBS J., 273,
4616-4630.
20.Onda, Y., Matsumura, T., Kimata-Ariga, Y.,
Sakakibara, H., Sugiyama, T., and Hase, T. (2000) Differential
interaction of maize root ferredoxin: NADP1 oxidoreductase with
photosynthetic and non-photosynthetic ferredoxin isoproteins, Plant
Physiol., 123, 1037-1045.
21.Weigel, D., and Glazebrook, J. (2002)
Arabidopsis: A Laboratory Manual, Cold Spring Harbor Laboratory
Press, Cold Spring Harbor, NY.
22.Bailey, S., Walters, R. G., Jansson, S., and
Horton, P. (2001) Acclimation of Arabidopsis thaliana to the
light environment: the existence of separate low light and high light
responses, Planta, 213, 794-801.
23.Borisova-Mubarakshina, M. M., Vetoshkina, D. V.,
Rudenko, N. N., Shirshikova, G. N., Fedorchuk, T. P., Naydov, I. A.,
and Ivanov, B. N. (2014) The size of the light-harvesting antenna of
higher plant photosystem II is regulated by illumination intensity
through transcription of antenna protein genes, Biochemistry
(Moscow), 79, 520-523.
24.Ruban, A. V. (2016) Nonphotochemical chlorophyll
fluorescence quenching: mechanism and effectiveness in protecting
plants from photodamage, Plant Physiol., 140,
1903-1916.
25.Alekhina, N. D., Balnokhin, Yu. V., Gavrilenko,
V. F., Zhigalova, T. V., Meichik, N. R., Nosov, A. M., Polesskaya, O.
G., Kharitonashvili, E. V., and Chub, V. V. (2005) Plant
Physiology (Ermakova, I. P., ed.) [in Russian], Akademiya, Moscow,
pp. 416-419.
26.Reed, M. L., and Graham, D. (1981) Carbonic
anhydrase in plants: distribution, properties and possible
physiological roles, Progr. Phytochem., 7, 47-94.
27.DiMario, R. J., Quebedeaux, J. C., Longstreth, D.
J., Dassanayaki, M., Hartman, M. M., and Moroney, J. V. (2016)
βCA2 and βCA4 are required for optimal plant growth in a low
CO2 environment, Plant Physiol., 171,
280-293.
28.Hu, H., Boisson-Dernier, A.,
Israelsson-Nordstrom, M., Bohmer, M., Xue, S., Ries, A., Godoski, J.,
Kuhn, J. M., and Schroeder, J. I. (2010) Carbonic anhydrases are
upstream regulators of CO2-controlled stomatal movements in
guard cells, Nat. Cell Biol., 12, 87-93.
29.Ignatova, L. K., Moskvin, O. V., and Ivanov, B.
N. (2001) Effects of carbonic anhydrase inhibitors on proton exchange
and photosynthesis in pea protoplasts, Russ. J. Plant Physiol.,
48, 467-472.
30.Zhurikova, E. M., Ignatova, L. K., Semenova, G.
A., Rudenko, N. N., Mudrik, V. A., and Ivanov, B. N. (2015) Effect of
knockout of α-carbonic anhydrase 4 gene on photosynthetic
characteristics and starch accumulation in leaves of Arabidopsis
thaliana, Russ. J. Plant Physiol., 62,
564-569.
31.Fedorchuk, T. P., Rudenko, N. N., Ignatova, L.
K., and Ivanov, B. N. (2014) The presence of soluble carbonic anhydrase
in the thylakoid lumen of chloroplasts from Arabidopsis leaves,
J. Plant Physiol., 171, 903-906.
32.Onoiko, E. B., Polishchuck, A. V., and
Zolotareva, E. K. (2010) The stimulation of photophosphorylation in
isolated spinach chloroplasts by exogenous bicarbonate: the role of
carbonic anhydrase, Rep. Nat. Acad. Sci. Ukr., 10,
161-165.