Laccase-Catalyzed Heterocoupling of Dihydroquercetin and p-Aminobenzoic Acid: Effect of the Reaction Product on Cultured Cells
M. E. Khlupova1, O. V. Morozova1, I. S. Vasil’eva1, G. P. Shumakovich1, N. V. Pashintseva1, L. I. Kovalev1, S. S. Shishkin1, V. A. Chertkov2,a, A. K. Shestakova3,b, A. V. Kisin3, and A. I. Yaropolov1,c*
1Research Center of Biotechnology, Bach Institute of Biochemistry, Russian Academy of Sciences, 119071 Moscow, Russia2Lomonosov Moscow State University, Faculty of Chemistry, 119899 Moscow, Russia
3State Research Institute of Chemistry and Technology of Organoelement Compounds, 105118 Moscow, Russia
* To whom correspondence should be addressed.
Received January 19, 2018; Revision received March 20, 2018
Derivatization of the natural flavonoid dihydroquercetin with p-aminobenzoic acid was carried out in an ethyl acetate/citric buffer biphasic system using laccase from the fungus Trametes hirsuta. The main reaction product yield was ~68 mol %. The product was characterized by 1H NMR, 13C NMR, and liquid chromatography-mass spectroscopy, and its structure was elucidated. The reaction product affected viability of cultured human rhabdomyosarcoma cells (RD cell line) in a dose-dependent manner and, therefore, can be of interest to pharmaceutical industry.
KEY WORDS: dihydroquercetin, p-aminobenzoic acid, laccase, biotransformation, 1H and 13C NMR spectra, proteomicsDOI: 10.1134/S0006297918080102
Abbreviations: ABA, p-aminobenzoic acid; ABTS, 2,2′-azino-bis(3-ethylbenzothiazoline-6-sulfonic acid); COSY, proton-proton correlation spectroscopy; DHQ, dihydroquercetin; FBS, fetal bovine serum; HMBC, heteronuclear multiple-bond correlation spectroscopy; HSQC, heteronuclear single quantum correlation spectroscopy; J, spin-spin coupling constant; oligoDHQ, dihydroquercetin oligomer.
Oxidation reactions involving enzymes and molecular oxygen are very
common in nature. Laccases (p-diphenol:oxygen oxidoreductases,
EC 1.10.3.2) belong to multi-nuclear copper-containing oxidases
catalyzing oxidation of a wide variety of organic compounds by dioxygen
with its reduction to water [1-3]. Fungal laccases demonstrate high catalytic
activity in the acidic pH range. Oxidation of phenolic substrates
catalyzed by laccases is a single-electron reaction resulting in the
formation of organic radicals that can participate in non-enzymatic
reactions, such as disproportionation, polymerization, or coupling with
other molecules [4, 5].
Dihydroquercetin (DHQ, taxifolin) is a natural flavonoid that exhibits a wide range of pharmacological effects. It has antioxidant, antitumor, angioprotective, hepatoprotective, and other properties [6-11]. p-Aminobenzoic acid (ABA, vitamin B10) is a physiologically active compound that participates in many processes; it decreases blood cholesterol, improves hematopoiesis, normalizes thyroid function, prevents thrombophlebitis, etc. Enzymatic heterocoupling of these compounds could result in the synthesis of novel hybrid polyfunctional pharmacologically active compounds. Currently, there are no published data on oxidative heterocoupling of DHQ with other physiologically active compounds.
The objectives of this study were enzymatic heterocoupling of DHQ with ABA in the presence of fungal laccase from Trametes hirsuta, identification of the reaction product, and examination of its effects on cultured human cells.
MATERIALS AND METHODS
Chemicals. Dihydroquercetin (≥96%) (BioKimMak-ST, Russia), ABA (Aldrich, USA), potassium dihydrogen phosphate, sodium hydroxide, anhydrous citric acid, ethyl acetate, toluene, acetonitrile, trifluoroacetic acid, 2,2′-azino-bis(3-ethylbenzothiazoline-6-sulfonic acid) (ABTS) (Sigma-Aldrich, USA), acetic acid (Khimmed, Russia), and diphenylboric acid β-aminoethyl ester (natural product reagent A; Carl Roth, Germany) were used without further purification. Sorbfil plates (IMID, Russia) were used for thin-layer chromatography (TLC); Kieselgel 60 silica gel (0.040-0.063 nm) (Merck, Germany) was used for flash chromatography. All solutions were prepared in Milli-Q purified water (Millipore, USA).
Laccase was isolated from the liquid culture medium of the basidiomycete T. hirsuta (Wulfen) Pilat according as described by Gorshina et al. [12]. The enzyme was homogenous according to SDS-electrophoresis; its specific activity was 145 IU/mg protein. Laccase activity was determined spectrophotometrically using 1 mM ABTS as a chromogenic substrate (λ = 420 nm, ε = 36,000 M–1×cm–1) at 24°C in 0.1 M citrate phosphate buffer, pH 4.5. An amount of the enzyme catalyzing transformation of 1 μmol of ABTS per minute was defined as an enzyme activity unit.
Heterocoupling of DHQ and ABA was carried out in a biphasic ethyl acetate/0.1 M Na citrate-phosphate buffer (pH 3.0) system. The substrates (DHQ and ABA) were dissolved in ethyl acetate in a concentration of 2 mM in a typical experiment. Laccase from T. hirsuta was added to the buffer solution. The reaction was performed under aerobic conditions with constant mixing for 24 h. The products formed in the course of reaction accumulated mostly in the organic phase as demonstrated by its color change. The reaction was monitored using thin layer-chromatography (mobile phase: toluene–ethyl acetate–acetic acid, 6 : 4 : 1 v/v). The plates were developed with 1% diphenylboric acid β-aminoethyl ester solution in methanol. The reaction product traveled as a single spot with Rf = 0.74. After reaction completion, the organic phase was separated and dried on a rotary evaporator. The reaction products were purified by flash chromatography on Kieselgel 60 silica gel using the same mobile phase. Fractions containing the target product were dried on a rotary evaporator.
OligoDHQ (dihydroquercetin oligomer) was prepared according to the protocol reported in Khlupova et al. [13].
Characterization of the reaction products. Analytical HPLC was conducted on a 1290 Infinity chromatograph (Agilent Technologies, USA). The samples were dissolved in methanol. HPLC conditions: C18 column (Agilent SB-Aq; 1.8 μm, 2.1 × 50 mm); mobile phase, gradient of 0.1% aqueous solution of trifluoroacetic acid (eluent A) in acetonitrile (eluent B); gradient 0-2.5 min of 98-70 vol.% A, 2.5-13 min of 70-60 vol.% A; flow rate, 0.4 ml/min; operating wavelength, 290 nm.
Liquid chromatography-mass spectrometry was performed on an Ultimate 3000 chromatograph (Dionex, Germany) connected to a Q Exactive mass spectrometer (Thermo Scientific, USA) using a HYPERSIL Gold aQ column (Thermo Fisher Scientific, USA) (150 × 2.1 mm; particle size, 1.9 μm). Mobile phase: eluent A, 0.1% formic acid solution in a deionized water–acetonitrile mixture (95 : 5 v/v); eluent B, 0.1% formic acid solution in acetonitrile; flow rate, 0.5 ml/min.
UV-visible spectra were recorded with a Shimadzu UV-1240 mini spectrophotometer (Shimadzu, Japan). 1H and 13C NMR spectra of samples dissolved in DMSO-D6 were recorded using a Bruker AVANCE 600 spectrometer (Bruker, Germany) with operating 1H frequency of 600.03 MHz.
Biological activity assay of the synthesized compounds was carried out in the human rhabdomyosarcoma cell line RD from the collection of the Ivanovskii Institute of Virology, Russian Academy of Medical Sciences (Moscow, Russia). The cells were cultured in 96-well plates (Nunc, Denmark) as described by Lisitskaya et al. [14]. Each well containing 100 μl of DMEM medium (PanEko, Russia) supplemented with L-glutamine, gentamycin, and 5% fetal bovine serum (FBS) was inoculated with 2·105 cells. The cells were incubated with serial dilutions (0.01-1.25 mg/ml) of the tested compounds in DMEM; RD line cells incubated in the original DMEM in the absence of tested compounds were used as a control. The number of viable cells was determined by tetrazolium dye staining using a WST-1 kit (Millipore, USA) as described by Lisitskaya et al. [14] with some modifications. An aliquot (10 μl) of the WST-1 reagent working solution and 100 μl of warm Hanks solution (PanEko) were added to each well. Next, the plate with cells was incubated in the dark at 37°C for 4 h. The optical density in the wells was recorded with a Multiscan Ascent plate reader (Thermo Electron Corporation, USA) at 420 nm with a 630-nm reference filter. The number of viable cells in the wells was determined from the optical density values according the manufacturer’s protocol.
Statistical data processing was performed using the Mann–Whitney criterion (http://www.psychol-ok.ru/statistics/mann-whitney).
Proteomic studies. For proteomic analysis, RD cells were cultured until confluence in 175-cm2 cell culture flasks in DMEM containing 10% FBS. The medium was then replaced with the modified DMEM (see above) containing the tested compound in a concentration 0.5 mg/ml, and the cells were cultured for another 24 h at 37°C in 5% CO2. After incubation, the cells were washed 3 times with Hanks solution and scraped off from the flask surface. The collected cells were either used immediately for proteomic analysis or frozen at –70°C and stored for no more than 2-3 days before analysis. Cells cultured under the same conditions in the original DMEM were used as a control.
Proteins were separated by non-equilibrium pH gradient 2D electrophoresis [15, 16] and visualized by staining with Coomassie blue R-250 or silver nitrate. The resulting electrophoregrams were analyzed as described by Pashintseva et al. [16] with some modifications.
Matrix-assisted laser desorption/ionization time-of-flight (MALDI-TOF) mass spectrometry and tandem mass spectrometry (MS/MS) were used for protein identification. The obtained spectra were analyzed with the Mascot software (Matrix Science Inc., USA) as described in [15-17]. The equipment used in this work was provided by the Center for Collective Use, Institute of Biochemistry, Russian Academy of Sciences (ID RFMEFI62114X0002).
RESULTS AND DISCUSSION
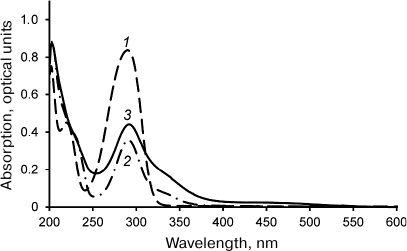
Laccase-catalyzed reaction of DHQ and ABA heterocoupling. The reaction of laccase-catalyzed DHQ and ABA heterocoupling was performed in the ethyl acetate/buffer solution biphasic system. Laccase was in the aqueous phase, while the substrates (DHQ and ABA) were in the organic phase. Considering that solubilities of DHQ and ABA in the aqueous phase are significantly lower than in the organic phase, and that laccase is virtually inactive in ethyl acetate, the use of biphasic system allowed to reduce formation of byproducts of DHQ oligomerization and ABA oxidation. The UV-visible spectra of the products of DHQ and ABA enzymatic heterocoupling purified by two rounds of flash chromatography are shown in Fig. 1. Unlike the spectra of the substrates, the spectrum of the reaction products displays absorption in the 380-550 nm region. It must be mentioned that two rounds of flash chromatography were sufficient to remove oligoDHQ from the reaction mixture, as confirmed by TLC and NMR.
Fig. 1. UV-visible spectra of ABA (1), DHQ (2), and products of their heterocoupling (3) in methanol.
Identification of the enzymatic reaction products. Three products formed as a result of DHQ and ABA heterocoupling were identified by HPLC. The reaction mixture also contained unreacted DHQ but almost no ABA.
Liquid chromatography-mass spectrometry of the reaction products purified by flash chromatography confirmed that the sample contained unreacted DHQ monomers (RT = 5.3; m/z = 305), trace amounts of ABA (RT = 1.85; m/z = 188), and three products of enzymatic heterocoupling: the main component hereafter referred to as compound A (m/z = 559; RT = 7.33) with suggested molecular formula C22H22O10N2 and two minor components (m/z = 424; RT = 6.87 and 7.20).
The reaction products were analyzed by 1H and 13C NMR spectroscopy. All spectra were recorded in DMSO-D6 at 303 K (30°C). One-dimensional 1H and 13C NMR spectra of DHQ, ABA, and products of their heterocoupling are presented in Figs. 2 and 3. Comparative analysis of the spectra indicated that the reaction mixture contained compound A (~68.5 mol %), two other products of DHQ and ABA heterocoupling (≤10 mol % in total) and unreacted DHQ (~20 mol %) and ABA (~1.5 mol %).
Fig. 2. 1H NMR spectra of (a) products of laccase-catalyzed heterocoupling of DHQ and ABA at pH 3.0, (b) DHQ, and (c) ABA.
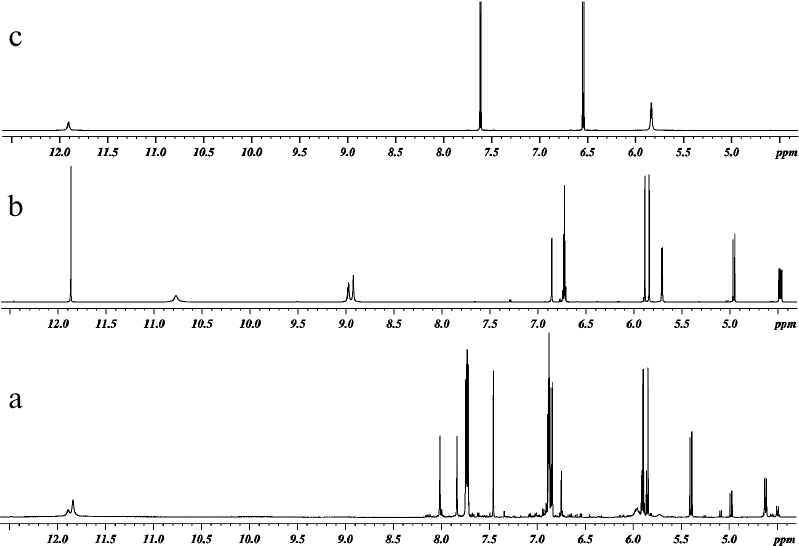
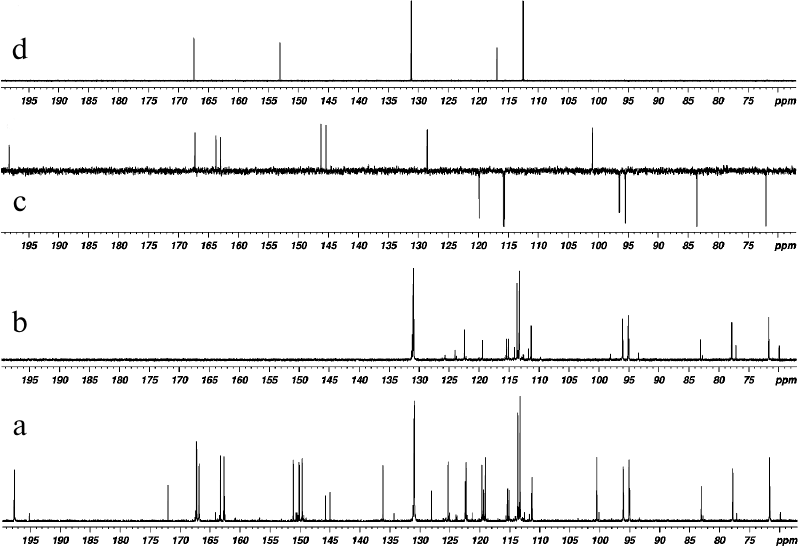
Fig. 3. 13C NMR spectra of products of laccase-catalyzed heterocoupling of DHQ and ABA in DMSO-D6: (a) with broadband proton decoupling, and (b) 13C-DEPT (signals from quaternary carbons are not revealed, signals from CH-groups are directed upward); (c) 13C-APT DHQ (signals of quaternary carbons are directed upward, signals from CH-groups are directed downward); (d) ABA (with broadband proton decoupling).
The values of the 1H and 13C chemical shifts of the A and C rings in the DHQ molecule (Fig. 4) are practically identical to the values of the shift for the similar signals in compound A, suggesting that compound A is a flavonoid. Therefore, for analysis of its NMR spectra, we used the data for DHQ [18] and related flavonoids [19, 20]. Signals similar to the signals of ABA were also present in the 13C NMR spectrum of compound A, with 2 moles of ABA per 1 mole of DHQ. To assign the signals and to elucidate the multiplet structure of compound A using parameters reported in [21], we used two-dimensional NMR spectroscopy, including proton-proton correlated spectroscopy (COSY), heteronuclear single quantum correlation spectroscopy (HSQC), and heteronuclear multiple-bond correlation spectroscopy (HMBC).
Fig. 4. Schematic representation of signal coupling due to the geminal spin-spin coupling constants 13C-H in compound A.
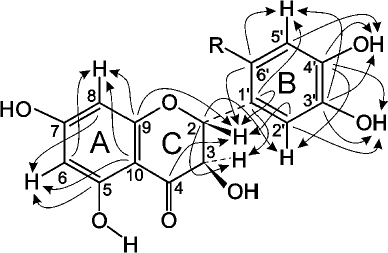
The signal from the carbonyl carbon C4 in the C ring at 197.58 ppm and characteristic duplets (J = 11.2 Hz) from protons H2 and H3 of the C ring at 5.399 and 4.622 ppm, respectively, were used as reference signals for signal assignment in the NMR spectra of compound A (Fig. 4). This allowed us to assign signals from the carbons C2 and C3 (C ring) using the 2D HSQC spectrum. The signals from the quaternary carbons C1 (B ring), C9 and C10 (A ring) were assigned using the HMBC spectrum. Analysis of the cross-peaks in the COSY, HSQC, and HMBC 2D spectra provided reliable information for assigning all proton and carbon signals from the A, B, and C rings of compound A.
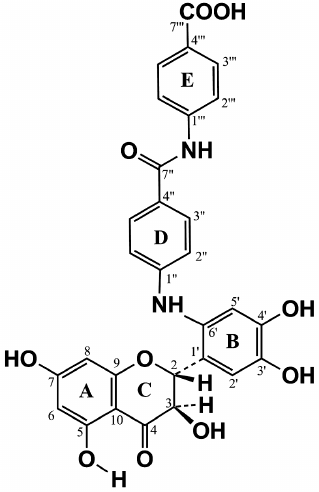
Complete analysis of all NMR data unambiguously shows that compound A contains two fragments of p-aminobenzoic acid attached at position 6´ of the DHQ molecule ring B (Fig. 5). Hence, the major product of the enzymatic heterocoupling of DHQ and ABA is 4-(4-(4,5-dihydroxy-2-((2R,3R)-3,5,7-trihydroxy-4-oxochroman-2-yl)phenylamino)benzamido) benzoic acid.
Fig. 5. Structure of compound A, the major product of laccase-catalyzed heterocoupling of DHQ and ABA.
The parameters of 1H and 13C NMR spectra of compound A are presented in Table 1. The observed parameters of the compound A multiplet structure are in a good agreement with the available literature data for related flavonoids [18-20] considering the effects of polar groups in an aromatic series [22, 23].
Table 1. Parameters of 1H and
13C NMR spectra of the main product (compound A) of
laccase-catalyzed DHQ and ABA heterocoupling
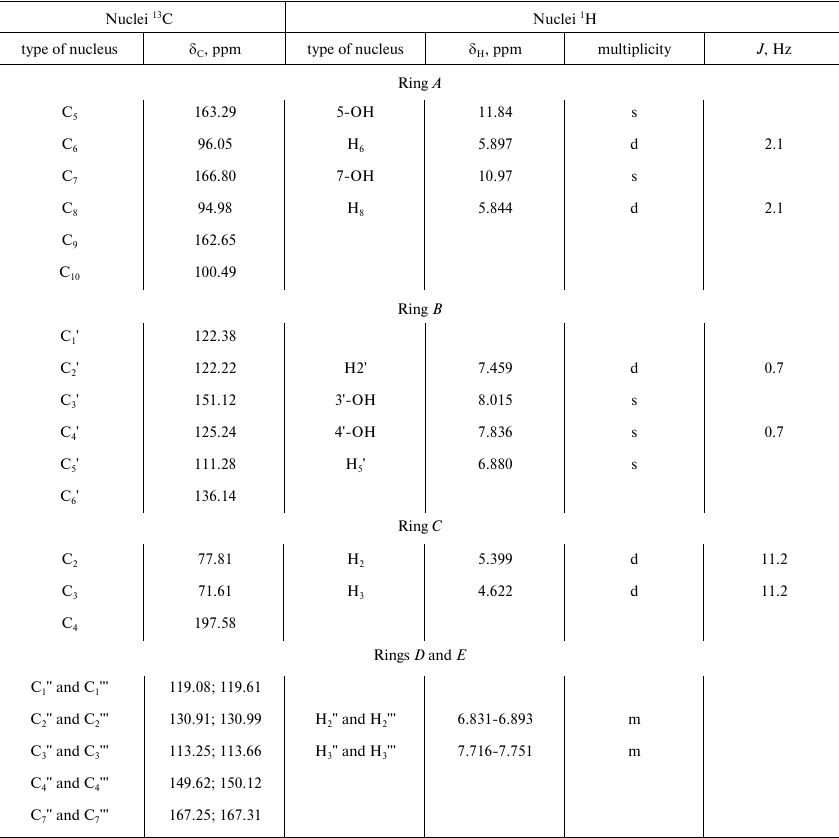
Note that the spin-spin coupling constants J(H2-H3) for compound A (11.2 Hz) and DHQ (11.1 Hz) are very close. Such high values can be expected only for the trans-orientation of H2 and H3 protons. Hence, compound A and DHQ have the same spatial structure of stereo centers at C2 and C3. The absence of racemization products indicates that laccase-catalyzed heterocoupling of DHQ and ABA proceeds under mild conditions.
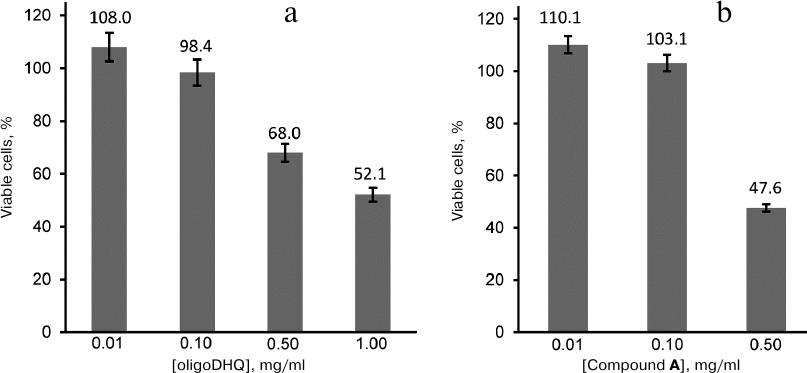
Biological activity of DHQ derivatives. We have demonstrated previously [13] that laccase catalyzes the reaction of DHQ polymerization, and that the formed oligomers demonstrate more pronounced antioxidant properties than the DHQ monomers. In this work, we investigated the effect of oligoDHQ and compound A on human rhabdomyosarcoma RD cells. Both preparations exhibited a dose-dependent effect on the viability of cultured cells (Fig. 6). Small but statistically significant stimulating effect manifested as a slight increase in the number of cells in the samples in comparison with the control was observed at low concentrations of the compounds (p < 0.01). However, increasing the concentrations of oligoDHQ and compound A to 0.5 mg/ml resulted in a sharp decrease in the number of viable cells to 68.0 and 47.6% of the control, respectively. Further increase in the oligoDHQ concentration to 1 mg/ml reduced the number of viable cells to 52.1%, while compound A at this concentration caused the death of almost all cells in the samples.
Fig. 6. Dose-dependent effect of oligoDHQ (a) and compound A (b) on cultured RD cells.
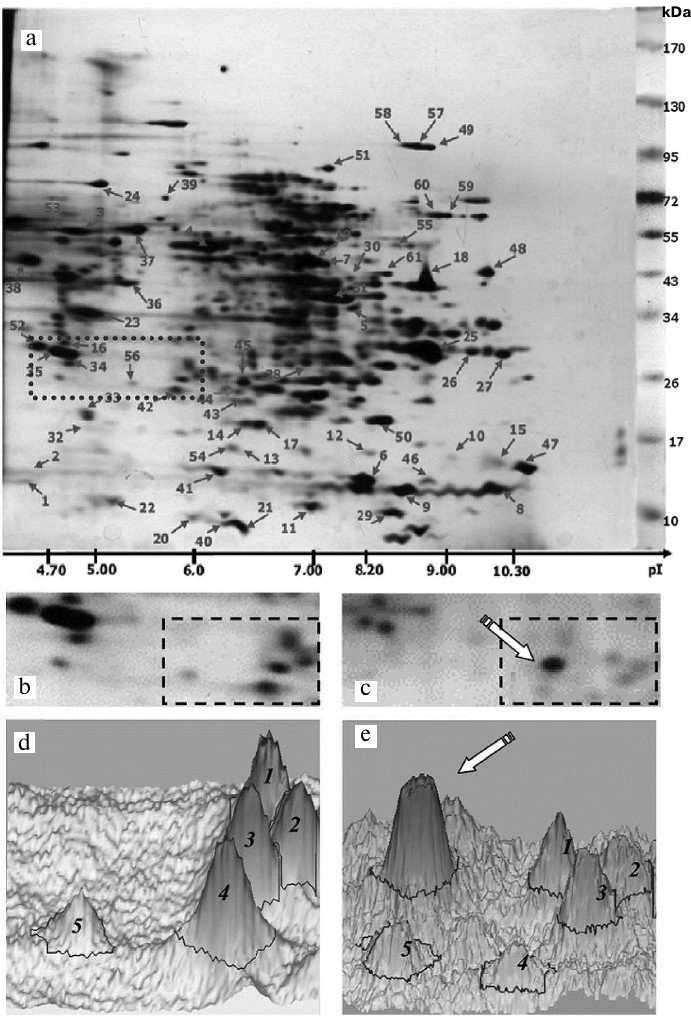
Effect of oligoDHQ and compound A on the proteomic profile of RD cells. In our previous work, we have investigated the proteomic profile of the original RD cell line [24] and characterized electrophoretic properties (Mw/pI) of 100 protein fractions (Fig. 7a), over 60 of which were identified by mass spectrometry (see Proteomics of malignant cells database (http://ef2.inbi.ras.ru; state registration number 2017620475) for results of identification).
Fig. 7. a) Two-dimensional protein map of RD cells. Identified protein fractions are marked with arrows and numbers (see Proteomics of malignant cells database; http://ef2.inbi.ras.ru). Dotted line shows the area analyzed (b) before and (c) after cell treatment with compound A. The regions for which the three-dimensional models (d, e) of the protein pattern were constructed are marked with dashed lines.
Both oligoDHQ and compound A caused alterations in the cell proteomic profile, including several most represented (major) protein fractions. Some effects were similar for both compounds. Thus, the pattern of fraction distribution in the two-dimensional electrophoregrams was preserved with the decrease in the quantities of almost all detected proteins, although the amounts of particular fractions could either increase or decrease. Moreover, the effects of both compounds were dose-dependent. When the cells were treated with 0.5 mg/ml oligoDHQ, the resulting electrophoregram represented a well-defined proteomic profile of RD cells; however, we failed to obtain similar profile for the cells treated with compound A in the same concentration because of massive cell death. To produce informative two-dimensional electrophoregram, we had to reduce the concentration of compound A two times. Due to the large amount of information, detailed analysis of changes in the proteomic profile of RD cells treated with oligoDHQ or compound A cannot be presented in this paper (the respective publication is under preparation); however, it seemed important to show as an example the results of detection and identification of one of the proteins, whose relative quantity significantly increased after treatment with compound A.
Figure 7, b and c, shows in detail the same section of the two-dimensional electrophoregrams (Fig. 7a, dotted line) obtained before and after treatment of RD cells with compound A. Based on the molecular masses of marker proteins and pI values of identified proteins, this section included proteins with molecular masses of 25-30 kDa and isoelectric points of 4.7-6.1, e.g., two tropomyosin proteins (nos. 34 and 35), a fragment of one of heat shock proteins (no. 56), and ubiquitin carboxyl-terminal hydrolase isozyme L1 (no. 42, UniProt ID P09936). We also observed a characteristic pattern of five protein fractions (Fig. 7, b and c, dashed line) that significantly changed following the treatment with compound A. In particular, a new major fraction emerged (Fig. 7c, arrow).
These changes were even more clearly pronounced in the three-dimensional models of the selected fraction patterns constructed with the ImageMaster 2D Platinum 7 software package (GE Healthcare, Switzerland) (Fig. 7, d and e; five protein fractions marked with Arabic numerals). It can be seen that the new major fraction (marked with an arrow) becomes dominant in the treated cells (Fig. 7e). In the non-treated RD cells, the protein with the corresponding electrophoretic characteristics was either not found at all or detected in trace amounts (Fig. 7d).
Based on the results of mass spectrometry (MALDI-TOF MS and Mascot analysis), the protein that appeared in the electrophoregram of RD cells after treatment with compound A was identified as prohibitin 1 (prohibitin isoform 1; UniProt ID P35232) (Fig. 8 and Table 2). The protein identification score was 235; number of match peptides, 13; coverage of protein amino acid sequence with identified peptides, 64%. Moreover, the sequence of the tryptic peptide with m/z = 1213.7 composed of 11 amino acid residues was determined by tandem mass spectrometry, which was identical to the sequence predicted by the Mascot program.
Fig. 8. Mass spectrum (MALDI-TOF MS) of tryptic peptides of the protein fraction emerging after treatment of RD cell with compound A.
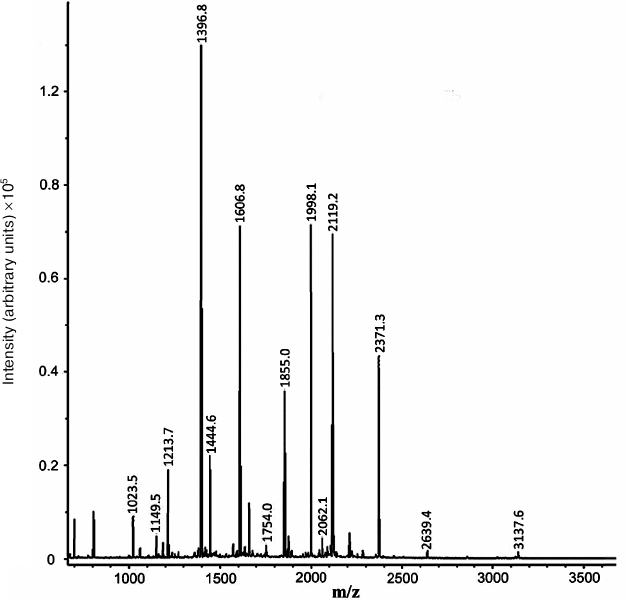
Table 2. Identification of tryptic peptides
in the mass spectrum of the protein emerging in the proteomic profile
of RD cell after treatment with compound A
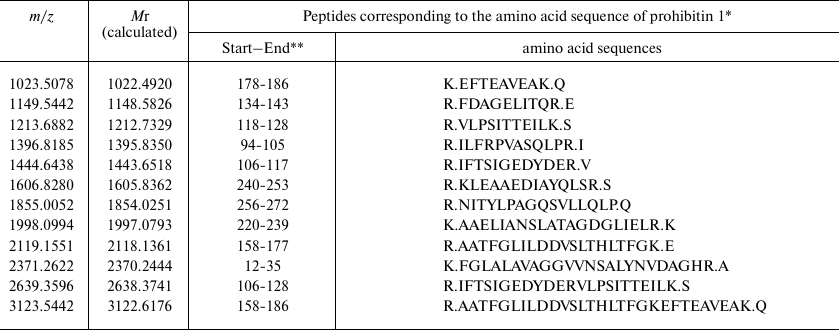
* According to NP_002625.1 Protein NCBI.
** Numbers of the initial and final amino acid residues in prohibitin 1
sequence.
It is known that prohibitin 1 is a multifunctional protein, whose name comes from the English word “prohibition”. In particular, it was shown that prohibitin 1 acts as a tumor suppressor by interacting with transcription factors and proteins involved in the cell cycle control [25, 26].
Previously, we failed to identify prohibitin 1 among major proteins in the samples of malignant and benign tumors and in cultured cell lines (see Proteomics of malignant tumors database; http://ef2.inbi.ras.ru). Hence, its identification as one of the dominant proteins in the RD cells treated with compound A was unexpected. The simplest explanation of the high representation of prohibitin 1 in the RD cells after their treatment with compound A is that compound A upregulates expression of the corresponding gene. Obviously, this hypothesis needs to be verified, for example, by direct evaluation of the transcription levels of prohibitin 1 gene before and after treatment of RD cells with compound A, which is the goal of our further study.
We believe that studies of the properties of DHQ derivatives including their effect on proteome and transcriptome of RD cells are important for elucidation of the mechanism of action of these compounds and evaluation of their potential applications.
Acknowledgments
This work was conducted within the framework of the research plan of the Fundamentals of Biotechnology Federal Research Center, Bach Institute of Biochemistry, Russian Academy of Sciences. Equipment used in this work was provided by the Industrial Biotechnologies Center for Collective Equipment Use of the Federal Research Center of Biotechnology, Russian Academy of Sciences.
REFERENCES
1.Hollmann, F., and Arends, I. W. C. E. (2012) Enzyme
initiated radical polymerizations, Polymers, 4,
759-793.
2.Morozova, O. V., Shumakovich, G. P., Gorbacheva, M.
A., Shleev, S. V., and Yaropolov, A. I. (2007) “Blue”
laccases, Biochemistry (Moscow), 72, 1136-1150.
3.Witayakran, S., and Ragauskas, A. J. (2009)
Synthetic applications of laccase in green chemistry, Adv.
Synth. Catal., 351, 1187-1209.
4.Tatsumi, K., Freyer, A., Minard, R. D., and Bollag,
J. M. (1994) Enzymatic coupling of chloroanilines with syringic acid,
vanillic acid and protocatechuic acid, Soil Biol.
Biochem., 26, 735-742.
5.Thurston, F. (1994) The structure and function of
fungal laccases, Microbiology, 140, 19-26.
6.Weidmann, A. E. (2012) Dihydroquercetin: more than
just an impurity? Eur. J. Pharmacol., 684, 19-26.
7.Pantouris, G., and Mowat, Ch. G. (2014) Antitumour
agents as inhibitors of tryptophan 2,3-dioxygenase, Biochem.
Biophys. Res. Commun., 443, 28-31.
8.Polyak, S. J., Morishima, Ch., Lohmann, V., Pal,
S., Lee, D. Y. W., Liu, Y., and Graf, T. N. (2010) Identification of
hepatoprotective flavonolignans from silymarin, PNAS,
107, 5995-5999.
9.Sato, M., Murakami, K., Uno, M., Ikubo, H.,
Nakagawa, Y., Katayama, S., Akagi, K., and Irie, K. (2013)
Structure–activity relationship for (+)-taxifolin isolated from
silymarin as an inhibitor of amyloid β aggregation, Biosci.
Biotechnol. Biochem., 77, 1100-1103.
10.Pozharitskaya, O. N., Karlina, M. V., Shikov, A.
N., Kosman, V. M., Makarova, M. N., and Makarov, V. G. (2009)
Determination and pharmacokinetic study of taxifolin in rabbit plasma
by high-performance liquid chromatography, Phytomedicine,
16, 244-251.
11.Ma, C., Yang, L., Wang, W., Yang, F., Zhao, C.,
and Zu, Y. (2012) Extraction of dihydroquercetin from Larix
gmelinii with ultrasound-assisted and microwave-assisted
alternant digestion, Int. J. Mol. Sci., 13,
8789-8804.
12.Gorshina, E. S., Rusinova, T. V., Biryukov, V.
V., Morozova, O. V., Shleev, S. V., and Yaropolov, A. I. (2006) The
dynamics of oxidase activity during cultivation of basidiomycetes from
the genus Trametes Fr., Appl. Biochem. Microbiol.,
42, 558-563.
13.Khlupova, M., Vasil’eva, I., Shumakovich,
G., Morozova, O., Chertkov, V., Shestakova, A., Kisin, A., and
Yaropolov, A. (2016) Laccase-mediated biotransformation of
dihydroquercetin (taxifolin), J. Mol. Catal. B: Enzymatic,
123, 62-66.
14.Lisitskaya, K. V., Sokueva, N. A., Malysheva, Yu.
G., Ivanov, A. V., Shishkin, S. S., and Syatkin, S. P. (2013)
Identification of the functional activity of synthetic polyamine
analogues using a biotest system based on highly proliferating cultured
human cells, Appl. Biochem. Microbiol., 49, 100-105.
15.Kovalyova, M. A., Kovalyov, L. I., Toropygin, I.
Yu., Shigeev, S. V., Ivanov, A. V., and Shishkin, S. S. (2009)
Proteomic analysis of human skeletal muscle (m. vastus
lateralis) proteins: identification of 89 gene expression products,
Biochemistry (Moscow), 74, 1239-1252.
16.Pashintseva, N. V., Shishkin, S. S., Lisitskaya,
K. V., Kovalev, L. I., Kovaleva, M. A., Eryomina, L. S., Kamenikhina,
I. A., Novikova, L. A., and Sadykhov, E. G. (2016) Study of splicing
factor, proline- and glutamine-rich by proteomic techniques in human
malignant and nonmalignant cell lines, Protein Peptide Lett.,
23, 958-966.
17.Shishkin, S., Kovaleva, M., Ivanov, A., Eryomina,
L., Lisitskaya, K., Toropugin, I., Kovalev, L., Okhritz, V., and Loran,
O. (2011) Comparative proteomic study of proteins in prostate cancer
and benign hyperplasia cells, J. Cancer Sci. Ther., S1,
003; doi: 10.4172/1948-5956.S1-003.
18.Kolesnik, Y. A., Titova, E. V., Chertkov, V. A.,
Tashlitskiy, V. N., Tichonov, V. P., and Shmatkov, D. A. (2011)
Stereoisomeric composition of two bioflavonoids from Larix
sibirica, Planta Med., 77, 1266.
19.Cotterill, P. J., Scheinmann, F., and Stenhouse,
I. A. (1978) Extractives from Guttiferae. Pt. 34. Kolaflavanone, a new
biflavanone from the nuts of Garcinia kola Heckel. Applications
of 13C nuclear magnetic resonance in elucidation of the
structures of flavonoids, J. Chem. Soc. Perkin
Trans., 1, 532-539.
20.Sinha, R., Joshi, A., Joshi, U. J., Srivastava,
S., and Govil, G. (2014) Localization and interaction of
hydroxyflavones with lipid bilayer model membranes: a study using DSC
and multinuclear NMR, Eur. J. Med. Chem., 80,
285-294.
21.Chertkov, V. A., Shestakova, A. K., and Davydov,
D. V. (2011) Regioselective N-arylation of nitroazoles. Determination
of the structure of N-arylnitroazoles on the basis of NMR spectroscopic
data and quantum-chemical calculations, Chem. Heterocycl.
Compd., 47, 45-54.
22.Ernst, L., Wray, V., Chertkov, V. A., and
Sergeyev, N. M. (1977) High resolution proton-coupled 13C
NMR spectra of monosubstituted benzenes. Theoretical and empirical
correlations of JCH, J. Magn. Reson.,
25, 123-139.
23.Leshcheva, I. F., Torocheshnikov, V. N.,
Sergeyev, N. M., Chertkov, V. A., and Khlopkov, V. N. (1991) Iterative
line shape analysis of 13C-2D multiplets. II.
Toluene-CH2D and toluene-CD3, J. Magn.
Reson., 94, 9-19.
24.Pashintseva, N. V., Lisitskaya, K. V., Kovalev,
L. I., Eremina, L. S., and Sishkin, S. S. (2015) Proteomic
investigation of proteins in cultivated cells of rhabdomyosarcoma RD
and some other cells of mesenchymal origin, Sovrem. Probl. Nauki
Obrazov., 5.
25.Koushyar, S., Jiang, W. G., and Dart, D. A.
(2015) Unveiling the potential of prohibitin in cancer, Cancer
Lett., 369, 316-322.
26.Fan, W., Yang, H., Liu, T., Wang, J., Li, T. W.
H., Mavila, N., Tang, Y., Yang, J., Peng, H., Tu, J., Annamalai, A.,
Noureddin, M., Krishnan, A., Gores, G. J., Martinez-Chantar, M. L.,
Mato, J. M., and Lu, S. C. (2017) Prohibitin 1 suppresses liver cancer
tumorigenesis in mice and human hepatocellular and cholangiocarcinoma
cells, Hepatology, 65, 1249-1266.