Constitutive Expression of NRAS with Q61R Driver Mutation Activates Processes of Epithelial–Mesenchymal Transition and Leads to Substantial Transcriptome Change of Nthy-ori 3-1 Thyroid Epithelial Cells
D. E. Demin1,2, M. A. Afanasyeva1, A. N. Uvarova1, M. M. Prokofjeva1, A. M. Gorbachova1, A. S. Ustiugova1, A. V. Klepikova3,4, L. V. Putlyaeva1, K. A. Tatosyan1, P. V. Belousov1, and A. M. Schwartz1,2,a*
1Engelhardt Institute of Molecular Biology, Russian Academy of Sciences, 119991 Moscow, Russia2Moscow Institute of Physics and Technology, 141701 Moscow, Russia
3Institute for Information Transmission Problems, Russian Academy of Sciences, 127051 Moscow, Russia
4Belozersky Institute of Physico-Chemical Biology, Lomonosov Moscow State University, 119991 Moscow, Russia
* To whom correspondence should be addressed.
Received October 10, 2018; Revised December 4, 2018; Accepted December 4, 2018
The Q61R mutation of the NRAS gene is one of the most frequent driver mutations of thyroid cancer. Tumors with this mutation are characterized by invasion into blood vessels and formation of distant metastases. To study the role of this mutation in the growth of thyroid cancer, we developed a model system on the basis of thyroid epithelial cell line Nthy-ori 3-1 transduced by a lentiviral vector containing the NRAS gene with the Q61R mutation. It was found that the expression of NRAS(Q61R) in thyroid epithelial cells has a profound influence on groups of genes involved in the formation of intercellular contacts, as well as in processes of epithelial–mesenchymal transition and cell invasion. The alteration in the expression of these genes affects the phenotype of the model cells, which acquire traits of mesenchymal cells and demonstrate increased ability for survival and growth without attachment to the substrate. The key regulators of these processes are transcription factors belonging to families SNAIL, ZEB, and TWIST, and in different types of tumors the contribution of each individual factor can vary greatly. In our model system, phenotype change correlates with an increase in the expression of SNAIL2 and TWIST2 factors, which indicates their possible role in regulating invasive growth of thyroid cancer with the mutation of NRAS(Q61R).
KEY WORDS: thyroid cancer, invasive growth, epithelial–mesenchymal transition, NRAS(Q61R), SNAIL, TWISTDOI: 10.1134/S0006297919040096
Abbreviations: EMT, epithelial–mesenchymal transition; TC, thyroid cancer.
Mutations in the RAS genes (NRAS, KRAS, and
HRAS) are the most frequently occurring driver mutations in
human tumors. They are found in 20-25% of all human tumors [1]. The genes of this family encode small GTPases
transducing signals from growth factor receptors to the RAS-RAF-MEK-ERK
and PI3K-AKT-mTOR signaling pathways. Oncogenic mutations impair the
ability of these proteins to hydrolyze GTP, which results in their
constitutive activation. Prevalence of different mutations in these
genes strongly varies depending on the type of cancer. In thyroid
cancer (TC) samples, mutations have been found mainly in the
NRAS gene (5-10% of the total number of tumors). The most
frequent (77%) NRAS(Q61R) mutation in this gene results in
glutamine (amino acid 61) to arginine substitution in the NRAS protein
[2]. In cases where cells from biopsy of thyroid
nodules carried this mutation, the probability of tumor malignancy was
74-88% [3]. The Q61R mutation in the NRAS
gene most often occurs in samples of follicular thyroid carcinoma and
the follicular variant of papillary thyroid carcinoma [4]. Tumors with mutation in this gene are
characterized by invasion into blood vessels and formation of distant
metastases [5]. Some studies have shown that
NRAS mutations occur in distant metastases more often than in
primary tissues [6, 7].
The important stages of activation of invasive growth of tumor cells are epithelial–mesenchymal transition (EMT) and enhanced anchorage-independent cell growth [8, 9]. Cells with such type of transformation are characterized by enhanced expression of some key regulators of this process: transcription factors of the SNAIL, ZEB, and TWIST families [10, 11]. Transcription factors of these three families regulate expression of a number of genes responsible for cell morphology and establishment of intercellular contacts [11]. Thus, EMT is accompanied by an increase in the levels of vimentin (VIM), fibronectin (FN1), and N-cadherin (CDH2), as well as decrease in the level of E-cadherin (CDH1) and occludin (OCLN) [12, 13]. It is noteworthy that the contribution of each individual transcription factor to the implementation of this process in different tumors may significantly vary [11], and the role of particular factors involved in EMT regulation in thyroid tumors with the NRAS(Q61R) mutation has been poorly studied at present. Previously, it has been shown that well-differentiated thyroid carcinomas are characterized by invasive growth mainly for peripheral cells, and it is difficult to investigate this process on the basis of data obtained for the complete tumor [14].
For studying the processes caused by the appearance of the Q61R mutation in the NRAS gene in TC cells, a model system was developed on the basis of thyroid follicular epithelial cell line Nthy-ori 3-1 transduced by lentiviral vector expressing the respective oncogene. The Nthy-ori 3-1 cell line was obtained from normal primary cells immortalized with SV40 large T antigen [15] and does not carry driver mutations, which makes it possible to comprehensively assess the biological effects of the NRAS(Q61R) mutation.
MATERIALS AND METHODS
Cloning of lentiviral vectors containing wild type NRAS gene-encoding sequence and the sequence with the NRAS(Q61R) mutation. The NRAS gene with the Q61R mutation was cloned using the commercially available plasmid pBabeN-Ras-61K (Addgene, USA) [16] carrying the human NRAS gene-encoding sequence with Q61K mutation. The sequence with the NRAS(Q61R) mutation was obtained using a two-step PCR protocol with 182A>G site-directed mutagenesis in codon 61 of the initial sequence. Analogously, the full-length wild type NRAS gene-encoding sequence was obtained by introducing double substitution 181A>C/182A>G into the NRAS gene sequence with the Q61K mutation. In both cases, BamHI (5′-end) and NotI (3′-end) restriction sites were introduced into the sequences for cloning in the lentiviral vector. (The sequences of primers are given in Table S1 of the Supplement to this article on the website of the journal (http://protein.bio.msu.ru/biokhimiya) and Springer site (Link.springer.com)). Plasmid LeGO-iPuro2 (Lentiviral Gene Ontology Vectors, Germany) carrying a puromycin resistance gene was used as a lentiviral vector.
Thyroid cell line maintenance and transduction by lentiviral vectors. Immortalized Nthy-ori 3-1 thyroid epithelial cells (Sigma, USA) were grown in RPMI-1640 medium (PanEco, Russia) with addition of 10% fetal calf serum (Biosera, France), L-glutamine (2 mM), penicillin and streptomycin, and sodium pyruvate (1 mM) (Thermo Fisher Scientific, USA). This cell line was used to obtain three derivatives transduced by three different variants of lentiviral vectors: initial vector LeGO-iPuro2, vectors iPuro2-NRAS(WT), and iPuro2-NRAS(Q61R) carrying different variants of the human NRAS gene-encoding sequences. Viral particles were obtained as described [17]. Selection on puromycin (final concentration, 1 μg/ml) was performed for 14 days 48 h after the addition of the viral particles. The incorporation of target genes was additionally confirmed by real-time PCR using the primers specific for mRNA of the lentiviral vector (PURO-F/R; Table S1 in Supplement). The data are presented in Fig. S1 (Supplement). The change in the total level of the NRAS gene mRNA in all Nthy-ori 3-1 cell line derivatives was measured by real-time PCR with NRAS-F/R primers (Table S1).
RNA isolation, cDNA synthesis, and quantitative real-time PCR. Total RNA was isolated from different Nthy-ori 3-1 derivatives with ExtractRNA reagent (Evrogen, Russia) according to the manufacturer’s protocol. Reverse transcription was performed with 2 μg of total RNA using an MMLV RT Kit (Evrogen) according to the manufacturer’s protocol. The quantitative PCR analysis was performed as described [18]. The sequences of the primers are presented in the respective section of Table S1.
Western blot analysis. Western blot analysis was performed as described [19]. Cell lysates were mixed at a ratio of 3 : 1 with 4× Laemmli sample buffer, incubated for 5 min at 95°C, and applied to 10% polyacrylamide gel (30 μg of protein per well). The phosphorylated variant of protein Erk1/2 was analyzed with Phospho-p44/42 MAPK (Erk1/2) (Thr202/Tyr204) antibodies (Cell Signaling, USA) diluted 1 : 2000 according to the manufacturer’s protocol; horseradish peroxidase conjugated goat anti-rabbit IgG antibodies (Thermo Scientific, USA) diluted 1 : 30,000 were used as secondary antibodies. The content of total Erk1/2 was analyzed using p44/42 MAPK (Erk1/2) antibodies (Cell Signaling) diluted 1 : 2000 and peroxidase-conjugated goat anti-mouse secondary IgG antibodies (Thermo Scientific) diluted 1 : 30,000.
Measurement of anchorage-independent cell growth. The ability of cells to grow without a substrate was measured by the soft agar assay as described [20]. For this purpose, the substrate of the above-described complete medium for Nthy-ori-3-1 cell maintenance with 0.6% agarose was poured onto the bottom of a 12-well plate. After substrate solidification, the complete medium with 0.3% agarose was poured on top, where the studied Nthy-ori-3-1 cell line derivatives were added (5000 cells per well). After 24 h, the complete medium without agarose was poured on top and changed once in 2-3 days. In a week, the colonies containing more than 25 cells were counted with a LEICA DMI4000B microscope at 100× magnification.
Cell transcriptome analysis. The total RNA of all the studied Nthy-ori 3-1 cell line derivatives was obtained as described. Two independent biological replicates were obtained and analyzed for each of the derivatives containing lentiviral vectors with different variants of the NRAS gene. The cDNA libraries were obtained using the Bioscientific NEXTflex Rapid Directional qRNA-Seq Library Prep kit (Bio Scientific Corporation, USA) according to the manufacturer’s protocol. The libraries were sequenced with Illumina NextSeq (Illumina, USA). Single reads of 75 bp in length were used. The results were processed with CLC Genomics Workbench 8.5.1 with the following parameters: quality factor, 0.005; allowance for two ambiguous nucleotides; removal of one 5′-terminal nucleotide; removal of one 3′-terminal nucleotide; removal of reads with a final length less than 25 bp. The resultant sequences were mapped with CLC Genomics Workbench 8.5.1 for the reference sequence of the Homo sapiens (GRCh38) genome. The mapping was performed with allowance for no more than two mismatches between the nucleotides and the reference sequence. The level of gene expression was determined as a number of reads mapped to the respective gene. Library sizes were normalized as described [18]. Differential gene expression was calculated with DESeq2 1.20.0. The p-values for differential expression are understood as adjusted p-values from DESeq2. Correlation means the linear Pearson correlation coefficient. When comparing expression in the model and in the tumor, correlation was calculated by the logarithmic forms of expression values. The p-values of all correlations were below 10–5. The resultant correlations were compared by Fischer transformation. The initial sequencing data are stored in the NCBI Short Read Archive, project no. PRJNA486710.
RESULTS
Expression of NRAS gene with Q61R mutation in Nthy-ori 3-1 cells activates intracellular signaling cascades RAS-RAF-MEK-ERK and PI3K-AKT-mTOR. The effect of constitutive expression of NRAS(Q61R) on the activation of RAS-RAF-MEK-ERK and PI3K-AKT-mTOR pathways was assessed in the first stage of this work. One of the key steps of activation of the RAS-RAF-MEK-ERK signaling pathway is the phosphorylation of Erk1/2 (p44/42 MAPK) kinase [21]. Western blot analysis showed that transduction of Nthy-ori 3-1 cells by a construct with mutant variant of the NRAS gene actually results in appearance of the phosphorylated form of Erk1/2 kinase in these cells. At the same time, cell transduction by the initial lentiviral vector and the vector carrying the wild type NRAS gene has no effect on phosphorylation of this kinase (Fig. 1a). Thus, the activation of the MAPK cascade is caused exactly by the mutant protein but not by the effects associated with incorporation of the vector into the genome or with overexpression of the NRAS gene. In addition to this signaling cascade, NRAS activates the PI3K-AKT-mTOR signaling pathway. Previously, it was shown that the activation of this cascade is accompanied by enhanced expression of cyclin D1 (CCND1) [22]. Real-time PCR showed that the expression of cyclin D1 is significantly more intensive (more than 5-fold) only under the transduction of Nthy-ori 3-1 cells by a lentivirus carrying the NRAS gene with the Q61R mutation (Fig. 1b). The results of transcription analysis of TC samples [23] demonstarte that the level of CCND1 expression in tumors containing this driver mutation is ~4-6 times higher than in normal tissue (Fig. 1d), which corresponds to the change in gene expression in the presented model line.
Fig. 1. Analysis of the effect of mutant protein NRAS with Q61R mutation on Nthy-ori 3-1 cells. a) Analysis of phosphorylation of protein Erk1/2 (p44/42 MAPK) by the Western blot method. Results of analysis for total and phosphorylated Erk1/2 are given on the top and at the bottom of the figure, respectively. In both cases, application control is presented (Ponceau S staining of the membrane). The samples are denoted as “Empty” for Nthy-ori 3-1 cells not transduced by the lentiviral vector, as “Vector” for cells transduced by the initial vector, as “NRAS WT” and “NRAS Q61R” for cells transduced by the vector carrying the encoding sequence of the wild type NRAS gene and the NRAS gene with Q61R mutation, respectively. b, c) Results of quantitative analysis of mRNA of the CCND1 and FBLN1 genes, respectively. The Nthy-ori 3-1 cell line variants are denoted as in panel (a). The data are normalized for the results obtained for initial Nthy-ori 3-1 cells. Mean values of four independent experiments ± SEM are presented; *, reliable difference from results obtained for non-transduced cells, “Empty” (p < 0.001 by Student’s t-test). d, e) Relative expression of the CCND1 and FBLN1 genes in normal thyroid gland tissue and in thyroid gland tumors carrying the NRAS(Q61R) mutation. The data for calculations were taken from [28]. The presented levels of expression were normalized for the mean values of expression of the respective genes in normal thyroid gland tissue. Mean values for each type of tumor ± SEM are given; *, reliable difference from the results obtained for normal tissue (p < 0.001 by Student’s t-test).
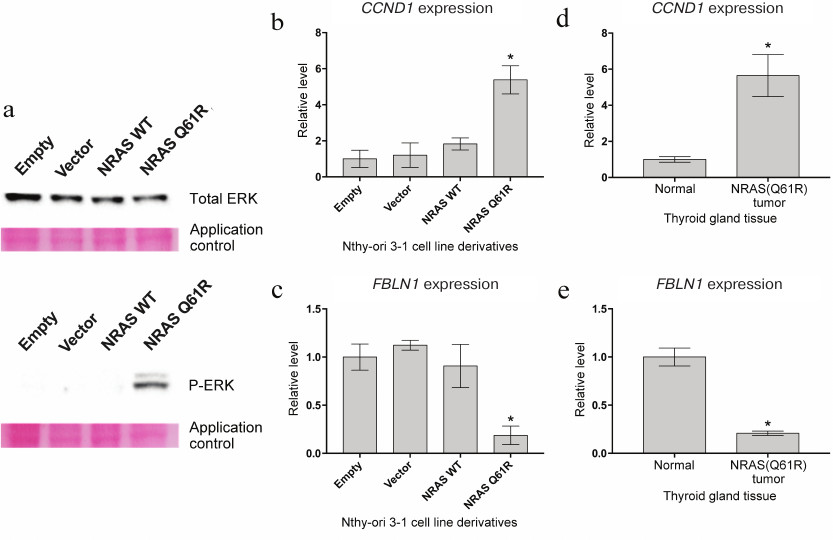
The increased amount of template RNA of a particular gene in the total RNA of the cell population can be evidence of both enhanced expression of this gene in all cells and high gene expression only in a fraction of cells, whereas drastic decrease in expression of this gene in a small group of cells has a weak influence on the average level of its expression. The average level of expression of a particular gene can significantly decrease only if it changes in a considerable portion of the cells in the population. Thus, the change in expression of the gene at a substantial decrease in the level of its mRNA is a better representation of homogeneity of transcription programs of a cell population. Therefore, we additionally studied the level of mRNA in the fibulin 1 (FBLN1) gene, the expression of which in thyroid tumors with Q61R mutation of the NRAS gene is ~5-fold lower compared to normal tissue (according to data from [23]) (Fig. 1e). The data of quantitative RNA assay in Fig. 1c show that the level of expression of fibulin 1 in Nthy-ori 3-1 cells transduced by the vector with the mutant NRAS gene is also ~5-fold lower compared to the initial cell line, which confirms the homogeneity of transcriptomes of the resultant cell population.
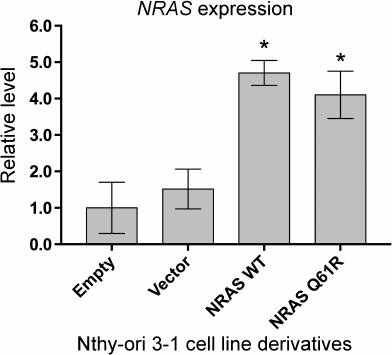
Expression of the NRAS(Q61R) oncogene leads to changes in expression of a number of genes involved in formation of cell–cell contacts, regulation of cell motility, and angiogenesis. Comparative analysis of transcriptomes of the initial Nthy-ori 3-1 cells and its three derivatives transduced by an “Empty” viral vector, as well as vectors containing the wild type NRAS gene and the gene with the Q61R mutation is presented in Table S2, Supplement (with normalized expression of the genes). The correlation between RNA-Seq results obtained for the initial cells and the cells transduced by the “Empty” vector is more than 0.99, suggesting low effect of transduction on the levels of gene expression. The correlation between transcriptome data obtained for the initial cells and the cells transduced by the vectors with the wild type and Q61R-mutated NRAS genes is 0.98 and 0.92, respectively. Both derivatives with overexpression of different NRAS gene variants demonstrate similar levels of mRNA of the NRAS gene, which are ~4-fold higher than its levels in the non-transduced cells and the cells transduced by the “Empty” vector (Fig. 2).
Fig. 2. Quantitative analysis of NRAS gene expression in the Nthy-ori 3-1 cell line derivatives. The samples are denoted as “Empty” for Nthy-ori 3-1 cells not transduced by the lentiviral vector, as “Vector” for cells transduced by the initial vector, as “NRAS WT” and “NRAS Q61R” for cells transduced by the vector carrying the encoding sequence of the wild type NRAS gene and the NRAS gene with Q61R mutation, respectively. The data are normalized by the level of expression of β-actin and divided by gene expression in non-transduced cells. Mean values of four independent experiments ± SEM are presented; *, reliable difference from the results obtained for non-transduced cells, “Empty” (p < 0.01 by Student’s t-test).
The comparison of transcriptomes of these two cell line derivatives made it possible to identify the genes with expression varying only under the influence of overexpression of the oncogene with the studied driver mutation. The comparison of transcriptomes of two derivatives with overexpression of different NRAS gene variants revealed ~1200 differentially expressed genes (p < 0.05) (Table S3, Supplement). The functional annotation of this list of genes was performed using DAVID bioinformatics resources [24, 25] (Tables S4 and S5, Supplement). Partially overlapping functional clusters obtained as a result of analysis contained gene groups such as “Positive Regulation of Endothelial Cell Migration”, “Endothelial Growth Factor Signaling Pathway”, “Extracellular Matrix Receptor Signaling Pathway”, “Focal Adhesion”, “Cell–Cell Contacts”, “Membrane Anchor Proteins”, and integrins. The changes in expression of the genes from these groups may directly influence tumor aggressiveness. For example, the presence of the studied driver mutation in the cells leads to enhanced expression of the FN1 and CDH2 genes involved in the migration of TC cells [26, 27], as well as the VEGFA, NRP1, and NRP2 genes (Table S3) involved in the stimulation of angiogenesis [28, 29]. On the other hand, Nthy-ori 3-1 transduction by the vector carrying NRAS(Q61R) results in reduced expression of PRKCG and enhanced expression of NECTIN3 and WNT5A. These changes in mRNA levels of the above-mentioned three genes are associated with reduced metastatic ability of tumor cells [30-32].
The analysis also showed the enrichment of gene groups “Type I Interferon Signaling Pathways” and “Virus Protection”. A number of works have shown that the AKT-mTOR-STAT signaling pathway plays a key role in transcriptional response to type I interferon [33, 34]. However, our experiment showed a decrease in transcription of some genes (such as OAS2, MX1), the expression of which was expected to increase under the activation of this signaling pathway. According to our data, the level of STAT-induced STAT inhibitors such as the SOCS gene family increases under the constitutive expression of NRAS(Q61R) (Table S3), which may lead to decrease in the activity of the AKT-mTOR-STAT signaling cascade [35].
Thus, the expression of the NRAS(Q61R) oncogene in the human thyroid epithelial cell line leads to changes in expression of a number of genes involved in cell growth and migration processes important for carcinogenesis. The chosen model system was assessed in respect of representing the changes in the transcriptomes of tumors with the respective driver mutation.
Profile of expression of Nthy-ori 3-1 cell line transduced by the vector carrying the NRAS gene with Q61R mutation is similar to profiles of expression of thyroid tumors containing this driver mutation. Our model was verified by comparing its transcriptome with the transcriptomes of tumors containing the same driver mutation and tumors containing another mutation characteristic of TC: BRAF(V600E). For this purpose, we used published data of transcriptome analysis of 57 samples of normal human thyroid tissue, 28 samples of TC with Q61R mutation in the NRAS gene, and 239 samples of tumors with another widespread TC driver mutation, BRAF(V600E) [36]. For more illustrative correlation analysis, we selected the genes with most significantly different expression in tumors and in normal tissue. For each group of tumors, we compiled a list of 500 genes with the most reliable (minimum p-values) changes in expression relative to normal tissue. The correlation between the values of expression of these genes in our model line and in tumors with the NRAS(Q61R) mutation was 0.55; for the values of gene expression in tumors with the BRAF(V600E) mutation, it was 0.38 (p-value of the difference between the correlations was 0.0003), indicating the higher similarity between the model line transcriptome and the transcriptome of tumors with the same driver mutation.
Expression of the NRAS(Q61R) oncogene influences transcription of a number of genes involved in EMT and invasive growth and leads to changes in cell morphology and enhanced anchorage-independent cell growth. The analysis of the transcriptomes of cell lines variants showed that the expression of the NRAS(Q61R) protein has a substantial effect on the level of some genes involved in the regulation of invasive cell growth. As mentioned above, the important steps of activation of invasive growth of tumor cells are the activation of EMT processes and increase in anchorage-independent cell growth. According to our data, expression of the NRAS gene with the Q61R mutation in the thyroid epithelial cell line activates expression of the SNAI2 gene and reduces expression of the SNAI1 gene, which encode SNAIL2 and SNAIL1 proteins, respectively (Fig. 3a). The TWIST2 gene expression also increases in our model system. The expression of some other genes of these families (SNAI3, ZEB1, ZEB2, and TWIST1) does not vary significantly. The expression profiling data show (Fig. 3a) that the transduction of Nthy-ori 3-1 cells by the vector carrying the NRAS gene with the Q61R mutation leads to an increase in mRNA levels of vimentin (VIM), fibronectin (FN1), and N-cadherin (CDH2), which is characteristic of EMT, as well as a decrease in the levels of E-cadherin (CDH1) and occludin (OCLN).
Fig. 3. Analysis of signs of EMT in Nthy-ori 3-1 cells after transduction by vectors carrying the NRAS gene with the Q61R mutation. a) Results of quantitative (transcriptome) analysis of genes involved in EMT and invasive growth processes. The data show the level of mRNA in the cells expressing NRAS(Q61R) normalized by the level of mRNA of the respective genes in Nthy-ori 3-1 cells not transduced by the NRAS gene-carrying vector (p < 0.05 according to DESeq2 calculations). b) Microphotographs (100× magnification) of different Nthy-ori 3-1 cell line variants. The samples are denoted as “Empty” for Nthy-ori 3-1 cells not transduced by the lentiviral vector, as “Vector” for cells transduced by the initial vector, as “NRAS WT” and “NRAS Q61R” for cells transduced by the vector carrying the encoding sequence of the wild type NRAS gene and the NRAS gene with Q61R mutation, respectively. c) Results of testing the cells for ability to grow in soft agar. The data are normalized by the results obtained for Nthy-ori 3-1 cells not transduced by the lentiviral vector. Mean values of four independent experiments ± SEM are presented; *, reliable difference from results obtained for non-transduced cells, “Empty” (p < 0.001 by the Student’s t-test).
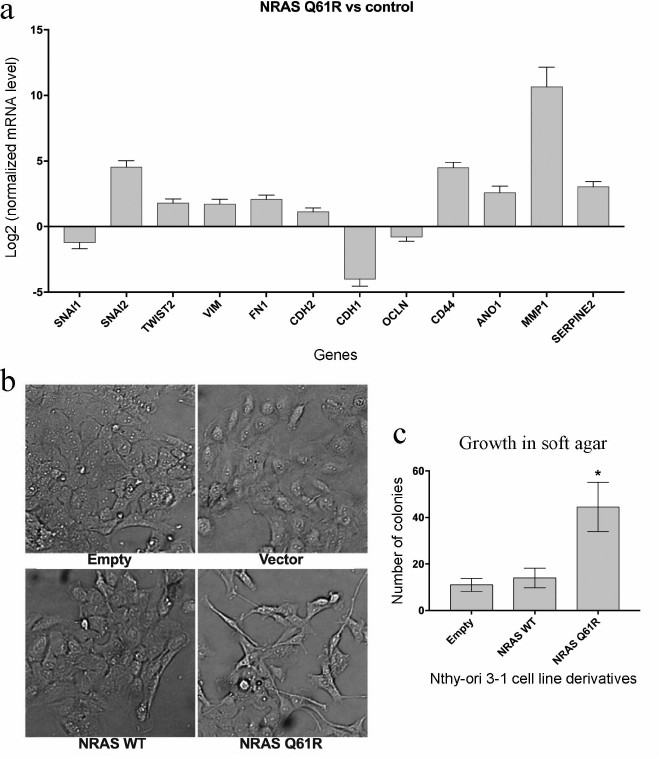
Morphological features of EMT are smaller number of cell–cell and cell–substrate contacts and transition from polygonal to elongated and spindle-shaped cells [37]. The photographs (Fig. 3b) show that cell transduction by the vector with the mutant NRAS gene leads to the changes in cell morphology: the cells become more elongated and have a smaller surface for contacting other cells.
Additionally, the changes in mRNA levels of some other genes involved in the processes of invasive growth and metastasis were analyzed (Fig. 3a). The analysis showed that the expression of the NRAS gene with the Q61R mutation leads to a significant increase in the expression of the CD44 and ANO1 genes encoding adhesion protein and chloride ion carrier, respectively. The association with anchorage-independent tumor cell growth and metastasis has been shown for both proteins [38, 39]. In addition, the expression of the oncogene results in higher level of expression of some genes involved in the rearrangement of intercellular martrix (MMP1, SERPINE2 genes) [40]. The anchorage-independent cell growth was evaluated by soft agar assay [9]. This test (Fig. 3c) shows that the cells expressing the mutant NRAS are most capable of such type of growth. Thus, the expression of the mutant NRAS gene in Nthy-ori 3-1 cells leads to changes in transcription of some genes involved in invasive growth, and these changes are represented in the phenotype of these cells.
DISCUSSION
Although most of the driver mutations in genes of the RAS family are functionally altogether similar, different mutations in various types of epithelial tissue can to a greater or lesser extent activate particular elements of signaling cascades. The studies performed in different model cell lines make it possible to estimate the branching of oncogenic pathways, which may be important for selecting therapeutic targets. For example, it has been previously reported that the activation of EMT in cells with a driver mutation in the HRAS(V12) gene of this family may occur due to suppressed expression of protein p63, and the suppression of its expression per se can be sufficient for phenotypic changes [41]. Another article reported that the activation of EMT in cells with HRAS gene overexpression required high level of expression of the LTB4R2 gene [42]. However, the expression of the respective TP63 and LTB4R2 genes (Table S3) in the Nthy-ori 3-1 cell line used in the present work is at a background level in all derivatives, which does not prevent the cells from demonstrating phenotypic changes in response to expression of the NRAS(Q61R) oncogene. It has also been shown that enhanced expression of transcription factor SNAIL1 plays a key role in the development of EMT in melanoma and lung cancer cells with driver mutations in the RAS and RAF genes [43, 44]. However, our data show that the expression of NRAS(Q61R) leads to a significant decrease in the mRNA level of this factor (Fig. 3a). The difference in EMT regulation between our model and other experimental systems can be accounted for by the type of tissue and particular driver mutation; however, taken together, these data demonstrate a branched regulatory system that needs a complex method for blocking.
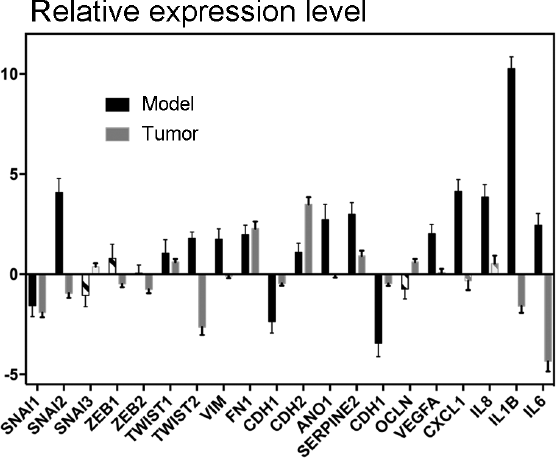
In organisms, tumor cells interact with other cells, which may have a significant effect on cancer cells due to both signaling molecules and immune editing [45]. As a result, the effect of a driver mutation on tumor cell phenotype may vary under the influence of external factors. In this context, it would be interesting to study genes with expression varying in the model cell lines but almost invariable or changing in the opposite direction in real tumors with the respective driver mutation. For example, the data of expression anaylsis of TC samples [36] show that the expression of some genes involved in EMT and cell invasion processes (SNAI2, TWIST2, VIM, and ANO1), as well as a number of genes of proinflammatory cytokines and angiogenesis factors (VEGFA, CXCL1, CXCL8, IL1B and IL6) in tumors with the NRAS(Q61R) mutation, is on average nearly the same or lower than in normal tissue. However, the level of expression of these genes is substantially higher in the Nthy-ori 3-1 cell line containing the NRAS gene with the Q61R mutation (Fig. 4). It is noteworthy that the enhanced expression of the SNAIL, ZEB, and TWIST factors has not been found at all in TC samples with the given mutation (Fig. 4), which is in good agreement with the fact that the phenotype of such tumors is similar to the phenotype of normal tissue. However, the suppressed expression of the VEGFA and SNAI2 genes in TC cells leads to impaired metastasis [46, 47] and the high expression of cytokines CXCL1, CXCL8, and IL1B in TC cells also positively correlates with metastasis frequency [48, 49]. This suggests that the expression of these genes is suppressed in most of the cells of thyroid tumors with the NRAS(Q61R) mutation, while the enhanced expression of these genes under the influence of the given driver mutation occurs only in peripheral tumor cells and during metastasis. This assumption is partially confirmed by the data that the expressions of some genes involved in EMT (VIM and RUNX2) are substantially higher in the periphery of TC samples compared to the central area [20].
Fig. 4. Relative level of expression of genes involved in EMT, angiogenesis, and invasive cell growth. The ratio of gene expression in Nthy-ori 3-1 cells transduced by the vector carrying the NRAS gene with the Q61R mutation and in initial cells is denoted by black “Model”; the ratio of gene expression in tumors with the same mutation and in normal tissue is denoted by gray “Tumor”. Unreliable changes (p > 0.05 in the model, p > 0.001 in the tumor, according to DESeq2 calculations) are denoted by dash-dotted filling.
Thus, the cell line expressing the NRAS gene with the Q61R mutation can be a useful model of TC with the given driver mutation. Our model can be used to study the most motile and migrating tumor cells, which are an important therapeutic target.
Funding
This work was supported by the Russian Science Foundation (project no. 16-15-10423). This project included the production of model cell line derivatives and the analysis of the levels of Erk1/2 protein phosphorylation and gene expression in the resultant derivatives.
The bioinformatic analysis of previously published data on gene expression in thyroid tumors and normal tissue was supported by the Program of Fundamental Research of State Academies of Sciences for 2013-2020 (Subject 01201363817).
Conflict of Interest
The authors declare the absence of conflict of interest.
REFERENCES
1.Goodsell, D. S. (1999) The molecular perspective:
the ras oncogene, Oncologist, 4, 263-264.
2.Fukushima, T., and Takenoshita, S. (2005) Roles of
RAS and BRAF mutations in thyroid carcinogenesis, Fukushima J. Med.
Sci., 51, 67-75.
3.Bhaijee, F., and Nikiforov, Y. E. (2011) Molecular
analysis of thyroid tumors, Endocr. Pathol., 22,
126-133.
4.Nikiforov, Y. E., and Nikiforova, M. N. (2011)
Molecular genetics and diagnosis of thyroid cancer, Nat. Rev.
Endocr., 7, 569-580.
5.Jang, E. K., Song, D. E., Sim, S. Y., Kwon, H.,
Choi, Y. M., Jeon, M. J., Han, J. M., Kim, W. G., Kim, T. Y., Shong, Y.
K., and Kim, W. B. (2014) NRAS codon 61 mutation is associated
with distant metastasis in patients with follicular thyroid carcinoma,
Thyroid, 24, 1275-1281.
6.Melo, M., Gaspar da Rocha, A., Batista, R.,
Vinagre, J., Martins, M. J., Costa, G., Ribeiro, C., Carrilho, F.,
Leite, V., Lobo, C., Cameselle-Teijeiro, J. M., Cavadas, B., Pereira,
L., Sobrinho-Simoes, M., and Soares, P. (2017) TERT, BRAF, and NRAS in
primary thyroid cancer and metastatic disease, J. Clin. Endocr.
Metab., 102, 1898-1907.
7.Sohn, S. Y., Park, W. Y., Shin, H. T., Bae, J. S.,
Ki, C. S., Oh, Y. L., Kim, S. W., and Chung, J. H. (2016) Highly
concordant key genetic alterations in primary tumors and matched
distant metastases in differentiated thyroid cancer, Thyroid,
26, 672-682.
8.Gras, B., Jacqueroud, L., Wierinckx, A., Lamblot,
C., Fauvet, F., Lachuer, J., Puisieux, A., and Ansieau, S. (2014) Snail
family members unequally trigger EMT and thereby differ in their
ability to promote the neoplastic transformation of mammary epithelial
cells, PLoS One, 9, e92254.
9.Cifone, M. A., and Fidler, I. J. (1980) Correlation
of patterns of anchorage-independent growth with in vivo
behavior of cells from a murine fibrosarcoma, Proc. Natl. Acad. Sci.
USA, 77, 1039-1043.
10.Brabletz, T., Kalluri, R., Nieto, M. A., and
Weinberg, R. A. (2018) EMT in cancer, Nat. Rev. Cancer,
18, 128-134.
11.Puisieux, A., Brabletz, T., and Caramel, J.
(2014) Oncogenic roles of EMT-inducing transcription factors, Nat.
Cell. Biol., 16, 488-494.
12.Cano, A., Perez-Moreno, M. A., Rodrigo, I.,
Locascio, A., Blanco, M. J., del Barrio, M. G., Portillo, F., and
Nieto, M. A. (2000) The transcription factor snail controls
epithelial-mesenchymal transitions by repressing E-cadherin expression,
Nat. Cell. Biol., 2, 76-83.
13.Vu, T., and Datta, P. K. (2017) Regulation of EMT
in colorectal cancer: a culprit in metastasis, Cancers (Basel),
9, E171.
14.Vasko, V., Espinosa, A. V., Scouten, W., He, H.,
Auer, H., Liyanarachchi, S., Larin, A., Savchenko, V., Francis, G. L.,
de la Chapelle, A., Saji, M., and Ringel, M. D. (2007) Gene expression
and functional evidence of epithelial-to-mesenchymal transition in
papillary thyroid carcinoma invasion, Proc. Natl. Acad. Sci.
USA, 104, 2803-2808.
15.Lemoine, N. R., Mayall, E. S., Jones, T., Sheer,
D., McDermid, S., Kendall-Taylor, P., and Wynford-Thomas, D. (1989)
Characterization of human thyroid epithelial cells immortalized in
vitro by simian virus 40 DNA transfection, Br. J. Cancer,
60, 897-903.
16.Khosravi-Far, R., White, M. A., Westwick, J. K.,
Solski, P. A., Chrzanowska-Wodnicka, M., Van Aelst, L., Wigler, M. H.,
and Der, C. J. (1996) Oncogenic Ras activation of
Raf/mitogen-activated protein kinase-independent pathways is sufficient
to cause tumorigenic transformation, Mol. Cell. Biol.,
16, 3923-3933.
17.Prokofjeva, M. M., Proshkina, G. M., Lebedev, T.
D., Shulgin, A. A., Spirin, P. V., Prassolov, V. S., and Deyev, S. M.
(2017) Lentiviral gene delivery to plasmolipin-expressing cells using
Mus caroli endogenous retrovirus envelope protein,
Biochimie, 142, 226-233.
18.Schwartz, A. M., Putlyaeva, L. V., Covich, M.,
Klepikova, A. V., Akulich, K. A., Vorontsov, I. E., Korneev, K. V.,
Dmitriev, S. E., Polanovsky, O. L., Sidorenko, S. P., Kulakovskiy, I.
V., and Kuprash, D. V. (2016) Early B-cell factor 1 (EBF1) is critical
for transcriptional control of SLAMF1 gene in human B cells,
Biochim. Biophys. Acta, 1859, 1259-1268.
19.Afanasyeva, M. A., Britanova, L. V., Korneev, K.
V., Mitkin, N. A., Kuchmiy, A. A., and Kuprash, D. V. (2014) Clusterin
is a potential lymphotoxin beta receptor target that is upregulated and
accumulates in germinal centers of mouse spleen during immune response,
PLoS One, 9, e98349.
20.Kim, B. A., Jee, H. G., Yi, J. W., Kim, S. J.,
Chai, Y. J., Choi, J. Y., and Lee, K. E. (2017) Expression profiling of
a human thyroid cell line stably expressing the BRAFV600E mutation,
Cancer Genomics Proteomics, 14, 53-67.
21.Roskoski, R., Jr. (2012) ERK1/2 MAP kinases:
structure, function, and regulation, Pharmacol. Res., 66,
105-143.
22.Pauta, M., Rotllan, N., Fernandez-Hernando, A.,
Langhi, C., Ribera, J., Lu, M., Boix, L., Bruix, J., Jimenez, W.,
Suarez, Y., Ford, D. A., Baldan, A., Birnbaum, M. J., Morales-Ruiz, M.,
and Fernandez-Hernando, C. (2016) Akt-mediated foxo1 inhibition is
required for liver regeneration, Hepatology, 63,
1660-1674.
23.Giordano, T. J., Kuick, R., Thomas, D. G., Misek,
D. E., Vinco, M., Sanders, D., Zhu, Z., Ciampi, R., Roh, M., Shedden,
K., Gauger, P., Doherty, G., Thompson, N. W., Hanash, S., Koenig, R.
J., and Nikiforov, Y. E. (2005) Molecular classification of papillary
thyroid carcinoma: distinct BRAF, RAS, and RET/PTC mutation-specific
gene expression profiles discovered by DNA microarray analysis,
Oncogene, 24, 6646-6656.
24.Huang da, W., Sherman, B. T., and Lempicki, R. A.
(2009) Systematic and integrative analysis of large gene lists using
DAVID bioinformatics resources, Nat. Protoc., 4,
44-57.
25.Huang da, W., Sherman, B. T., and Lempicki, R. A.
(2009) Bioinformatics enrichment tools: paths toward the comprehensive
functional analysis of large gene lists, Nucleic Acids Res.,
37, 1-13.
26.Sponziello, M., Rosignolo, F., Celano, M.,
Maggisano, V., Pecce, V., De Rose, R. F., Lombardo, G. E., Durante, C.,
Filetti, S., Damante, G., Russo, D., and Bulotta, S. (2016)
Fibronectin-1 expression is increased in aggressive thyroid cancer and
favors the migration and invasion of cancer cells, Mol. Cell.
Endocrinol., 431, 123-132.
27.Da, C., Wu, K., Yue, C., Bai, P., Wang, R., Wang,
G., Zhao, M., Lv, Y., and Hou, P. (2017) N-cadherin promotes
thyroid tumorigenesis through modulating major signaling pathways,
Oncotarget, 8, 8131-8142.
28.Peng, X. G., Chen, Z. F., Zhang, K. J., Wang, P.
G., Liu, Z. M., Chen, Z. J., Hou, G. Y., and Niu, M. (2015) VEGF Trapon
inhibits tumor growth in papillary thyroid carcinoma, Eur. Rev. Med.
Pharmacol. Sci., 19, 235-240.
29.Kawakami, T., Tokunaga, T., Hatanaka, H., Kijima,
H., Yamazaki, H., Abe, Y., Osamura, Y., Inoue, H., Ueyama, Y., and
Nakamura, M. (2002) Neuropilin 1 and neuropilin 2 co-expression is
significantly correlated with increased vascularity and poor prognosis
in non-small cell lung carcinoma, Cancer, 95,
2196-2201.
30.Dowling, C. M., Hayes, S. L., Phelan, J. J.,
Cathcart, M. C., Finn, S. P., Mehigan, B., McCormick, P., Coffey, J.
C., O’Sullivan, J., and Kiely, P. A. (2017) Expression of protein
kinase C gamma promotes cell migration in colon cancer,
Oncotarget, 8, 72096-72107.
31.Martin, T. A., Lane, J., Harrison, G. M., and
Jiang, W. G. (2013) The expression of the Nectin complex in human
breast cancer and the role of Nectin-3 in the control of tight
junctions during metastasis, PLoS One, 8, e82696.
32.Kremenevskaja, N., von Wasielewski, R., Rao, A.
S., Schofl, C., Andersson, T., and Brabant, G. (2005) Wnt-5a has tumor
suppressor activity in thyroid carcinoma, Oncogene, 24,
2144-2154.
33.Kaur, S., Kroczynska, B., Sharma, B., Sassano,
A., Arslan, A. D., Majchrzak-Kita, B., Stein, B. L., McMahon, B.,
Altman, J. K., Su, B., Calogero, R. A., Fish, E. N., and Platanias, L.
C. (2014) Critical roles for Rictor/Sin1 complexes in
interferon-dependent gene transcription and generation of
antiproliferative responses, J. Biol. Chem., 289,
6581-6591.
34.Kaur, S., Sassano, A., Majchrzak-Kita, B., Baker,
D. P., Su, B., Fish, E. N., and Platanias, L. C. (2012) Regulatory
effects of mTORC2 complexes in type I IFN signaling and in the
generation of IFN responses, Proc. Natl. Acad. Sci. USA,
109, 7723-7728.
35.Cooney, R. N. (2002) Suppressors of cytokine
signaling (SOCS): inhibitors of the JAK/STAT pathway, Shock,
17, 83-90.
36.Cancer Genome Atlas Research Network (2014)
Integrated genomic characterization of papillary thyroid carcinoma,
Cell, 159, 676-690.
37.Thiery, J. P., and Sleeman, J. P. (2006) Complex
networks orchestrate epithelial-mesenchymal transitions, Nat. Rev.
Mol. Cell. Biol., 7, 131-142.
38.Mueller, N., Wicklein, D., Eisenwort, G., Jawhar,
M., Berger, D., Stefanzl, G., Greiner, G., Boehm, A., Kornauth, C.,
Muellauer, L., Sehner, S., Hoermann, G., Sperr, W. R., Staber, P. B.,
Jaeger, U., Zuber, J., Arock, M., Schumacher, U., Reiter, A., and
Valent, P. (2018) CD44 is a RAS/STAT5-regulated invasion receptor that
triggers disease expansion in advanced mastocytosis, Blood,
132, 1936-1950.
39.Jia, L., Liu, W., Guan, L., Lu, M., and Wang, K.
(2015) Inhibition of calcium-activated chloride channel ANO1/TMEM16A
suppresses tumor growth and invasion in human lung cancer, PLoS
One, 10, e0136584.
40.Drak Alsibai, K., and Meseure, D. (2018) Tumor
microenvironment and noncoding RNAs as co-drivers of
epithelial-mesenchymal transition and cancer metastasis, Dev.
Dyn., 247, 405-431.
41.Yoh, K. E., Regunath, K., Guzman, A., Lee, S. M.,
Pfister, N. T., Akanni, O., Kaufman, L. J., Prives, C., and Prywes, R.
(2016) Repression of p63 and induction of EMT by mutant Ras in mammary
epithelial cells, Proc. Natl. Acad. Sci. USA, 113,
6107-6116.
42.Kim, H., Choi, J. A., and Kim, J. H. (2014) Ras
promotes transforming growth factor-beta (TGF-beta)-induced
epithelial-mesenchymal transition via a leukotriene B4
receptor-2-linked cascade in mammary epithelial cells, J. Biol.
Chem., 289, 22151-22160.
43.Wu, D., Zhao, B., Qi, X., Peng, F., Fu, H., Chi,
X., Miao, Q. R., and Shao, S. (2018) Nogo-B receptor promotes
epithelial-mesenchymal transition in non-small cell lung cancer cells
through the Ras/ERK/Snail1 pathway, Cancer Lett., 418,
135-146.
44.Maiques, O., Barcelo, C., Panosa, A., Pijuan, J.,
Orgaz, J. L., Rodriguez-Hernandez, I., Matas-Nadal, C., Tell, G.,
Vilella, R., Fabra, A., Puig, S., Sanz-Moreno, V., Matias-Guiu, X.,
Canti, C., Herreros, J., Marti, R. M., and Macia, A. (2018) T-type
calcium channels drive migration/invasion in BRAFV600E melanoma cells
through Snail1, Pigment Cell. Melanoma Res., 31,
484-495.
45.Mittal, D., Gubin, M. M., Schreiber, R. D., and
Smyth, M. J. (2014) New insights into cancer immunoediting and its
three component phases – elimination, equilibrium and escape,
Curr. Opin. Immunol., 27, 16-25.
46.Wang, R., Ma, Q., Ji, L., Yao, Y., Ma, M., and
Wen, Q. (2018) miR-622 suppresses tumor formation by directly targeting
VEGFA in papillary thyroid carcinoma, Onco. Targets Ther.,
11, 1501-1509.
47.Sheng, L., Zhang, S., and Xu, H. (2017) Effect of
slug-mediated down-regulation of E-cadherin on invasiveness and
metastasis of anaplastic thyroid cancer cells, Med. Sci. Monit.,
23, 138-143.
48.Borrello, M. G., Alberti, L., Fischer, A.,
Degl’innocenti, D., Ferrario, C., Gariboldi, M., Marchesi, F.,
Allavena, P., Greco, A., Collini, P., Pilotti, S., Cassinelli, G.,
Bressan, P., Fugazzola, L., Mantovani, A., and Pierotti, M. A. (2005)
Induction of a proinflammatory program in normal human thyrocytes by
the RET/PTC1 oncogene, Proc. Natl. Acad. Sci. USA, 102,
14825-14830.
49.Meng, X., Kong, D. H., Li, N., Zong, Z. H., Liu,
B. Q., Du, Z. X., Guan, Y., Cao, L., and Wang, H. Q. (2014) Knockdown
of BAG3 induces epithelial-mesenchymal transition in thyroid cancer
cells through ZEB1 activation, Cell. Death. Dis., 5,
e1092.
Supplementary Figure S1 (PDF)
Supplementary Tables S1-S5 (ZIP)