Algorithm for Extracting Weak Bands Kinetics from the Transient Absorption Spectra of the Rhodobacter sphaeroides Reaction Center
R. A. Khatypov1,a*, A. M. Khristin1, L. G. Vasilyeva1, and V. A. Shuvalov1,2
1Institute of Basic Biological Problems, Pushchino Scientific Center for Biological Research, Russian Academy of Sciences, 142290 Pushchino, Moscow Region, Russia2Semenov Institute of Chemical Physics, Russian Academy of Sciences, 119991 Moscow, Russia
* To whom correspondence should be addressed.
Received February 15, 2019; Revised March 21, 2019; Accepted March 21, 2019
An algorithm to extract kinetics of the ion radical bands from the strong absorption background in the transient absorption spectra of the Rhodobacter sphaeroides reaction centers upon femtosecond excitation of the primary electron donor is suggested. The rising kinetics of the transient absorption band at 1020 nm and the bleaching kinetics of the 545-nm band constructed using the proposed method are adequately fitted by the kinetic equations for sequential electron transfer from the excited primary donor to the BA (monomeric bacteriochlorophyll) molecule, and then to the HA (bacteriopheophytin serving as an electron acceptor) molecule with the rate constants of 3.5 ± 0.2 and 0.8 ± 0.1 ps, respectively. The kinetics of the bacteriochlorophyll absorption band at 600 nm shows both the ultrafast bleaching of the P870 dimer and slower bleaching of the BA monomer due to its transition to the anion radical. The plotted kinetics of the ion radical bands is in agreement with the concentration profiles of the charge-separated states produced by the global target analysis of experimental data using the model of sequential electron transfer in the reaction centers.
KEY WORDS: femtosecond spectroscopy, bacterial reaction centers, electron transferDOI: 10.1134/S0006297919060075
Abbreviations: ΔΑ, absorbance changes; ΔGauss, the fraction of Gauss absorption band changes; BA, monomeric BChl in the active chain of cofactors; BChl, bacteriochlorophyll; HA, bacteriopheophytin serving as an electron acceptor; P, primary electron donor; QA, primary quinone acceptor; QB, secondary quinone acceptor; RC, reaction center.
Photosynthetic reaction centers (RCs) of Rhodobacter sphaeroides
are transmembrane protein complexes consisting of three subunits (L, M,
and H) and ten electron transfer cofactors that mediate the ultrafast
photophysical processes of the light energy transformation into the
energy of charge-separated states. The electron transfer cofactors
include two bacteriochlorophylls (BChls) forming the primary electron
donor dimer (P), two monomeric bacteriochlorophylls (BA and
BB), two bacteriopheophytins (HA and
HB), two quinones (QA and QB),
non-heme iron atom, and carotene molecule. The cofactors are organized
into two pseudosymmetric chains A and B with only A chain being active
[1, 2].
It is known that the transmembrane electron transfer from the excited donor P* to the quinone molecule QA occurs in the RCs upon illumination. Nowadays it is generally accepted that the transmembrane electron transfer proceeds via a series of ultrafast reactions involving the BA and HA molecules from the active cofactor chain as intermediate electron acceptors. It is quite challenging to identify the P+BA– state experimentally because the rate of electron transfer to the BA molecule is slower than the rate of electron transfer from BA– to HA [3, 4]. This results in a low population of the P+BA– state, which does not exceed several tens of percent. Another problem relates to the fact that the spectrum of the P+BA– state is masked by the spectra of other states, including P*. Identification of the minor band of the BA– anion radical at 1020 nm in the transient absorption spectra provided the basis for verification of the four-component model in which the BA molecule is the primary electron acceptor [5, 6]. According to this model, the transmembrane electron transfer occurs from the excited donor P* to the BA molecule with the rate constant of ~3 ps, which is followed by its transfer to the HA molecule with the rate constant of ~1 ps and next to the QA molecule with the rate constant of ~200 ps.
![]()
Recently, researchers investigating the primary processes of charge separation in the photosynthetic RCs often perform the global analysis of the transient absorption spectra measured with a femtosecond resolution [7] in order to describe an entire set of experimental data using mathematical and kinetic models.
This method allows approximating experimental data with the help of various models: (i) sequential electron transfer model [8-11]; (ii) model of electron transfer with consideration of reversibility of the charge separation reactions [8-10]; and (iii) model of charge separation via two deactivation channels in the heterogeneous environment of protein cofactors in the RC [10]. It must be noted that extraction of the short-lived states using global analysis technique is difficult if the excitation pulse duration is sufficiently short and coherent effects are observed. Hence, in order to suggest an adequate physical model, global analysis requires additional information on the processes of charge separation.
In a number of cases, analysis of kinetics of absorption changes ΔΑ at a selected wavelength still remains relevant. However, such analysis can be complicated by the contribution of various overlapping spectral components. Exponential analysis of the complex kinetics of the absorption changes ΔΑ at 600 nm was suggested by Carter et al. [12] as one of some approaches for estimating the quantum yield of the P+HB– state formation in the mutant RC from Rhodobacter capsulatus. Another approach for solving the problem of overlapping bands is construction of kinetics of the BA– anion radical at 1020 nm using approximation of the spectral background by curved line over the wide wavelength range [13]. In this work, we suggest an alternative method for the extraction of kinetics of individual weak absorption bands, including the short-lived ones, followed by analysis of this kinetics within the framework of the sequential electron transfer model.
MATERIALS AND METHODS
Reaction centers (RCs) were isolated from Rba. sphaeroides as described previously [14]. After that, the RCs were suspended in 20 mM Tris-HCl (pH 8.0) containing 0.1% (v/v) Triton X-100 and concentrated to the optical density 0.5 at 870 nm (optical path length, 1 mm). The absorption spectra of the RCs were recorded with a UV1800 spectrophotometer (Shimadzu, Japan).
Detailed description of the femtosecond laser spectrometer has been presented by us in [15]. Femtosecond light pulses (~35 fs, ~3 mJ) were produced using a femtosecond MaiTai SP laser with a Spitfire Ace regenerative amplifier (Spectra-Physics, USA). The light with the wavelengths >850 nm was cut off from the continuum produced on the sapphire with an RG850 optical filter (Newport, USA) for excitation of the primary electron donor at 870 nm. The measuring beam was divided into the probing and reference ones. The probing and reference pulses after the rotating cuvette (1 mm thickness) were first directed to a Spectra Pro 2300i spectrograph and next to a Pixis 400BR CCD camera (Princeton Instruments, USA) for recording the spectra in the 450-720 or 750-1100 nm ranges. The relative polarization of the excitation pulse was parallel to the measuring pulse. The cuvette rotation frequency and the excitation frequency (10 Hz) were selected in such a way that each excitation pulse illuminated a new portion of RCs. The intensity of the excitation pulses was attenuated to excite less than 20% RCs in the sample. All measurements were carried out at room temperature.
Global analysis of the transient absorption spectra was performed with the Glotaran program [16].
Algorithm for extraction of the spectral bands kinetics. The appearance of absorption bands in the transient spectra of the electron transport chain components at different delay times can be observed upon femtosecond excitation of the primary electron donor. Let us assume that the component absorption appears as a symmetric Gaussian band. The evolution of this spectral component in time is reflected in the kinetics of absorption changes ΔΑ in the absorption band maximum. On the other hand, one can always find A and B points in the vicinity of the absorption maximum that are located at equal distances δ from the maximum (Fig. 1, curve 1). It is obvious that due to the symmetry of the band, the mean wavelength value for the points A and B is the wavelength of the absorption maximum, and the mean absorption for the points A and B is the midpoint of the AB segment. The difference in optical density at the absorption maximum and at the midpoint of the AB segment is the fraction of the Gaussian band amplitude with the kinetics of changes ΔGauss being the same as the kinetics of absorption changes ΔΑ in the band maximum, but less in amplitude.
Fig. 1. Model of symmetric Gaussian band in the transient absorption spectra: 1) without background; 2) with linear spectral background.
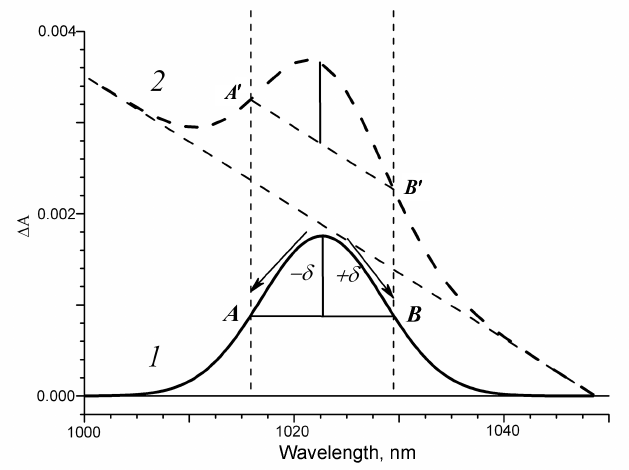
Various other spectral components contribute to the absorption within any absorption region, forming the background that changes in time. Hence, at any time delay, the optical density in the absorption band maximum constitutes the sum of the optical densities of the band and its background. That is why the time course of absorption changes ΔΑ at the absorption band maximum includes the kinetics of the band itself and of the background. Let us assume that the spectral background within a certain wavelength range is linear. In the case of arbitrary time delay and background represented by a straight line, the supplementary straight line that is parallel to the background will cross the Gaussian absorption bands in points A′ and B′ located at equal distances from the absorption band maximum. It is easy to see that for different delay times, the segment A′B′ always remains parallel to the background, and in the case when the band is absent, it is located on the background (Fig. 1, curve 2). If the vector half-sum of the ΔΑ kinetics at the points A′ and B′ is subtracted from the ΔΑ kinetics at the absorption band maximum, we obtain as a result a vector difference that represents the same fraction of the spectral band for each time delay. In this case, the ΔGauss kinetics constructed using the above described approach will be the kinetics of the band spectral fraction independent on the rate constant of the linear background amplitude and slope changes.
In the case when the spectral background displays a curvature within a certain wavelength range that does not change with time, this curvature will not affect the ΔGauss kinetics but only shift it along the optical density axis. And only in the case when the background curving changes in time, it introduces distortions to the ΔGauss kinetics, but these distortions are significantly smaller than the contribution of the entire spectral background as a whole.
Model of sequential electron transfer in RCs. According to the sequential model of charge separation in the RC complexes of purple bacteria, electron transfer from the excited primary donor P* to the BA molecule occurs with the rate constant k1 under exposure to light within a picosecond time scale, and the next electron is transferred from BA to bacteriopheophytin HA with the rate constant k2:
![]()
At the initial time, [P*] = a, [BA–] = 0, [HA–] = 0. Considering that a single electron is transferred during the elementary act of charge separation, the mass balance equation is: [P*] + [BA–] + [HA–] = a.
The system of differential equations for the electron transfer components is the following:
Solving this system of equations allows producing equations of the kinetic curves for the concentrations of P*, BA–, and HA–:
It can be seen from the presented equations that the P* concentration decreases exponentially with time, the concentration of BA– first increases reaching the maximum and then decreases to zero, and the concentration of HA– increases reaching the value a.
RESULTS AND DISCUSSION
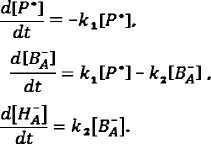
The kinetics of the absorbance changes (ΔΑ) and in the fraction of ΔGauss amplitude in the absorption region of the BA– anion radical in Rba. sphaeroides RCs is presented in Fig. 2. The kinetics of absorption changes ΔΑ1020 (Fig. 2a) is difficult to assign to the intermediate electron acceptor, as it does not decay in time up to several nanoseconds (data not shown) [4], which is related to the fact that other spectral components contribute significantly to the absorption at 1020 nm forming the background [17]. Indeed, negative absorption changes are observed at delay times less than one picosecond that are due to the stimulated emission at 935 nm, and positive changes due to the absorption of the primary electron donor cation radical are observed at the delay times of tens of picoseconds.
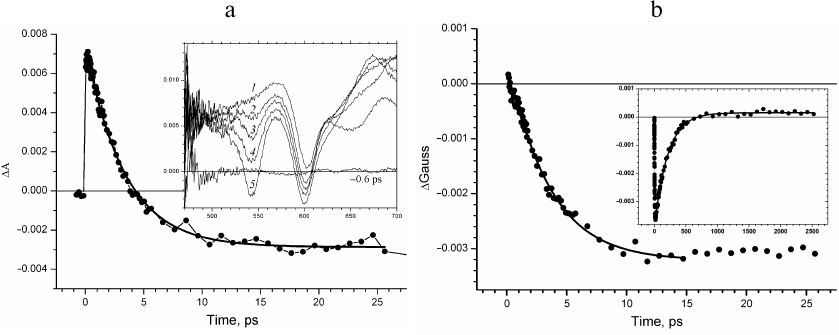
Fig. 2. a) Kinetics of absorption changes ΔΑ at 1020 nm. Inset, transient absorption spectra recorded at delay times 0.3 (1), 0.53 (2), 0.85 (3), 1.5 (4), 3.7 (5), and 10.6 ps (6). b) Kinetics of the fraction of ΔGauss spectral band at 1020 nm constructed at the wavelength ranges δ = ± 15 nm (1), δ = ± 10 nm (2), and δ = ± 5 nm (3). Approximation of the kinetics with the Eq. (2) is presented by solid lines.
Evolution of the absorption band at 1020 nm occurs in the presence of spectral background changing with time (Fig. 2a, inset). The presence of this background at delay times up to tens of femtoseconds is due to the positive absorption at 1100 nm and negative absorption of the stimulated emission at 935 nm. The sum of the positive and negative Gaussian functions that form the background for the narrow wavelength range around 1020 nm can be presented in the first approximation as a straight line. The amplitudes of these spectral bands decrease at the delay times less than tens of picoseconds, which results in the changes in the background slope; absorption of the primary electron donor cation radical appears, which causes an increase in the background amplitude. This consideration describes the evolution of the absorption band of the BA– anion radical occurring over the linear background with the slope and amplitude changing significantly with time. The kinetics of changes in the fraction of the spectral absorption band (ΔGauss) at 1020 nm constructed for the wavelength regions δ = ± 15 nm (curve 1), δ = ± 10 nm (curve 2), and δ = ± 5 nm (curve 3) is presented in Fig. 2b. The decrease of δ results in the decrease of the signal-to-noise ratio. It was shown (Fig. 2b) that the time course of the constructed ΔGauss kinetics did not depend on the level of experimental noise unavoidable during measuring of the transient absorption spectra. The ΔGauss kinetics at all δ values is characteristic for the intermediate electron acceptor. However, the decrease in the signal-to-noise ratio results in the increase of the error in the determination of time constants. This kinetics can be adequately approximated with the Eq. (2) for the intermediate electron acceptor that accepts electron with the rate constant of 3.5 ± 0.2 ps and transfers electron with the rate constant of 0.8 ± 0.1 ps, which is in good agreement with the rate constants for the BA molecule in the model of sequential electron transfer [8, 11].
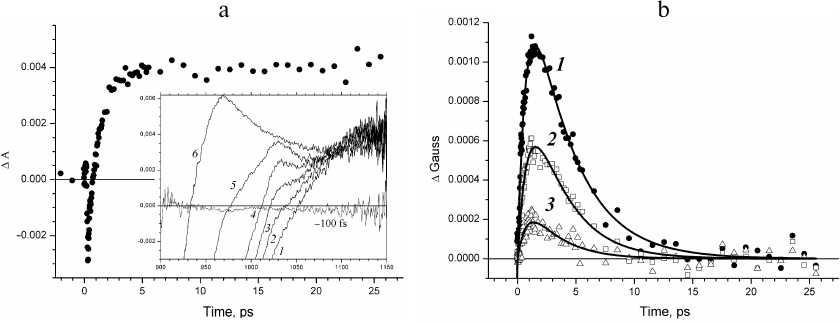
The kinetics of absorption changes ΔΑ and the kinetics of the ΔGauss band change in the region of QX transition in BChl at 600 nm are compared in Fig. 3. An instant increase in the absorption can be seen in the time course of the absorption change ΔΑ00 following the femtosecond excitation of P870 due to the excited state absorption of the primary electron donor, which is likely higher in the amplitude than the bleaching absorption band at 600 nm (Fig. 3a). Further, in the ΔΑ kinetics an exponential decay in the picosecond time scale with a lifetime of ~3.5 ps is observed, which is due to the decrease in the concentration of the excited primary electron donor P870*. At the same time, it can be seen in the inset in Fig. 3a that the absorption band at 600 nm bleaches completely in the transient absorption spectra within the interval of ~0.1 ps. Hence, the kinetics of absorption changes ΔΑ in the region of the QX transition of BChl at 600 nm is predominantly due to the evolution of the excited primary electron donor.
Fig. 3. a) ΔΑ kinetics at 600 nm recorded in time interval from –2 to 27.5 ps. Exponential approximation of the kinetics is depicted by solid line. Inset, transient absorption spectra recorded at delay times –0.5 (1), –0.15 (2), –0.05 (3), 0.05 (4), and 0.1 ps (5). b) Kinetics of changes in the fraction of the ΔGauss spectral band at 600 nm (wavelength range δ = ± 10 nm) constructed for times from –2 to 27.5 ps. Inset, ΔGauss kinetics at 600 nm constructed for delay times from –20 ps to 2.5 ns.
The kinetics of changes in the ΔGauss band absorption at 600 nm constructed for the wavelength range δ = ± 10 nm represents evolution of the spectral band at 600 nm without the primary electron donor contribution (Fig. 3b). The kinetics shows instant (~60 fs) bleaching of the QX absorption band of the P870 dimer related to the primary donor transition to the excited state. Further, within the picosecond time scale and up to 2.5 ns (Fig. 3b, inset), the amplitude of the ΔGauss bleaching does not change because the excited primary electron donor passes electron to the active chain of cofactors with the quantum yield close to one and is transformed into the cation radical form P870+.
The additional increase of bleaching observed in the ΔGauss kinetics in the early delay times has attracted our attention (Fig. 3b, inset). Considering that the level of the 600-nm band in the nanosecond time scale is due to absorption of the two BChl molecules of the special pair, this increase is likely associated with the third BChl. If one assumes that the dipole strength of the QX transitions of the four BChl molecules in the RC are comparable, it is possible to estimate the bleaching of this third BChl molecule at a level of only 20%, in contrast to the first two molecules. The increase of bleaching reaches the maximum at the delay time of 1.6 ps and decreases afterwards within ~10 ps (Fig. 3b). The kinetics of this additional component replicates the kinetics of the spectral band at 1020 nm (Fig. 2b) and is likely due to the bleaching of the QX absorption band of the BA molecule during its transformation into the anion radical form. Comparison of Figs. 3a and 3b allows concluding that the femtosecond bleaching of the absorption band of the primary electron donor and the nanosecond bleaching of the BA molecule due to the electron transfer to it are masked in the kinetics of ΔΑ at 600 nm by changes in the absorption of the excited primary electron donor, while in the ΔGauss kinetics, these changes are clearly visible.
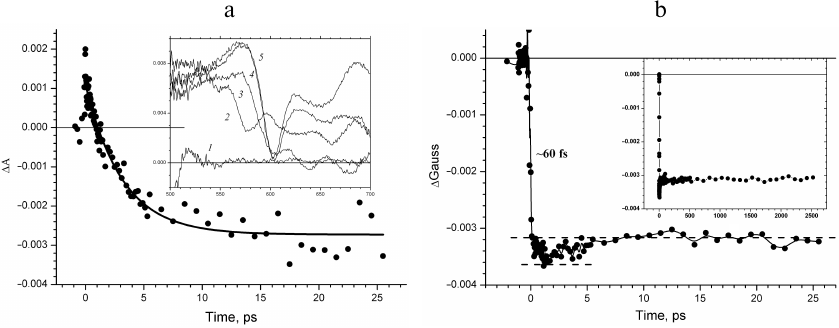
The kinetics of absorption changes ΔΑ in the QX region of bacteriopheophytin transition at 545 nm is presented in Fig. 4a. The fast increase in the absorption is due to the absorption of the excited primary electron donor. The decrease in the absorption related both to the decrease in the concentration of excited P870* and bleaching of the bacteriopheophytin HA absorption band occurs within the picosecond time scale (Fig. 4a, inset) [18].
No fast processes are observed in the kinetics of the ΔGauss band changes at 545 nm (Fig. 4b). Bleaching of the 545-nm band is observed over the picosecond time scale, which is due to the fact that the HA molecule accepts an electron and is transformed into the anion radical form HA–. A slight bend is observed in the kinetics of the band bleaching at 545 nm at the early time delays, which differs it from the exponential kinetics. Indeed, such kinetics can be perfectly fitted by the Eq. (3) for the secondary electron acceptor with the rate constants of 3.4 ± 0.2 and 0.7 ± 0.1 ps. All these observations allow concluding that the HA molecule exhibits the properties of the secondary rather than primary electron acceptor. The fact that slight relaxation related to the electron transfer to the following quinone acceptor QA can be observed at time delays >15 ps is worth mentioning.
Fig. 4. a) ΔΑ kinetics at 545 nm recorded for times from –2 to 27.5 ps. Inset, transient absorption spectra recorded for the delay times 0.1 (1), 1.0 (2), 2.0 (3), 3.0 (4), and 8.0 ps (5). b) Kinetics of changes of the fraction of ΔGauss spectral band at 545 nm (wavelength range δ = ± 10 nm) constructed for times from –2 to 27.5 ps. Approximation of the kinetics with Eq. (3) is depicted with solid line. Inset, ΔGauss kinetics at 545 nm constructed for times from –20 ps to 2.5 ns.
The kinetics of ΔGauss at 545 nm constructed for the time range up to 2.5 ns is presented in the inset in Fig. 4b. It can be seen in this time scale, that the HA molecule also acts as an intermediate acceptor of in the electron transition from the excited donor P* to the quinone acceptor QA. The kinetics presented in the Fig. 4b inset can be fitted adequately with the Eq. (2) with the rate constants 3.5 ± 0.4 and 210 ± 10 ps.
The results produced in this study allows constructing the time dependences of the concentrations of P*, P+BA–, and P+HA–, i.e., obtaining experimentally derived kinetic curves of the states with separated charges (Fig. 5a). The kinetics of absorption changes ΔΑ at 930 nm (Fig. 5a, curve 1) due to the stimulated emission decay reflects evolution of the primary electron donor excited state. The kinetics of the ΔGauss spectral band at 545 nm (Fig. 5a, curve 3) represents evolution of the P+HA– state. We have normalized these curves to one, because the quantum yield of the P+HA– charge separation in the RC is close to one. The kinetics of the ΔGauss spectral band at 1020 nm (Fig. 5a, curve 2) represents evolution of the P+BA– state. This kinetics has been normalized to 0.2 as the QX absorption band of the BA molecule at 600 nm bleaches only by ~20%.
Fig. 5. a) Kinetics of ΔΑ at 928 nm (1) and ΔGauss at 1020 nm (2) and 545 nm (3) constructed for times from –2 to 27.5 ps. b) Concentration profiles of the P* (1), P+BA– (2), and P+HA– (3) states obtained using global analysis of experimental data.
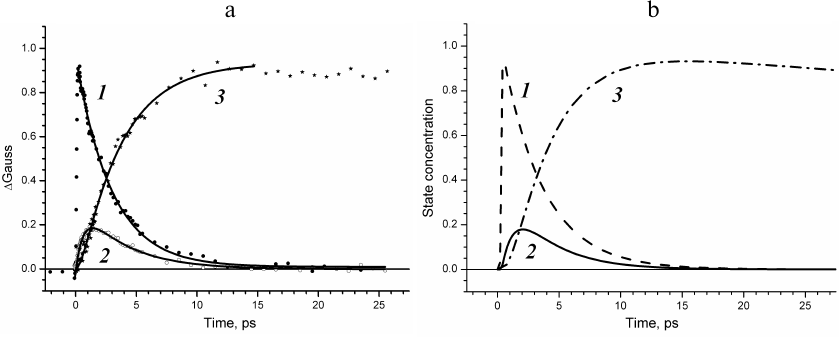
At the same time, we performed global analysis of the entire set of experimental data in the frameworks of several kinetic models: (i) model of electron transfer with sequentially decreasing rate constants k1 > k2 > k3 [9]; (ii) model of electron transfer with rate constants of forward reactions k12 < k23 > k34 considering the reaction of charge recombination in the P+HA– state occurring via the BA molecule with recombination rate constants k21 = 1/12 ps and k32 = 1/21 ps [8, 10], and (iii) model of sequential electron transfer with the rate constants k1 < k2 > k3 without consideration of reverse reactions [11]. The concentration profiles of the P*, P+BA–, and P+HA– states were derived for all these models. It was found that the profile of the P+BA– state concentration for the model with sequentially decreasing rate constants at the maximum reaches ~60% rather than 20%. For the model of electron transfer considering reverse reactions, the occupancy of the P+BA– state is maintained for an extended time period, and this state can be observed within the time interval up to several hundred picoseconds. Good agreement of the experimentally measured kinetics of the weak absorption bands with the modeled concentration profiles of the charge separated states was observed only for the sequential model of electron transfer with the rate constants of 3, 1, and 200 ps without considering reverse reactions.
Comparison of Figs. 5a and 5b reveals that the kinetics of weak absorption bands ΔGauss at 1020 and 545 nm and the ΔΑ kinetics at 930 nm constructed without any apriori models accurately show the concentration profiles of the charge separated states for the sequential four-component model of the electron transfer in the RC.
This allows concluding that the kinetic curves constructed using the algorithm suggested in this work are only slightly distorted by the contribution of the accompanying spectral components and satisfactorily reproduce the evolution of the concentrations of the charge separated states. These data further confirm the results obtained previously by our research group [6, 13] and in the recent study by Dominguez et al. [11] according to which sequential homogenous electron transfer occurs in the RC that involves the BA molecule as the primary electron acceptor [19]. This is also in agreement with the fact that both the kinetics of the 1020-nm band and the profile of the P+BA– state concentration in this model decay within the time interval up to ~10 ps. Meanwhile, in the model of reverse electron transfer, the occupancy of the P+BA– state is maintained for up to several hundreds of picoseconds [8, 10]. The presented data also indicate that following excitation of the electron donor with a pulse duration ~30 fs, the charge separation in the RC at room temperature proceeds according to the nonadiabatic mechanism.
Funding. This work was supported by the State Budget Project no. AAAA-A17030110140-5 and in part by the Russian Foundation for Basic Research (projects 17-00-00207(K) and 17-00-00209(K)).
Acknowledgements. The authors are grateful to A. Ya. Shkuropatov and A. A. Zabelin for their help during the study and discussion of the results.
Conflict of interest. The authors declare no conflict of interest in financial or any other sphere.
Ethical approval. This article does not contain any studies with human participants or animals performed by any of the authors.
REFERENCES
1.Kirmaier, C., and Holten, D. (1987) Primary
photochemistry of reaction centers from the photosynthetic purple
bacteria, Photosynth. Res., 13, 225-260, doi:
10.1007/BF00029401.
2.Woodbury, N. W., and Allen, J. P. (2004) in
Anoxygenic Photosynthetic Bacteria (Blankenship, R. E., Madigan,
M. T., and Bauer, C. E., eds.) Kluwer Academic Publishers, New York,
pp. 527-557, doi: 10.1007/0-306-47954-0_24.
3.Holzapfel, W., Finkele, U., Kaiser, W., Oesterhelt,
D., Scheer, H., Stilz, H. U., and Zinth, W. (1989) Observation of a
bacteriochlorophyll anion radical during the primary charge separation
in a reaction center, Chem. Phys. Lett., 160, 1-7, doi:
10.1016/0009-2614(89)87543-8.
4.Arlt, T., Schmidt, S., Kaiser, W., Lauterwasser,
C., Meyer, M., Scheer, H., and Zinth, W. (1993) The accessory
bacteriochlorophyll: a real electron carrier in primary photosynthesis,
Proc. Natl. Acad. Sci. USA, 90, 11757-11761, doi:
10.1073/pnas.90.24.11757.
5.Kennis, J. T., Shkuropatov, A. Y., van Stokkum, I.
H. M., Gast, P., Hoff, A. J., Shuvalov, V. A., and Aartsma, T. J.
(1997) Formation of a long-lived
P+BA– state in plant
pheophytin-exchanged reaction centers of Rhodobacter sphaeroides
R26 at low temperature, Biochemistry, 36, 16231-16238,
doi: 10.1021/bi9712605.
6.Yakovlev, A. G., Shkuropatov, A. Y., and Shuvalov,
V. A. (2000) Nuclear wavepacket motion producing a reversible charge
separation in bacterial reaction centers, FEBS Lett.,
466, 209-212, doi: 10.1016/S0014-5793(00)01081-4.
7.Van Stokkum, I., Larsen, D., and van Grondelle, R.
(2004) Global and target analysis of time-resolved spectra, Biochim.
Biophys. Acta, 1657, 82-104, doi:
10.1016/j.bbabio.2004.04.011.
8.Holzwarth, A. R., and Muller, M. G. (1996)
Energetics and kinetics of radical pairs in reaction centers from
Rhodobacter sphaeroides: a femtosecond transient absorption
study, Biochemistry, 35, 11820-11831, doi:
10.1021/bi9607012.
9.Kakitani, Y., Hou, A., Miyasako, Y., Koyama, Y.,
and Nagae, H. (2010) Rates of the initial two steps of electron
transfer in reaction centers from Rhodobacter sphaeroides as
determined by singular-value decomposition followed by global fitting,
Chem. Phys. Lett., 492, 142-149, doi:
10.1016/j.cplett.2010.03.071.
10.Zhu, J., van Stokkum, I. H. M., Paparelli, L.,
Jones, M. R., and Groot, M. L. (2013) Early bacteriopheophytin
reduction in charge separation in reaction centers of Rhodobacter
sphaeroides, Biophys. J., 104, 2493-2502, doi:
10.1016/j.bpj.2013.04.026.
11.Dominguez, P., Himmelstoss, M., Michelmann, J.,
Lehner, F., Gardiner, A. T., Cogdell, R. J., and Zinth, W. (2014)
Primary reactions in photosynthetic reaction centers of Rhodobacter
sphaeroides – time constants of the initial electron
transfer, Chem. Phys. Lett., 601, 103-109, doi:
10.1016/j.cplett.2014.03.085.
12.Carter, B., Boxer, S. B., Holten, D., and
Kirmaier, C. (2012) Photochemistry of a bacterial photosynthetic
reaction center missing the initial bacteriochlorophyll electron
acceptor, J. Phys. Chem. B, 116, 9971-9982, doi:
10.1021/jp305276m.
13.Yakovlev, A. G., Shkuropatov, A. Y., and
Shuvalov, V. A. (2002) Nuclear wavepacket motion between P* and
P+BA– potential surfaces with
subsequent electron transfer to HA in bacterial reaction
centers. 1. Room temperature, Biochemistry, 41,
2667-2674, doi: 10.1021/bi0101244.
14.Shuvalov, V. A., Shkuropatov, A. Ya., Kulakova,
S. M., Ismailov, M. A., and Shkuropatova, V. A. (1986) Photoreactions
of bacteriopheophytins and bacteriochlorophylls in reaction centers of
Rhodopseudomonas sphaeroides and Chloroflexus
aurantiacus, Biochim. Biophys. Acta, 849, 337-346,
doi: 10.1016/0005-2728(86)90145-3.
15.Khatypov, R. A., Khristin, A. M., Fufina, T. Yu.,
and Shuvalov, V. A. (2017) An alternative pathway of light-induced
transmembrane electron transfer in photosynthetic reaction centers of
Rhodobacter sphaeroides, Biochemistry (Moscow),
82, 692-697, doi: 10.1134/S0006297917060050.
16.Snellenburg, J. J., Laptenok, S. P., Seger, R.,
Mullen, K. M., and van Stokkum, I. H. M. (2012) Glotaran: a Java-based
graphical user interface for the R package TIMP, J. Stat. Soft.,
49, 1-22, doi: 10.18637/jss.v049.i03.
17.Sporlein, S., Zinth, W., and Wachtveilt, J.
(1998) Vibrational coherence in photosynthetic reaction centers
observed in the bacteriochlorophyll anion band, J. Phys. Chem.
B, 102, 7492-7496, doi: 10.1021/jp9817473.
18.Heller, B., Holten, D., and Kirmaier, C. (1996)
Effects of Asp residues near the L-side pigments in bacterial reaction
centers, Biochemistry, 35, 15418-15427, doi:
10.1021/bi961362f.
19.Shuvalov, V. A., and Duysens, L. N. M. (1986)
Primary electron transfer reactions in modified reaction centers from
Rhodopseudomonas sphaeroides, Proc. Natl. Acad. Sci. USA,
83, 1690-1694, doi: 10.1073/pnas.83.6.1690.