Jasmonic Acid Induces Endoplasmic Reticulum Stress with Different Outcome in Cultured Normal and Tumor Epidermal Cells
M. S. Vildanova1,a*, A. A. Saidova1, A. I. Fokin2, D. M. Potashnikova1, G. E. Onishchenko1, and E. A. Smirnova1
1Lomonosov Moscow State University, Faculty of Biology, 119991 Moscow, Russia2Belozersky Institute of Physico-Chemical Biology, Lomonosov Moscow State University, 119992 Moscow, Russia
* To whom correspondence should be addressed.
Received March 22, 2019; Revised May 27, 2019; Accepted May 27, 2019
Plant hormones produce cytotoxic effect on human cells and can trigger the processes unrelated to cell death, e.g., biosynthetic system stress. The goal of this study was to investigate activation of the endoplasmic reticulum (ER) stress by jasmonic acid (JA) and to distinguish between the responses of cultured immortalized non-tumorigenic HaCaT cells and epidermoid carcinoma A431 cells to this plant hormone. JA was used in the concentration of 2 mM, as it suppressed cell proliferation in both cell lines. We analyzed expression of genes associated with the activation of ER stress (GRP78, ATF4, CHOP), the structure of the ER and Golgi complex, and synthetic processes in the HaCaT and A431 cell lines. JA induced expression of genes responsible for the activation of ER stress and caused hypertrophic changes in the Golgi complex in both cell lines. However, the patterns of gene expression in the HaCaT and A431 cells were different, and higher levels of involucrin synthesis were observed in A431 but not in HaCaT cells, suggesting that JA activated differentiation of the tumor A431 cells only. Therefore, JA induced ER stress in both cell lines, but the consequences of ER stress were different for the epidermal immortalized non-tumorigenic and tumor cells.
KEY WORDS: plant hormones, jasmonic acid, ER stress, differentiationDOI: 10.1134/S0006297919090074
Abbreviations: DAPI, 4,6-diamidino-2-phenylindole hydrochloride; DMSO, dimethyl sulfoxide; DTT, dithiothreitol; ER, endoplasmic reticulum; JA, jasmonic acid; qPCR, real-time polymerase chain reaction; PI, propidium iodide; TEM, transmission electron microscopy; TGN, trans-Golgi network; UPR, unfolded protein response.
Jasmonic acid (JA) is a member of the jasmonate family of oxylipin
stress hormones produced by algal, fungal, moss, gymnosperm, and
angiosperm cells in response to abiotic and biotic stress factors [1, 2]. Selective cytotoxicity of
high (millimolar) concentrations of JA [3, 4] and its derivatives [5] against
many types of tumor cell lines, as well as other effects of jasmonates
not associated with the suppression of cell viability and induction of
cell death, have been shown. For example, the jasmonate derivative
(3-hydroxy-2-pentylcyclopentyl)acetic acid induced expression of the
major skin proteoglycans and improved wound healing with the
involvement of primary keratinocytes [6]. In
addition, jasmonates can activate differentiation of human blood tumor
cells [7]. Our previous studies have shown that
plant hormones, such as abscisic and gibberellic acids, cause
hypertrophic changes in the organelles of the secretory/synthetic
systems of cultured HaCaT and A431 cells [8]. The
observed changes are supposedly associated with the activation of
secretory activity and/or induction of endoplasmic reticulum (ER)
stress, which can lead to either cell death or survival. This work was
aimed to investigate the possibility of ER stress activation by JA and
to reveale the differences in the responses to JA of cultured
immortalized non-tumorigenic human HaCaT cells and human epidermoid
carcinoma A431 cells.
MATERIALS AND METHODS
Cell culturing. HaCaT cells (immortalized non-tumorigenic human keratinocytes) were from the Cell Culture Collection for Biotechnological and Biomedical Research, Koltsov Institute of Developmental Biology, Russian Academy of Sciences; A431 cells (human epidermoid carcinoma cells) were from the Cell Culture Bank, Institute of Cytology, Russian Academy of Sciences. The cells were grown in DMEM (Dulbecco Modified Eagle’s Medium; PanEco, Russia) supplemented with 10% fetal bovine serum (FBS; PanEco), 2 mM L-glutamine (PanEco), and 80 μg/ml gentamicin (Belmedpreparaty, Belarus) under standard conditions (37°C, 5% CO2). The cells were collected from the surface of a plastic flask with a 1 : 3 mixture of trypsin solution (PanEco) and Versene (0.2% EDTA in phosphate buffer; PanEco) and plated in 96-well microplates for the MTT assay or on glass coverslips and grown for 48 h. Cell concentration was 100,000-150,000 cell/ml.
MTT assay. Cell metabolic activity and proliferation were evaluated by the MTT [3-(4,5-dimethylthiazol-2-yl)-2,5-diphenyltetrazolium bromide] assay as follows: JA solution (Sigma-Aldrich, USA) in 96% ethanol was added to a desired final concentration to each well of the 96-well microplate with cells 48 h after cell plating and incubated for 24 h. The control cells were incubated either without any additions (control 1) or in the presence of ethanol concentrations corresponding to the concentrations resulting from adding the JA solution (control 2). The experiment was conducted as described in [8]. Since no differences were observed between the controls 1 and 2 (data not shown), the results presented in Fig. 1 were compared to control 2 only. Analogously, both controls 1 and 2 were performed for each subsequent experiment, but because of the absent or insignificant differences between controls 1 and 2 (data not shown), the results presented in Figs. 2-7 were compared to control 2 only.
Flow cytometry. Apoptotic and necrotic cells were detected using Annexin V-FITC Kit PN IM 2375 (Beckman Coulter, France) as recommended by the manufacturer. Cell suspensions were stained with propidium iodide (PI) and Annexin V (2.5 and 5 μl per 100 μl suspension, respectively) and analyzed with a FACSAria SORP cell sorter (Beckton Dickinson, USA).
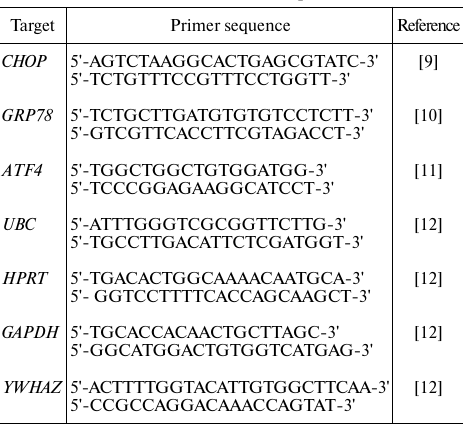
RT-qPCR. RT-qPCR was performed as described in [13] using the primers (Sintol, Russia) shown in the table.
Primers used for RT-qPCR
Transmission electron microscopy (TEM). The cells were fixed for 30 min with 2.5% glutaraldehyde (Ted Pella Inc., USA), washed with PBS (pH 7.2-7.4), and contrasted with 1% OsO4 solution in PBS (pH 7.2-7.4; Sigma-Aldrich) for 1 h in the dark. Dehydration and embedding in Epon 812 (Sigma-Aldrich) were performed by the standard technique. Ultrathin sections of Epon-embedded samples were stained with 1.5% uranyl acetate solution and lead citrate according to Reynolds [14] and analyzed with a JEM-1011 transmission electron microscope (JEOL, Japan) equipped with a GATAN ES500W digital camera operated by the Digital Micrograph GATAN software.
Immunocytochemistry. For immunocytochemical staining, the cells were incubated for 24 h on glass slides in Petri dishes in the presence of 2 mM JA, fixed with 4% paraformaldehyde (MP Biochemical, France) in PBS (pH 7.2-7.4), and treated with 0.1% Triton X-100 (Serva, Germany). Cell organelles were visualized using mouse monoclonal antibodies against Golgi 58K protein (formiminotransferase cyclodeaminase, FTCD; Sigma-Aldrich), mouse anti-involucrin monoclonal antibodies (Sigma-Aldrich), and Alexa Fluor 488-conjugated mouse anti-IgG antibodies (Thermo Fisher Scientific, USA). Nuclei and mitotic figures were visualized with DAPI (4′,6-diamidine-2′-phenylindole dihydrochloride; Sigma-Aldrich). The preparations were embedded in Mowiol (Hoechst, Germany) and analyzed under an Axiovert 200M inverted fluorescence microscope (Carl Zeiss Inc., Germany; PlanApo 20× and 63×/1.4 oil objectives) equipped with a Carl Zeiss AxioCam black-and-white digital camera with AxioVision 3.1 (Carl Zeiss) software and under a Nikon Eclipse Ti-E microscope (Nikon, Japan) with a confocal module A1 and an Apo TIRF objective 60×/1.49 oil.
Protein electrophoresis and immunoblotting. The cells were lysed in 2× lysis buffer containing 200 mM Tris-HCl, 400 mM β-mercaptoethanol (Bio-Rad, USA), 4% sodium dodecyl sulfate (SDS; Serva), 0.01% bromophenol blue, and 40% glycerol (PanReac, Spain). The lysates were incubated for 10 min at 100°C and separated by electrophoresis in 10% polyacrylamide gel (acrylamide/N,N′-methylene bis-acrylamide ratio of 30 : 0.8; Bio-Rad) with the 4% concentrating polyacrylamide gel in a Mini-Protean Tetra Vertical Electrophoresis Cell (Bio-Rad) using Tris-glycine electrode buffer, pH 8.3 (Bio-Rad), at 20 mA (concentrating gel) and 30 mA (separating gel). PageRuler Plus Prestained 10-250 kDa Protein Ladder (Thermo Fisher Scientific, USA) was used as molecular mass standards.
The semi-dry transfer of proteins to a PVDF membrane (GE Healthcare, USA) was performed in a Trans-Blot SD Semi-Dry Transfer Cell (Bio-Rad) using the transfer buffer containing 47.9 mM Tris, 38.6 mM glycine, 0.0385% SDS, and 20% methanol for 30 min at 100 V. The PVDF membrane was blocked for 30 min in 2% BSA (Sigma-Aldrich) in PBS and incubated with the primary anti-involucrin antibody (dilution, 1 : 2000) and horseradish peroxidase-conjugated antibody against β-actin for load control (dilution, 1 : 50,000; Abcam, Great Britain) for 18 h. The membrane was then washed with PBST buffer (PBS and 0.1% Tween 20; Helicon, Russia) and incubated with horseradish peroxidase-conjugated secondary anti-mouse IgG rabbit antibody (dilution, 1 : 10,000) for 1.5 h. After washing with PBST, proteins were visualized by the chemiluminescent method using Amersham ECL Prime system (GE Healthcare) and documented with a ChemiDoc MP System (Bio-Rad).
Total protein synthesis was assessed with a Click-iT AHA Alexa Fluor 488 Protein Synthesis HCS Assay (Thermo Fisher Scientific) as described elsewhere [8]. For the protein synthesis inhibition, the cells were treated with 1.5 mM cycloheximide (Sigma-Aldrich) for 1.5 h.
Data processing. The obtained images were processed with the ImageJ software (National Institutes of Health, USA). The intensity of protein synthesis was assessed with a plug-in designed by Dr. I. I. Kireev (Laboratory of Electron Microscopy, Belozersky Institute of Physico-Chemical Biology). Statistical data processing was performed using the Mann–Whitney U-test (nonparametric); the differences were considered statistically significant at p < 0.01.
RESULTS
Determination of the effective JA concentration. The effect of 0.1-4.0 mM JA (24-h incubation) on the metabolic activity of HaCaT and A431 cells was studied by the MTT assay. After incubation with 1, 2, and 4 mM JA, the optical density of formazan solution decreased by 17, 30, and 45%, respectively, for the HaCaT cells and by 15, 43, and 53%, respectively, for the A431 cells (Fig. 1a). No reliable differences between the cell lines were observed at lower JA concentrations. Therefore, both HaCaT and A431 cells responded to JA in the concentrations of 1 mM and above, but the decrease in the metabolic activity at 2 and 4 mM JA was more pronounced in the tumor cells.
Fig. 1. Viability of exposed to JA-treated HaCaT and A431 cells. a) Optical density after incubation with 0.1-4.0 mM JA; C, control. b-e) Cell death in the cultures of HaCaT (b, c) and A431 (d, e) cells in the absence and presence of 2 mM JA [representative data from three (A431) and five (HaCaT) experiments]. Q1, propidium iodide (PI)-positive cells (necrotic cells, cell debris); Q2, Annexin V- and PI-positive cells (late stages of cell death, such as postapoptotic necrosis, secondary necrosis); Q3, Annexin V- and PI-negative cells (live cells); Q4, Annexin V-positive cells (apoptotic cells). f) Mitotic index of JA-treated HaCaT and A431 cells. Data are presented as mean ± standard deviation (n = 3-6); * p ≤ 0.01 according to the Mann–Whitney test.
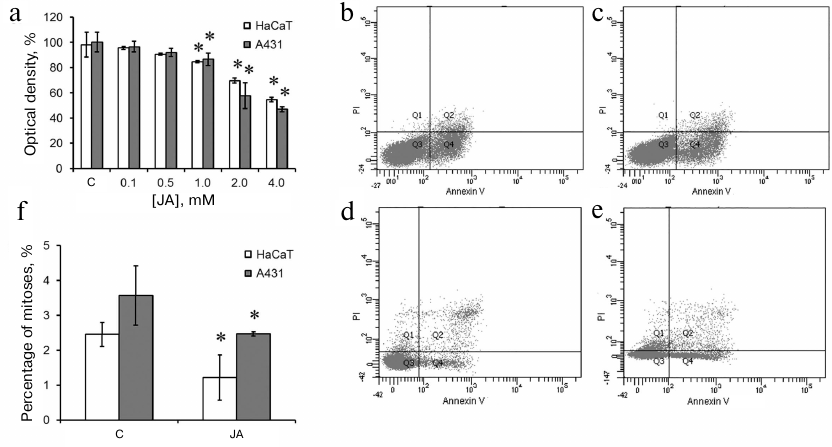
The reduction in the metabolic activity revealed by the MTT assay could be associated with either induction of cell death or suppression of cell proliferation. Therefore, we studied the cell death after exposure to 2 mM JA by the flow cytometry using Annexin V and PI staining (Fig. 1, b-e). In the control HaCaT cells, the percentage content of live cells (not stained with Annexin V and PI) was 89.3%; Annexin V-labeled cells – 9.3%; PI-labeled cells – 0.1%; cells with both labels – 1.3% (Fig. 1b). In the population of HaCaT cells exposed to JA, the percentage content of the corresponding cell populations remained virtually the same (8.4, 0.1 and 1.2%, respectively) (Fig. 1c). In the control A431 cells, the content of live cells was 94.4%; Annexin V-labeled cells – 2.3%; PI-labeled cells – 1%; cells with both labels – 2.3% (Fig. 1d). After incubation of A431 cells with JA, the percentage content of live cells was 89.7%; Annexin V-labeled cells – 5.5%; PI-labeled cells – 2.4%; cells with both labels – 2.4% (Fig. 1e). Therefore, the reduction of metabolic activity revealed by the MTT assay in both cell lines was most likely associated with the suppression of cell proliferation.
The mitotic count showed 2.45% of mitoses in the control HaCaT cells and 1.21% of mitoses in the JA-treated cells (Fig. 1f). The mitotic count in the control A431 cells was 3.57% and decreased to 2.47% under exposure to JA (Fig. 1f); i.e., 2 mM JA induced 2- and 1.4-fold suppression of proliferation of HaCaT and A431 cells, respectively.
MTT assay, flow cytometry, and mitotic count showed that the decreased viability of cells treated with 2 mM JA was not related to the massive cell death; therefore, this concentration was used to study the effects of JA on the secretory and synthetic systems.
ER stress. We used RT-qPCR to investigate expression of genes associated with ER stress: GRP78 (binding immunoglobulin protein/78-kDa glucose-regulated protein), ATF4 (activating transcription factor 4), and CHOP (C/EBP homologous protein). Dithiothreitol (DTT; ER stress activator) was used as a positive control. In HaCaT cells, DTT stimulated expression of all analyzed genes, especially, GRP78 and CHOP (Fig. 2a). JA also upregulated expression of all the three genes in these cells, but its effect on GRP78 and CHOP expression was less pronounced than the effect of DTT (Fig. 2a). In A431 cells, DTT stimulated expression of the ATF4 and CHOP genes, while activation of the GRP78 expression was insignificant (Fig. 2b). Incubation with JA significantly upregulated expression of the ATF4 gene only (to the level comparable to that observed under the influence of DTT), while expression of GRP78 and CHOP remained at the control level (Fig. 2b).
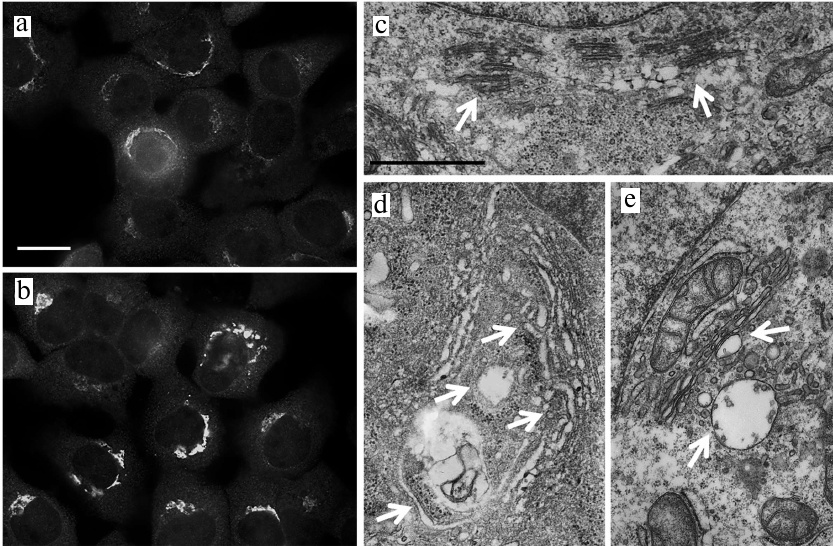
Fig. 2. Activation of ER stress in JA-treated HaCaT and A431 cells. a, b) Expression of GRP78, ATF4 and CHOP genes associated with the activation of ER stress in HaCaT and A431 cells exposed to JA; C, control; DTT, dithiothreitol (positive control). Data are shown as mean ± standard deviation (from three replicates of two independent experiments); * p ≤ 0.01 according to the Mann–Whitney test. c-e) TEM photographs of ER in JA-treated (d, e) and control (c) HaCaT cells. Arrows, ER cisternae; scale bar, 2 μm.
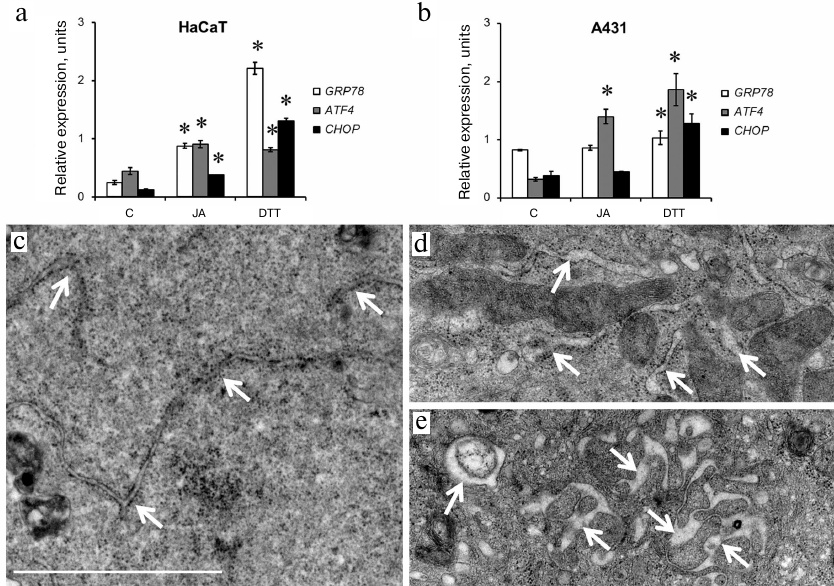
Therefore, analysis of the expression of ER stress-activated genes showed that JA induced ER stress in both cell lines, but via different mechanisms.
The structure of ER. Since one of the morphological manifestations of ER stress is swelling and expansion of ER cisternae [15, 16], we studied the ER structure in the JA-treated cells using transmission electron microscopy (TEM). We found that exposure to JA resulted in the increase in the volume of ER cisternae in HaCaT cells (Fig. 2, c-e), but not in A431 cells (data not shown).
The structure the Golgi complex. Next, we investigated the structure of the Golgi complex, as an organelle following and associated with the ER in the cellular secretory/synthetic pathways. Immunocytochemical staining with the anti-p58K antibodies showed the swelling of the Golgi complex after incubation with JA in both HaCaT (Figs. 3a and 3b) and A431 cells (Figs. 4a and 4b) that was due, presumably, to the hypertrophic changes in the entire complex and its compartments. Electron microscopy demonstrated that the Golgi complex in the HaCaT and A431 cells represented closely packed stacks of cisternae with specific polarity (Figs. 3c and 4c) located in the perinuclear region. In JA-treated cells of both cell lines, the cisternae of the Golgi complex trans-side were expanded and the trans-Golgi network (TGN) was represented by large vesicles of variable dimensions (Figs. 3d, 3e, 4d, 4e).
Fig. 3. The Golgi complex in JA-treated and control HaCaT cells. a, c) Control; b, d, e) JA-treated cells; a, b) immunocytochemical staining with anti-58K antibodies; scale bar, 10 μm; c-e) TEM; arrows point to the Golgi complex trans-side and TGN; scale bar, 1 μm.
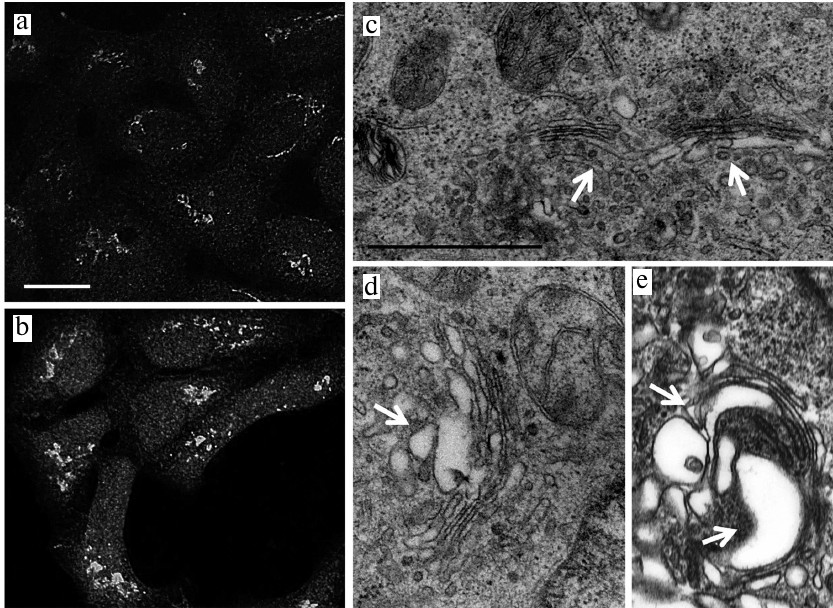
Fig. 4. The Golgi complex in JA-treated and control A431 cells. a, c) Control; b, d, e) JA-treated cells; a, b) immunocytochemical staining with anti-58K antibodies; scale bar, 10 μm; c-e) TEM; arrows point to the Golgi complex trans-side and TGN; scale bar, 1 μm.
Hypertrophic changes in the Golgi complex in the JA-treated cells of both cell lines, along with the expansion of ER cisternae in HaCaT cells, may be the evidence of processes associated with the ER stress.
The level of involucrin synthesis. ER stress can have different consequences that can result in either cell survival or cell death. Under physiological conditions, ER stress can trigger cell differentiation [17], in particular, differentiation of keratinocytes [18]. We studied the synthesis of involucrin, a marker of keratinocyte terminal differentiation, in JA-treated HaCaT and A431 cells.
Immunocytochemical staining with anti-involucrin antibodies showed a weak diffuse staining of the cytoplasm in the HaCaT control cells. Some cells (mainly those assembled into clusters or single dendritic cells) displayed much brighter cytoplasm staining (Figs. 5a and 5b, arrows), but the content of these did not exceed 6% (Fig. 5c). The staining pattern of the HaCaT cells did not change after their exposure to JA (Figs. 5b and 5c).
Fig. 5. Involucrin expression in control and JA-treated HaCaT and A431 cells. a-c) HaCaT cells; d-g) A431 cells; a, d) control; b, e, f) JA-treated cells; a, b, d-f) immunocytochemical staining of the cells with anti-involucrin antibodies; arrows, cells with bright diffuse staining (islets or single cells with processes); scale bar, 10 μm. c, g) Percentage content of HaCaT and A431 cells, respectively, with bright diffuse staining with anti-involucrin antibodies. Data are shown as mean ± standard deviation (n = 3); * p ≤ 0.01 according to the Mann–Whitney test.
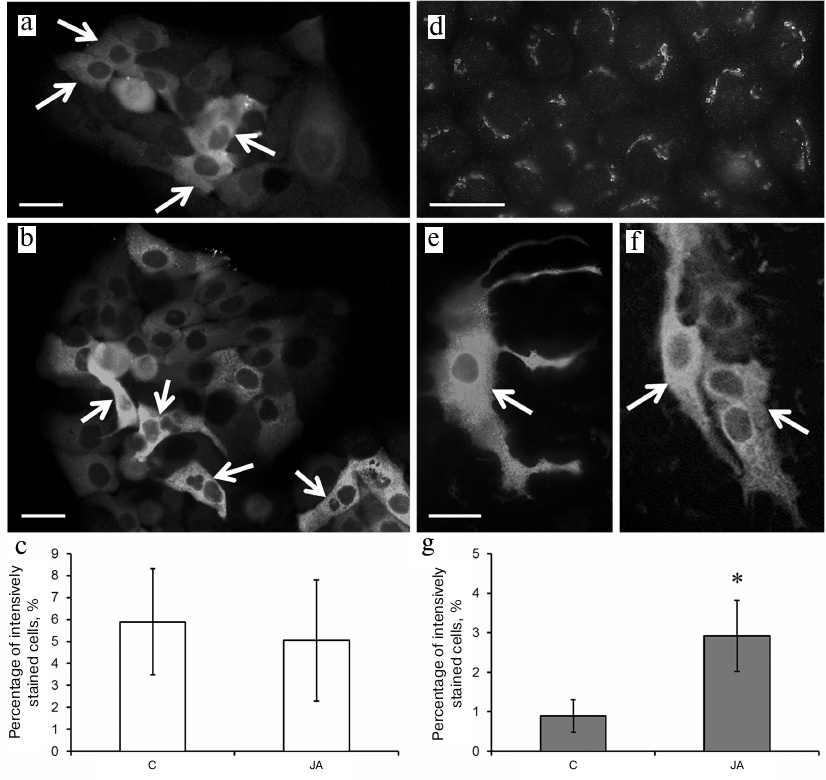
Immunocytochemical staining of A431 cells with anti-involucrin antibodies showed the presence of structures morphologically corresponding to the Golgi complex against weak diffuse staining of the cytoplasm (Fig. 5d). No more than 1% of the entire cell population exhibited bright diffuse staining of the cytoplasm (similar to that observed in HaCaT cells) (Figs. 5e and 5f; arrows); such cells often formed clusters above the substrate-attached cells (Fig. 5f). After exposure to JA, the number of brightly-stained A431 cells increased to 3% (Fig. 5g).
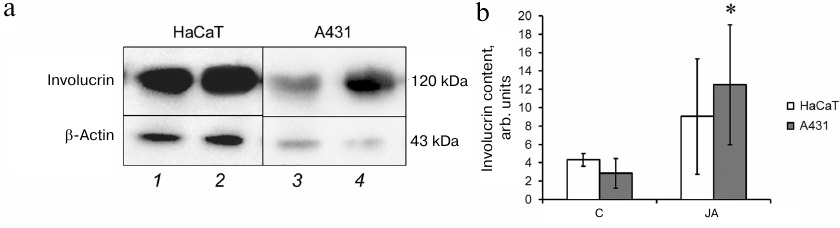
The amounts of involucrin in the lysates of HaCaT and A431 cells before and after incubation with JA were evaluated by Western blotting. As seen in Fig. 6, JA had no effect on the level of involucrin synthesis in HaCaT cells, while in A431 cells, the content of involucrin increased 2.7-fold after exposure to JA. It is possible that the increased content of the differentiation marker involucrin in tumor cells contributes to the synthetic activity of these cells. In view of this, we studied the level of total protein synthesis in HaCaT and A431 cells.
Fig. 6. Involucrin content in HaCaT and A431 cells. a) Western blot assay of cell lysates: 1, 3) control cells; 2, 4) JA-treated cells. b) Relative involucrin content. Data are shown as mean ± standard deviation (n = 3-4); * p ≤ 0.01 according to the Mann–Whitney test.
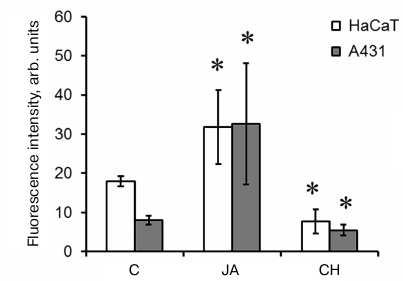
Total protein synthesis in cells. In order to find out whether JA influences the biosynthetic processes, the levels of total protein synthesis in the control and JA-treated cells were compared after exposure of these cells to protein synthesis inhibitor cycloheximide (1.5 mM). We found that the intensity of fluorescence and, therefore, the intensity of protein synthesis after incubation with 2 mM JA increased 1.8- and 4-fold in the HaCaT and A431 cells, respectively (Fig. 7). Similar data were obtained for abscisic acid (another plant hormone) in A431 cells [8].
Fig. 7. Intensity of total protein synthesis in HaCaT and A431 cells exposed to JA. C, control; CH, cycloheximide. Data are shown as mean ± standard deviation (n = 3-6); * p ≤ 0.01 according to the Mann–Whitney test. The background fluorescence of cells exposed to CH is due to the absence of CH effect on protein synthesis in mitochondria.
DISCUSSION
We demonstrated that JA suppresses proliferation of both HaCaT and A431 cell lines, as well as the activates expression of the GRP78, ATF4, and CHOP genes in HaCaT cells and the ATF4 gene in A431 cells. GRP78 is a chaperone in the ER lumen that normally inactivates transmembrane ER receptors, such as PERK kinase (PKR-like eukaryotic initiation factor 2α kinase), IRE1 (inositol-requiring enzyme 1α), and transcription factor ATF6 (activating transcription factor 6). ER stress accompanied by the accumulation of incorrectly folded proteins in its lumen activates unfolded protein response (UPR), an evolutionarily conserved mechanism associated with the suppression of protein translation and simultaneous activation of the synthesis of chaperones (including GRP78), which helps eukaryotic cells to restore the protein folding in the ER [18, 19]. During induction of the ER stress and UPR, GRP78 is separated from PERK, ATF6, and IRE1 that, in turn, activate a number of transcription factors, including components of the PERK pathway – ATF4 and CHOP. DTT used in our work as a positive control induces the ER stress and increases the phosphorylation level of eIF2α, a component of the PERK pathway in UPR. This can lead to either cell adaptation after the stress or apoptosis [20]. Since we did not observe noticeable cell death in either cell line, the response to the JA-induced ER stress of both HaCaT and A431 cells seems to be adaptive.
At the morphological level, ER stress can be accompanied by the hypertrophy of ER cisternae, as it has been shown for the HaCaT cells. It is possible that the expansion of the Golgi complex trans-side in both cell lines was also caused by the ER stress. The ER and the Golgi complex are connected by the protein flux; therefore, suppression of translation and accumulation of incorrectly folded proteins in the ER stress can lead to the changes in the Golgi complex, including those at the ultrastructural level, and might account for the expansion of cisternae on the trans-side of the Golgi complex observed in both types of cells. On the other hand, it cannot be ruled out that these morphological changes in the Golgi complex ultrastructure may be due to the higher secretory activity of the cells (as shown by the activation of total protein synthesis in both HaCaT and A431 cells and upregulation of expression of the GRP78 chaperone in HaCaT cells) or increased production of endosomes/lysosomes.
At the same time, we observed the differences between the responses of HaCaT and A431 cells to JA. In A431 cells, the JA-induced ER stress was accompanied by upregulation of the synthesis of involucrin, a marker of keratinocyte terminal differentiation. Physiological ER stress in keratinocytes maintains the homeostasis of the epidermis and leads to terminal differentiation of these cells [18, 21], in which the intracellular content of keratinocytes is replaced by cytoskeletal proteins (keratins 1, 2, and 10) and cross-linking of proteins (involucrin, loricrin, etc.) at the cell periphery takes place for the formation of a waterproof barrier [22]. Involucrin is synthesized in the cytosol and then gets attached to the plasma membrane proteins by transglutaminase [23, 24]. Here, we have shown by immunocytochemical staining that the intracellular location of involucrin in HaCaT and A431 cells is different. HaCaT cells were characterized by diffuse staining (presumably reflecting normal location of involucrin under the plasma membrane). Only a small portion of A431 cells were stained diffusely, while in the rest of the cells, involucrin was detected in association with the cytoplasmic structures morphologically corresponding to the Golgi apparatus (probably due to the involucrin binding with vesicles budding from the trans-side of the Golgi apparatus). This difference can be accounted for by the fact that, compared to HaCaT cells, A431 cells exhibit lower activity of transglutaminase, an enzyme that links involucrin to the plasma membrane proteins. Hence, these cells do not reach the terminal differentiation stage even under conditions favoring this process (e.g., elevated Ca2+ levels) [23]. After incubation with JA, the number of A431 cells with diffuse, i.e., normal, staining reliably increased, demonstrating normalization of the phenotype of pathologically modified cells, possibly, due to the increased synthesis of involucrin and/or the higher activity of transglutaminase. Western blotting confirmed that JA increases the involucrin content in the tumor cells, which might contribute to the increased protein synthesis in these cells. Rosdy et al. showed that the epidermal growth factor promotes involucrin accumulation in A431 cells and, at the same time, suppresses their proliferation [23]. Similar effects have been also demonstrated for terbinafine (active component of the drug Lamisil). Terbinafine induced differentiation of A431 cells associated with involucrin expression and resulting in the cell cycle arrest [25].
There is a wide range of chemically diverse compounds (Ca2+, phorbol ester, okadaic acid, green tea polyphenols) that active involucrin expression in the epithelium by the same mechanism – via interacting with the components of the MAPK (mitogen-activated protein kinase) cascade [26]. MAPKs are serine/threonine kinases that play a key role in signal transduction from the cell surface to the nucleus. In mammals, they are represented by ERK (extra-cellular signal regulated protein kinase), JNK (c-Jun N-terminal kinase), and p38 MAPK [24]. The mechanism of involucrin gene expression in the epithelium involves activation of p38δ and suppression of ERK1/2 enzymes [26]. It has been shown that the MAPK pathway activation by methyl jasmonate induces differentiation of human myeloid leukemia HL-60 cells into monocytes and granulocytes [27] and activates JNK and p38 in human T-lymphoblast leukemia Molt-4 cells and human peripheral blood lymphocytes [28]. Interestingly, DTT can also activate JNK and p38 via the IRE1α pathway [29] and the PERK pathway of the ER stress [30]. It is possible that the observed suppression of proliferation by JA in both cell lines, as well as differentiation of A431 cells, occur via activation of the PERK/ATF4 pathway.
Here, we have revealed the common features of the response of immortalized human keratinocytes and tumor cells to JA (ER stress, hypertrophy of the Golgi apparatus, upregulation of protein synthesis), as well as specific response of A431 cells to this plant hormone (elevated involucrin content). The observed differences might be related to different patterns of expression of the marker genes of the ER stress. These findings demonstrate the selective effect of JA on tumor cells and can be used in further studies for evaluating the effects of plant hormones on animal and human cells, as well as for development of new approaches to the antitumor therapy associated with differentiation of tumors of epidermal origin.
Funding. The work was supported by the Russian Foundation for Basic Research (project 19-015-00233) and the Development Program of the Moscow State University (complex FACSAria SORP).
Conflict of interest. The authors declare no conflict of interest.
Compliance with ethical standards. This article does not contain any studies involving animals or human participants performed by any of the authors.
REFERENCES
1.Wasternack, C., and Hause, B. (2013) Jasmonates:
biosynthesis, perception, signal transduction and action in plant
stress response, growth and development. An update to the 2007 review
in Annals of Botany, Ann. Bot., 111, 1021-1058,
doi: 10.1093/aob/mct067.
2.Song, S., Qi, T., Wasternack, C., and Xie, D.
(2014) Jasmonate signaling and crosstalk with gibberellin and ethylene,
Curr. Opin. Plant Biol., 21, 112-119, doi:
10.1016/j.pbi.2014.07.005.
3.Fingrut, O., and Flescher, E. (2002) Plant stress
hormones suppress the proliferation and induce apoptosis in human
cancer cells, Leukemia, 16, 608-616, doi:
10.1038/sj.leu.2402419.
4.Rotem, R., Heyfets, A., Fingrut, O., Blickstein,
D., Shaklai, M., and Flescher, E. (2005) Jasmonates: novel anticancer
agents acting directly and selectively on human cancer cell
mitochondria, Cancer Res., 65, 1984-1993, doi:
10.1158/0008-5472.CAN-04-3091.
5.Li, J., Chen, K., Wang, F., Dai, W., Li, S., Feng,
J., Wu, L., Liu, T., Xu, S., Xia, Y., Lu, J., Zhou, Y., Xu, L., and
Guo, C. (2017) Methyl jasmonate leads to necrosis and apoptosis in
hepatocellular carcinoma cells via inhibition of glycolysis and
represses tumor growth in mice, Oncotarget, 8,
45965-45980, doi: 10.18632/oncotarget.17469.
6.Henriet, E., Jager, S., Tran, C., Bastien, P.,
Michelet, J. F., Minondo, A. M., Formanek, F., Dalko-Csiba, M.,
Lortat-Jacob, H., Breton, L., and Vives, R. R. (2017) A jasmonic acid
derivative improves skin healing and induces changes in proteoglycan
expression and glycosaminoglycan structure, Biochim. Biophys. Acta
Gen. Subj., 1861, 2250-2260, doi:
10.1016/j.bbagen.2017.06.006.
7.Tsumura, H., Akimoto, M., Kiyota, H., Ishii, Y.,
Ishikura, H., and Honma, Y. (2009) Gene expression profiles in
differentiating leukemia cells induced by methyl jasmonate are similar
to those of cytokinins and methyl jasmonate analogs induce the
differentiation of human leukemia cells in primary culture,
Leukemia, 23, 753-760, doi: 10.1038/leu.2008.347.
8.Vildanova, M. S., Savitskaya, M. A., Onishchenko,
G. E., and Smirnova, E. A. (2014) Effect of plant hormones on
components of the secretory pathway of normal and tumor human cells,
Tsitologiya, 56, 516-525.
9.Fu, J., Zhao, L., Wang, L., and Zhu, X. (2015)
Expression of markers of endoplasmic reticulum stress-induced apoptosis
in the placenta of women with early and late onset severe
pre-eclampsia, Taiwan J. Obstet. Gynecol., 54, 19-23,
doi: 10.1016/j.tjog.2014.11.002.
10.Murugan, D., Lau, Y. S., Lau, C. W., Mustafa, M.
R., and Huang, Y. (2015) Angiotensin 1-7 protects against angiotensin
II-induced endoplasmic reticulum stress and endothelial dysfunction via
Mas receptor, PLoS One, 10, e0145413, doi:
10.1371/journal.pone.0145413.
11.Plaisance, V., Brajkovic, S., Tenenbaum, M.,
Favre, D., Ezanno, H., Bonnefond, A., Bonner, C., Gmyr, V., Kerr-Conte,
J., Gauthier, B. R., Widmann, C., Waeber, G., Pattou, F., Froguel, P.,
and Abderrahmani, A. (2016) Endoplasmic reticulum stress links
oxidative stress to impaired pancreatic β-cell function caused by
human oxidized LDL, PLoS One, 11, e0163046, doi:
10.1371/journal.pone.0163046.
12.Vandesompele, J., De Preter, K., Pattyn, F.,
Poppe, B., Van Roy, N., De Paepe, A., and Speleman, F. (2002) Accurate
normalization of real-time quantitative RT-PCR data by geometric
averaging of multiple internal control genes, Genome Biol.,
3, doi: 10.1186/gb-2002-3-7-research0034.
13.Potashnikova, D., Gladkikh, A., and Vorobjev, I.
A. (2015) Selection of superior reference genes’ combination for
quantitative real-time PCR in B-cell lymphomas, Ann. Clin. Lab.
Sci., 45, 64-72.
14.Reynolds, E. S. (1963) The use of lead citrate at
high pH as an electron-opaque stain in electron microscopy, J. Cell
Biol., 17, 208-212, doi: 10.1083/jcb.17.1.208.
15.Mishra, A. R., Zheng, J., Tang, X., and Goering,
P. L. (2016) Silver nanoparticle-induced autophagic-lysosomal
disruption and NLRP3-inflammasome activation in HepG2 cells is
size-dependent, Toxicol. Sci., 150, 473-487, doi:
10.1093/toxsci/kfw011.
16.Smith, M., and Wilkinson, S. (2017) ER
homeostasis and autophagy, Essays Biochem., 61, 625-635,
doi: 10.1042/EBC20170092.
17.Matsuzaki, S., Hiratsuka, T., Taniguchi, M.,
Shingaki, K., Kubo, T., Kiya, K., Fujiwara, T., Kanazawa, S.,
Kanematsu, R., Maeda, T., Takamura, H., Yamada, K., Miyoshi, K.,
Hosokawa, K., Tohyama, M., and Katayama, T. (2015) Physiological ER
stress mediates the differentiation of fibroblasts, PLoS One,
10, e0123578, doi: 10.1371/journal.pone.0123578.
18.Sugiura, K. (2013) Unfolded protein response in
keratinocytes: impact on normal and abnormal keratinization, J.
Dermatol. Sci., 69, 181-186, doi:
10.1016/j.jdermsci.2012.12.002.
19.Chakrabarti, A., Chen, A. W., and Varner, J. D.
(2011) A review of the mammalian unfolded protein response,
Biotechnol. Bioeng., 108, 2777-2793, doi:
10.1002/bit.23282.
20.Rozpedek, W., Pytel, D., Mucha, B., Leszczynska,
H., Diehl, J. A., and Majsterek, I. (2016) The role of the
PERK/eIF2α/ATF4/CHOP signaling pathway in tumor progression
during endoplasmic reticulum stress, Curr. Mol. Med., 16,
533-544.
21.Celli, A., Mackenzie, D. S., Crumrine, D. S., Tu,
C. L., Hupe, M., Bikle, D. D., Elias, P. M., and Mauro, T. M. (2011)
Endoplasmic reticulum Ca2+ depletion activates XBP1 and
controls terminal differentiation in keratinocytes and epidermis,
Br. J. Dermatol., 164, 16-25, doi:
10.1111/j.1365-2133.2010.10046.x.
22.Eckhart, L., Lippens, S., Tschachler, E., and
Declercq, W. (2013) Cell death by cornification, Biochim. Biophys.
Acta, 1833, 3471-3480, doi:
10.1016/j.bbamcr.2013.06.010.
23.Rosdy, M., Bernard, B. A., Schmidt, R., and
Darmon, M. (1986) Incomplete epidermal differentiation of A431
epidermoid carcinoma cells, In vitro Cell Dev. Biol., 22,
295-300.
24.Yamazaki, T., Nakano, H., Hayakari, M., Tanaka,
M., Mayama, J., and Tsuchida, S. (2004) Differentiation induction of
human keratinocytes by phosphatidylethanolamine-binding protein, J.
Biol. Chem., 279, 32191-32195, doi:
10.1074/jbc.M404029200.
25.Huang, C.-S., Ho, W.-L., Lee, W.-S., Sheu, M.-T.,
Wang, Y.-J., Tu, S.-H., Chen, R.-J., Chu, J.-S., Chen, L.-C., Lee,
C.-H., Tseng, H., Ho, Y.-S., and Wu, C.-H. (2008) SP1-regulated
p27/Kip1 gene expression is involved in terbinafine-induced human A431
cancer cell differentiation: an in vitro and in vivo
study, Biochem. Pharmacol., 75, 1783-1796, doi:
10.1016/j.bcp.2008.02.005.
26.Eckert, R. L., Crish, J. F., Efimova, T., and
Balasubramanian, S. (2004) Antioxidants regulate normal human
keratinocyte differentiation, Biochem. Pharmacol., 68,
1125-1131, doi: 10.1016/j.bcp.2004.04.029.
27.Cohen, S., and Flescher, E. (2009) Methyl
jasmonate: a plant stress hormone as an anti-cancer drug,
Phytochemistry, 70, 1600-1609, doi:
10.1016/j.phytochem.2009.06.007.
28.Rotem, R., Fingrut, O., Moskovitz, J., and
Flescher, E. (2003) The anti-cancer plant stress-protein methyl
jasmonate induces activation of stress-regulated c-Jun
N-terminal kinase and p38 protein kinase in human lymphoid
cells, Leukemia, 17, 2230-2234, doi:
10.1038/sj.leu.2403107.
29.Xiang, X. Y., Yang, X. C., Su, J., Kang, J. S.,
Wu, Y., Xue, Y. N., Dong, Y. T., and Sun, L. K. (2016) Inhibition of
autophagic flux by ROS promotes apoptosis during DTT-induced
ER/oxidative stress in HeLa cells, Oncol. Rep., 35,
3471-3479, doi: 10.3892/or.2016.4725.
30.Liang, S. H., Zhang, W., McGrath, B. C., Zhang,
P., and Cavener, D. R. (2006) PERK (eIF2α kinase) is required to
activate the stress-activated MAPKs and induce the expression of
immediate-early genes upon disruption of ER calcium homoeostasis,
Biochem. J., 393, 201-209, doi: 10.1042/BJ20050374.