Humoral Effect of a B-Cell Tumor on the Bone Marrow Multipotent Mesenchymal Stromal Cells
Nataliya A. Petinati1,a*, Alexey E. Bigildeev1, Dmitriy S. Karpenko1, Natalia V. Sats1, Nikolay M. Kapranov1, Yulia O. Davydova1, Ekaterina A. Fastova1, Aminat U. Magomedova1, Sergey K. Kravchenko1, Georgiy P. Arapidi2,3,4, Maria I. Rusanova5, Maria M. Lagarkova2, Nina I. Drize1, and Valeriy G. Savchenko1
1National Research Center for Hematology, Ministry of Health, 125167 Moscow, Russia2Federal Research and Clinical Center of Physical-Chemical Medicine, Federal Medical Biological Agency, 119435 Moscow, Russia
3Shemyakin–Ovchinnikov Institute of Bioorganic Chemistry, Russian Academy of Sciences, 117997 Moscow, Russia
4Moscow Institute of Physics and Technology (State University), 141700 Dolgoprudny, Moscow Region, Russia
5Faculty of Biology, Lomonosov Moscow State University, 119991 Moscow, Russia
* To whom correspondence should be addressed.
Received July 30, 2020; Revised September 14, 2020; Accepted September 14, 2020
The properties of bone marrow (BM)-derived multipotent mesenchymal stromal cells (MSCs) are altered in the patients with the diffuse large B cell lymphoma (DLBCL) without BM involvement. It was suggested that plasma from the patients contains soluble factors that affect MSCs. Plasma and BM-derived MSCs from the DLBCL patients at the onset of the disease and one month after the end of treatment were studied. Concentration of the plasma cytokines and gene expression in the MSCs were evaluated by the Bio-Plex Pro Human Cytokine Panel kit to measure 27 analytes and real-time PCR. Plasma and MSCs from the healthy donors were used as controls. Analysis of cytokines in the plasma from healthy donors and patients before and one month after the end of treatment revealed significant differences in the concentration of 14 out of 27 cytokines. Correlations between the levels of secreted cytokines were altered in the plasma from patients indicating that the immune response regulation was disturbed. Cultivation of the MSCs from the healthy donors in the medium supplemented with the plasma from patients led to the changes in the MSC properties, similar to those observed in the MSCs from patients. The BM-derived MSCs were shown to participate in the humoral changes occurring in the DLBCL patients. For the first time, it was shown that the precursors of the stromal microenvironment – multipotent mesenchymal stromal cells – are altered in the patients with DLBCL without bone marrow involvement due to the humoral effect of the tumor and the response of organism to it. Comprehensive analysis of the results shows that, when remission is achieved in the patients with DLBCL, composition of the plasma cytokines normalizes, but does not reach the level observed in the healthy donors. The discovery of a new aspect of the effect of the tumor B-cells on the organism could help to reveal general regularities of the humoral effect of various tumors on the bone marrow stromal cells.
KEY WORDS: DLBCL, MSCs, cytokines, chemokines, secretionDOI: 10.1134/S0006297921020097
Abbreviations: BM, bone marrow; CFU-F, colony-forming unit of fibroblasts; DLBCL, diffuse large B-cell lymphoma; IFN-γ, interferon gamma; IL, interleukin; MFI, mean fluorescence intensity; MSC, multipotent mesenchymal stromal cells; PDT, population doubling time; REL, relative expression level; TNF-α, tumor necrosis factor alpha.
INTRODUCTION
Diffuse large B cell lymphoma (DLBCL) is a heterogeneous group of diseases that differ in histological, immunohistochemical, and molecular characteristics [1]. Only 10-25% of DLBCL patients exhibit bone marrow (BM) lesions detected by histological or molecular techniques [2]. It is believed that BM is not involved in the tumor process in the remaining patients with DLBCL. However, it has recently been shown that stromal cells and BM progenitors change in the patients with DLBCL without BM involvement and such alterations persist for many years [3]. Such changes cannot be attributed to the direct interaction of BM stromal microenvironment with tumor cells, as is the case with leukemia [4, 5]. Considering that many tumors secrete cytokines and chemokines [6, 7], it was suggested that the plasma of DLBCL patients contains soluble factors affecting properties of MSCs and their activation. The presence of a tumor in the body can be considered as an inflammatory process [8, 9]. Inflammation is associated with the release of many factors that are known to activate cells of the BM stromal microenvironment, in particular, multipotent mesenchymal stromal cells (MSCs) involved in the regulation of hematopoiesis [10]. MSCs activated by interleukin 1β (IL-1), tumor necrosis factor α (TNFα), and interferon γ (IFN-γ) secrete inhibitors and activators of the inflammatory process [11]. It was previously shown that the total cellular production of the BM-derived MSCs from the patients with DLBCL without BM damage after 4 passages was higher than that of the MSCs from the donors of the corresponding age [3]. The expression of bFGF, FGFR2, IL-6, IL-8, and other genes in the MSCs from these patients is increased. We presumed that the plasma of patients contains soluble factors, most likely pro-inflammatory cytokines and chemokines, that affect the properties of MSCs and their activation in the patients. Testing this hypothesis became the goal of this study.
MATERIALS AND METHODS
Patients. The study investigated MSCs from 35 patients with DLBCL without bone marrow involvement. Prior to blood and BM sampling, patients and donors signed an informed consent. The characteristics of all patients included in the study are presented in Table S1 in the Supplement. Composition of cytokines and chemokines was studied in the blood plasma from 9 DLBCL patients before and one month after the end of treatment. Data on these patients and results of examination of cells are presented in the table.
Characteristics of patients with DLBCL, CFU-F, and MSCs before and one
month after the end of treatment
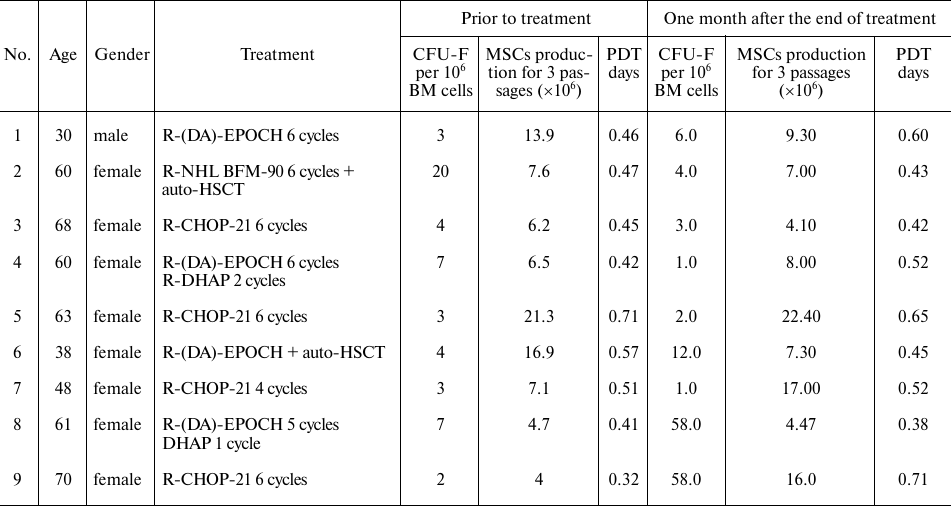
Notes. R-(DA)-EPOCH, R-NHL BFM-90, R-CHOP-21 are the names of cycles of
chemotherapy, auto HSCT – autologous hematopoietic stem cell
transplantation.
All patients achieved remission of the disease following treatment, which was confirmed by PET-CT.
Plasma from 5 healthy donors (1 male, 4 females) aged 34 to 67 years was used as a control. CFU-F, colony-forming unit of fibroblasts; PDT, population doubling time.
Cytokines and chemokines analysis. A Bio-Plex Pro Human Cytokine 27-Plex assay kit (Bio-Rad, USA) was used to analyze plasma concentrations of the following cytokines and chemokines: IL-1β, IL-1ra, IL-2, IL-4, IL-5, IL- 6, IL-7, IL-8, IL-9, IL-10, IL-12 (p70), IL-13, IL-15, IL-17, bFGF, Eotaxin, G-CSF, GM-CSF, IFN-γ, IP-10, MCP-1 (MCAF), MIP-1α, MIP-1β, PDGF-bb, RANTES, TNFα, VEGF according to manufacturer’s recommendations. Detection of the fluorescent beads was carried out with a Bio-Plex 200 System (Bio-Rad). All measurements were done in triplicates.
Determination of CFU-F concentration in the bone marrow of patients and MSCs characteristics. Analysis of the colony forming unit fibroblast (CFU-F) concentration and MSCs in the BM from patients were performed as described in [3].
Effect of plasma from patients on MSCs from healthy donors. To analyze effects of the plasma from DLBCL patients on MSCs from the BM of healthy donors, 10 samples (MSCs derived from the BM of 4 males and 6 females aged 14 to 50 years, median age 33 years) were used. MSCs from donors were cultured for 10 days in a serum-free medium (StemPro, Gibco) in the presence of 10% plasma of 5 healthy donors (1 male 34 years old and 4 females 34, 40, 59 and 66 years old) and plasma of 8 DLBCL patients before and one month after treatment. Each plasma sample was added to a separate well with MSCs. Total cell production as well as expression of surface markers: mean fluorescence intensity (MFI) and relative expression level (REL) of some genes were analyzed in the MSCs from donors treated with the plasma from patients.
Surface antigens analysis. Expression level of antigens on the MSCs was determined by flow cytometry. After MSCs were removed from the bottom of the flask, they were washed twice with CellWASH (BD Biosciences, USA), and then 2×10⁴ cells were incubated for 20 min in the dark with one of the following monoclonal antibodies: anti-CD90 labeled with PE (BD Pharmingen, USA), anti-HLA-ABC, labeled with FITC (Biolegend, USA), anti-CD73, labeled with PE (BD Pharmingen), anti-CD105, labeled with FITC (Biolegend), anti-CD54 labeled with APC (BD Biolegend) or anti-CD146, labeled with PE (BD Pharmingen). Analyses were performed using a FACSCanto II flow cytometer (BD Biosciences), and the data were analyzed using FACSDiva software (BD Biosciences).
MSC population was first determined from forward and side scattering parameters and next isolated based on the expression of CD90. For this cell population, mean fluorescence intensities (MFIs) for the FITC, PE and APC channels were evaluated.
Gene expression analysis in MSCs. Determination of the gene expression levels in MSCs was carried out by reverse transcription with subsequent real-time quantitative polymerase chain reaction (Taq-Man modification) using an Abiprism 7500 instrument (Applied Biosystems, USA). Total RNA was extracted from MSCs at passage 1 using the standard technique [12]. cDNA was synthesized using a mixture of random hexamers and oligo(dT) primers. The gene-specific primers and probes were designed by the authors and synthesized by Syntol R&D (Table S2 in the Supplement). Relative gene expression levels (REL) were determined by normalizing the level of expression of each target gene to the levels of expression of β-actin and GAPDH and calculated using the ΔΔCt method [13] for each MSC sample.
Statistical analysis. The data in Figs. 1, 2, and 3a are presented as boxplots using GraphPad Prism 8. In the plots in rectangles, the horizontal line represents the median, the length of the box represents the quarter spacing, and the vertical lines extend to the minimum and maximum values. The data in Fig. 3, b and c are presented as mean ± standard error. When normal distribution was confirmed, samples were compared using Student’s t test, otherwise Mann–Whitney tests were used for unpaired samples or Wilcoxon’s test for paired samples, differences at p < 0.05 were considered significant. The relationship between changes in the concentration of various cytokines in the plasma of patients was determined according to the Pearson correlation criterion. Correlation coefficient was analyzed using GraphPad Prism 8 software, r > 0.7 or <–0.7 at p < 0.05 was considered a significant strong correlation.
Comprehensive analysis of the differences between cytokines in the 3 studied groups was carried out. The analysis is based on determining the distances between points in the multidimensional space of the studied parameters. Fluctuations and significance of differences for each change were calculated individually. The calculations are presented in the Supplement in the “Comprehensive analysis of differences between samples” section.
RESULTS
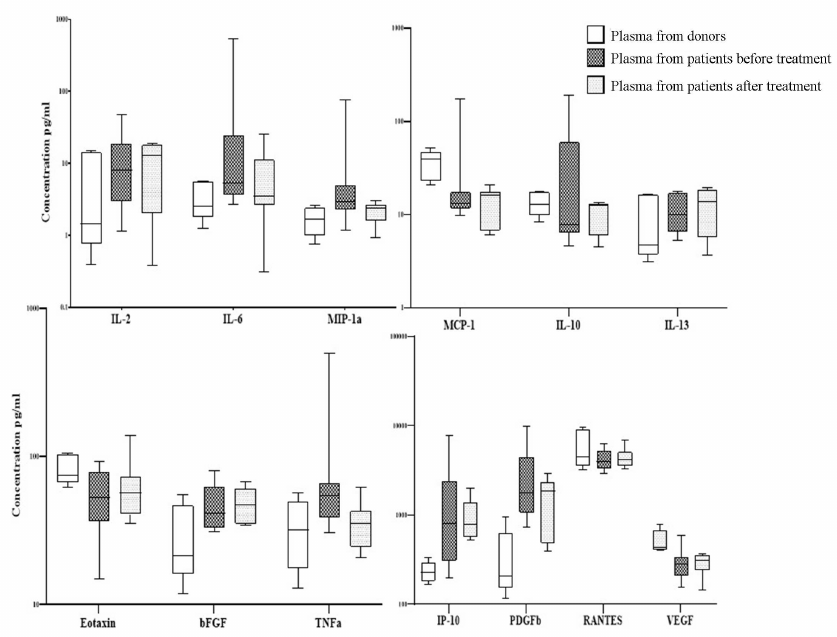
Concentration of cytokines in the plasma from patients with DLBCL. Comparative analysis of the cytokine concentrations in patient and donor plasma revealed significant differences in the concentration of 14 of the 27 studied cytokines (Fig. 1, Table S3 in the Supplement). Concentration of some cytokines was significantly increased in the primary patients compared to the donors: IL-2 increased 1.5-fold, IL-6 increased 3-fold, MIP-1a increased 10-fold, IL-10 increased 3-fold, eotaxin increased 1.5-fold, bFGF increased 1.5-fold, TNFα increased 4-fold, IP-10 increased 2.5-fold, MIP-1b increased 3-fold, PDGF-bb increased 3.5-fold, RANTES increased 2-fold, and VEGF increased 1.2-fold. After the end of treatment, concentration of the most proinflammatory cytokines and chemokines in the plasma from the DLBCL patients that increased at the onset of the disease in comparison to the level observed in the plasma from the donors normalizes after the end of treatment (IL-ra, IL-6, IL-8, IL-10, GM-CSF, MIP-1a, MIP-1b, TNFα) see Table S3 in the Supplement. Chemokines and cytokines associated with the growth parameters of MSCs and also involved in the processes of immunomodulation changed much slower and did not normalize one month after the end of therapy (IL-2, Eotaxin, bFGF, IP-10, MCP-1, PDGF-bb, RANTES, VEGF).
Fig. 1. Levels of cytokines and growth factors in the plasma from donors and DLBCL patients before and after treatment. On the box plots, horizontal line represents the median, length of the box represents the interquartile range, and vertical lines extend to the minimum and maximum values. The figure shows only cytokines with concentration in the plasma from donors and patients significantly different (p < 0.05). The plasma of 9 patients was studied before and one month after the end of treatment. Plasma from 5 healthy donors (1 male and 4 females) aged 34-67 years was used as a control.
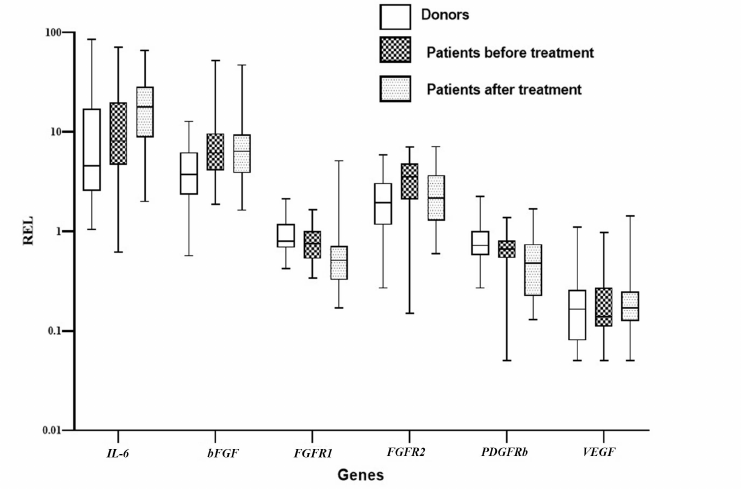
Relative expression level of genes in MSCs from patients with DLBCL. Since it was shown that MSCs from DLBCL patients changed, we studied expression of the genes that could contribute to the changes in the levels of cytokines in the patient’s plasma. Expression of the genes in the BM MSCs from the primary patients, patients after treatment, and healthy donors was compared. The expression level of IL-6, bFGF, and FGFR2 genes increased in the MSCs from the primary patients in comparison to the MSCs from the donors (Fig. 2). Considering that the levels of expression of VEGF and the receptor genes FGFR1 and PDGFRb REL were higher in the MSCs from donors than in the MSCs from the patients and after the end of treatment, only the level of VEGF expression recovered, we could presume existence of the different effects of chemotherapeutic drugs on the expression of genes that regulate maintenance and differentiation of MSCs.
Fig. 2. Relative expression levels of genes in the MSCs from the healthy donors and patients with DLBCL before and after treatment. On the box plots, horizontal line represents the median, length of the box represents the interquartile range, and vertical lines extend to the minimum and maximum values. MSCs from 30 healthy donors and 29 patients with DLBCL were analyzed.
Correlations between cytokines in the plasma from DLBCL patients. Changes in correlations between cytokines in the plasma from patients and healthy donors indicate disruption of the relationships between these cytokines, in other words, change in the immune response regulation. Only significant correlations were included in the analysis (R > 0.7 and <–0.7, p < 0.05). Correlations between the concentrations of cytokines in the plasma from healthy donors differed from those in the plasma from patients both before and after treatment (Table S4 in the Supplement).
Concentrations of the following markers were closely related in the plasma from donors: IL-6 with IL-9, IL-10, IL-13, and bFGF; IL-9 with IL-10, IL-13, IL-15, IL-17, GM-CSF, and VEGF; IL-12 with IL-1b and IL-10; IL-7 with IL-4; MIP-1a with IL-5 and GM-CSF; GM-CSF with eotaxin; and TNF-a with PDGF-bb. These cytokines exhibited no relationship in the plasma from patients before and after treatment.
The following correlations between cytokines were present in the plasma from all donors and patients: IL-1ra with IL-1b; IL-2 with IL-5, IL-6, IFN-γ, and bFGF; IL-4 with IL-1ra; IL-5 with IL-12, IL-13, IL-15, IL-17, GM-CSF, and bFGF; IL-6 with IFN-γ; IL-8 with IFN-γ and MIP-1a; IL-12 with IL-13 and bFGF; IL-13 with bFGF; IL-17 with bFGF; and TNF-a with MIP-1b.
Correlations between cytokines in the plasma from donors and patients before treatment were found between IL-1ra and IFN-γ; IL-4 and IL-1b, IL-2, bFGF, IFN-γ; IL-6 and MIP-1a; IL-10 and IL-15, bFGF; TNF-a and MCP-1, RANTES; RANTES and MIP-1b. All of them were absent after treatment.
Some correlations between cytokines were observed only in the plasma from patients before treatment and were not detected in the plasma either from donors or from patients after treatment: IL-2 with IL-1ra; IL-8 with IL-6; IL-15 with IL-7; IL-17 with IL-4; G-CSF with IL-17, IL-2, IL-6, IL-8, and IFN-γ; MCP-1 with G-CSF, IL-6, IL-1ra, IFN-γ, IL-17, IL-2, and MIP-1a; PDGF-bb with eotaxin; RANTES with eotaxin, IL-13, MIP-1a, and PDGF-bb; TNF-a with IFN-γ, IL-17, IL-2, IL-6, and IL-1b; VEGF with G-CSF, IL-17, IL-1b, IL-1ra, IL-4, MIP-1a, MIP-1b, TNF-a.
Some correlations were detected in the plasma from patients before and after treatment but not in the plasma from donors: MCP-1 with IL-1b, IL-1ra, IL-2; G-CSF with IL-1ra and IL-4; GM-CSF with IL-2; IL-15 with IL-13; IL-17 with IL-1ra; IL-17 with IL-2; IL-8 with IL-2; MIP-1a with G-CSF, IL-1b, and IL-4; MIP-1b with IL-1ra; TNF-a with IL-1ra, IL-4, MIP-1a; VEGF with bFGF, IL-2, IL-5, IL-6, IL-8.
Some correlations were revealed in the plasma from donors and patients after treatment: IL-2 with IL-7, IL-10, IL-12, IL-13; IL-5 with IFN-γ; IL-6 with IL-12, GM-CSF; IL-7 with IL-10, IL-17, IFN-γ; IL-8 with bFGF; IL-10 with IL-13 IL-17; IL-12 with IFN-γ; IL-13 with VEGF; IFN-γ with bFGF.
In addition to analyzing the cytokine and chemokine interconnections in the plasma from DLBCL patients, correlations between the gene expression in MSCs from 5 patients and the concentration of cytokines in the plasma from these patients were also analyzed (Table 1 patients N3-7, Table S5 in the Supplement). The concentrations of IL-1b, IL-2, IL-4, IL-5 (p = 0.041 with BMP2), IL-10 and IL-15 (p = 0.02 with BMP2), VEGF (p = 0.021 with BMP2), and bFGF (p = 0.024 with BMP2) were closely positive correlated with BMP2 and SOX9. Moreover, BMP2 expression was closely correlated with the levels of IL-8, IL-9, IL-12, IL-13, IL-17, GM-CSF, and MCP-1 (p = 0.024). IL-4 and IL-7 were closely correlated with the expression of FGFR1, FGFR2, and VEGF.
There were reverse correlations between the content of IL-6 in the plasma from patients and the RELs of MMP2, SPP1, ICAM1, and SMURF in the MSCs. Close reverse correlation was observed between the eotaxin concentration and expression of IL-6 and SOX9 (p = 0.015), between G-CSF concentration and expression of ICAM1 (p = 0.033) and SMURF in MSCs; between concentration of MIP-1b and expression of bFGF (p = 0.025) and IL-8 (p = 0.02); and RANTES concentration was found to be closely correlated with the expression of FGFR2 (R = –0.958, p = 0.01). The SMURF expression was inversely correlated with the plasma concentrations of IP-10, MIP-1a, and RANTES. Data on the observed correlations are presentred in Supplement (Table S4 in the Supplement). No other close relationships between the plasma cytokine and chemokine concentrations and gene expression were detected.
Prior to the treatment, concentration of fibroblasts (CFU-F) in the BM derived from the patients with DLBCL closely correlated with the plasma concentration of the following cytokines: IL-1ra (R = 0.717, p > 0.05), IL-6 (R = 0.956, p = 0.022), IL-8 (R = 0.717, p > 0.05), G-CSF (R = 0.717, p > 0.05), MIP-1a (R = 0.717, p > 0.05), VEGF (R = 0.717, p > 0.05), however, a significant correlation of the CFU-F was observed only for IL-6. After the treatment, there were no positive correlations between the concentration of cytokines in plasma and the CFU-F concentration.
Based on these changes, it was suggested that the plasma from patients affected the MSCs derived from the healthy donors.
The effects of plasma from patients with DLBCL on MSCs from healthy donors. Cultivation of the donor-derived MSCs in the presence of the plasma from donors and patients with DLBCL before and one month after the end of treatment revealed significant changes in the total cellular production of MSCs for 2 studied passages (passages 3 and 4). Cultivation of the donor’s MSCs in the presence of plasma from patients before the treatment reduced cell production, while the plasma from the patients after treatment increased it (Fig. 3a).
The number of MSCs in the cultures treated by donor’s plasma directly correlated with the concentration of GM-CSF in the donor plasma (R = 0.708, p = 0.018). No correlations were found between the donor MSC production in the presence of plasma from the DLBCL patients before treatment and the plasma cytokine concentrations in these patients. When the MSCs from donors were cultivated with the plasma from patients after treatment, cumulative cell production had only inverse correlations with IL-2 (R = –0.729), IP-10 (R = –0.742), MCP-1 (R = –0.801) and RANTES (R = –0.814) concentrations.
Analysis of the surface markers on the MSCs from donors after cultivation in the presence of the plasma from healthy donors and from patients with DLBCL showed that the percentage of MSCs expressing CD54 (ICAM1) significantly increased (almost 2-fold, p = 0.0032) when the cells were cultivated with the plasma from patients taken at the onset of the disease compared with the cells cultured in the presence of plasma from the donors. Cultivation of the MSCs from the donors with the plasma from the patients after treatment led to a significant decrease in the percentage of CD54+ MSCs, approaching the values observed in the cells treated with donor’s plasma (Fig. 3b). At the same time, the MFI level of CD54 increased in the MSCs treated with the plasma from patients (Fig. 3c). The REL of the ICAM1 gene increased in the MSCs treated with the plasma taken from patients at the onset of the disease and remained elevated after treatment. ICAM1 is an adhesion molecule that ensures interaction of MSCs with lymphocytes, and its increase indicates activation of the MSCs treated with the plasma from patients. The MFI values of CD105 (ENG) and CD146 (MCAM) decreased in the MSCs cultured with the plasma from patients. The MFI of CD274 (PD-L1) increased in the MSCs after addition of the plasma obtained from the patients at the onset of the disease and increased even more when treated with the plasma from patients after treatment.
Fig. 3. The effect of plasma from the DLBCL patients on MSCs of the healthy donors. a) Total donors MSCs production in the presence of healthy donors and patients before and after treatment plasma. Data presented as box and whisker plot (5-95 percentiles). b) Alterations in the surface markers expression on the MSCs derived from donors and cultivated in the presence of the plasma from patients in comparison with cultivation with the plasma from donors. c) Alterations in the gene expression in the MSCs derived from donors cultivated in the presence of the plasma from patients in comparison with cultivation with the plasma from donors. MSCs from 10 healthy donors cultivated in the presence of the plasma from donors (5 samples) and from the DLBCL patients before (21 samples) and after the treatment (18 samples) were analyzed.
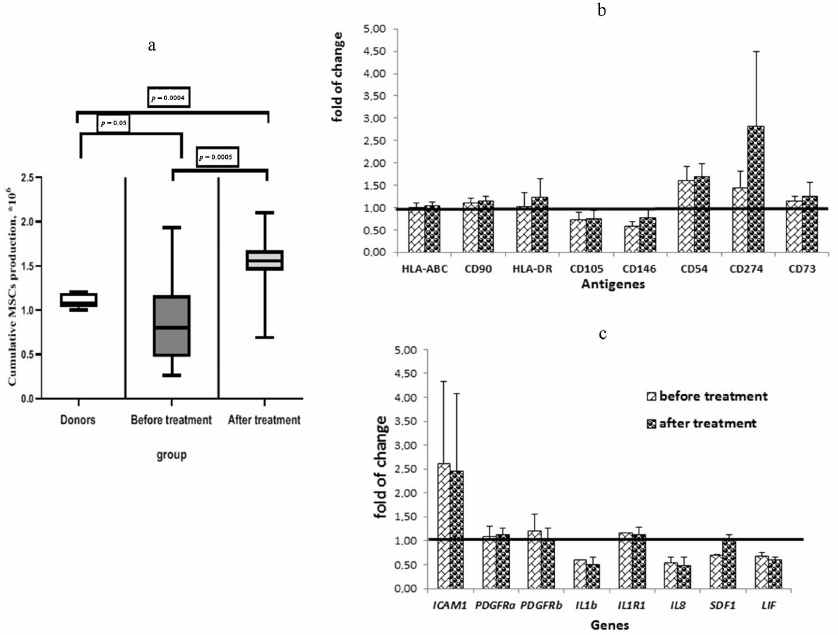
When analyzing the RELs of genes, it was found that expression of IL-1b, IL-8, SDF1, and LIF was reduced in the MSCs treated with the plasma from patients (Fig. 3c). Expression of SDF1 in the MSCs cultivated with the plasma taken from the patients after treatment was increased to the level corresponding to that in the MSCs cultivated with the plasma from donors.
DISCUSSION
Cytokines and chemokines are secreted into the blood by various tissues. Normally, all factors that regulate hematopoiesis are secreted by various organs; for example, GM-CSF and G-CSF are secreted by lungs, muscles, bladder endothelium, and lymphocytes [14]. IL-6 is produced by smooth muscle cells, vascular endothelium, and macrophages [15]. Chemokines are also produced by a large number of tissues and tumor cells [6]. BM stromal cells, including MSCs, are involved in the secretion of cytokines and chemokines that regulate hematopoiesis and immune response [11]. The cytokine concentration in blood is very low but can increase many fold depending on the needs of the organism. The balance of cytokines and their relationships can change with pathology. This study of the plasma from DLBCL patients showed a significant increase in the concentration of at least 14 cytokines out of 27 studied compared with that in the plasma from donors. Concentration of some of the cytokines normalized after the patients achieved remission and at the end of treatment. However, other cytokines, such as bFGF, eotaxin, VEGF and RANTES, remained elevated. We also observed similar changes in the bFGF expression in the MSCs from patients, which indicated contribution of MSCs to elevation of this factor concentration in the plasma from patients.
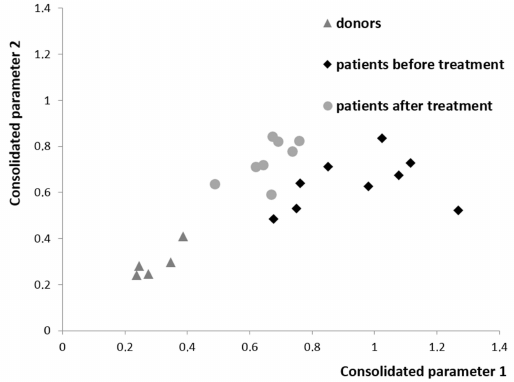
Comprehensive analysis of the differences between the levels of all studied cytokines, chemokines and correlations between them revealed a clear separation of healthy donors and patients before and after treatment (Fig. 4). The identified changes may be associated either with secretion by tumor cells, or response of the body tissues including MSCs to the presence of a tumor, or therapy. The analysis shows that, when remission is achieved in the patients with DLBCL, composition of the plasma cytokines normalizes, but does not reach the level of the one observed in the healthy donors. Not only the balance of cytokines in the blood plasma, but also changes in the bone marrow stroma remain partially disturbed likely in part due to the chemotherapy courses.
Fig. 4. Projection of the data for all chemokines and cytokines in the plasma from the healthy donors and from the patients with DLBCL before and after treatment onto consolidated parameter axis. The point in the diagram shows how many times the sample is closer to the group of donors than to the group of patients before the treatment (abscissa axis) or after the treatment (ordinate axis). Procedure for calculation of the distance in the multidimensional space between the sample and the group is presented in the Supplement.
The relationship between cytokines is of great importance for the regulation of hematopoiesis and inflammation. In the plasma of healthy donors, normal correlations in the body have been identified ensuring maturation of the hematopoietic cells [16]. Some of these relationships persist in patients with DLBCL. These are correlations of factors involved in the maturation of megakaryocytes, dendritic cells, and some subpopulations of T and B lymphocytes.
At the onset of the disease, changes occurred that were most likely associated with the presence of a tumor in the body. There was an increase in the inflammatory factors such as IL-6, IL-17, G-CSF, MCP-1, and MIP-1a that stimulated production and maturation of neutrophils and macrophages. The levels of most of these factors at the onset of the disease correlated with each other.
Regulation of the innate immunity by the effector and regulatory B cells is associated with the expression of IL-12 and IFN-γ (effector cells) and IL-10 (regulatory cells) [10]. There was no correlation between IL-12, IFN-γ, and IL-10 in the plasma from patients at the onset of the disease. After treatment, strong connection emerged between these cytokines, which indicated that the mechanism of innate immunity had been damaged in the patients at the onset of the disease but restored after the treatment.
IL-4, IL-2, and IL-13 secreted by the effector B cells and IL-10 secreted by the regulatory B cells are involved in the regulation of adaptive immunity. In patients prior to treatment, the levels of IL-2 and IL-4 were correlated, and the levels of the rest of the cytokines were unrelated. However, after the end of treatment, correlation developed between IL-2, IL-12, and IL-10, which indicated restoration of the B cell functions involved in the adaptive immune response. The level of IL-10 increased in the plasma from patients before treatment (Fig. 1). A similar increase was found in the mouse models of lupus erythematosus [17]. After treatment, the level of IL-10 normalized. It is known that the cytokine profile secreted by B cells can be altered in various diseases; it has been found to normalize after the treatment of patients with rituximab [10].
The changes occurring in the patients with DLBCL without BM involvement affect not only hematopoietic cells and cytokines but also other tissues, including stromal microenvironment of the BM. In the plasma from patients the levels of IL-6 and MIP-1a were significantly increased prior to the treatment, and after the treatment, they were reduced to normal values. These cytokines are involved in the acute inflammatory state. Their plasma concentrations correlated with the concentration of CFU-F in the BM, which indicated response of the stromal precursors to the inflammatory process in the body. When remission was achieved, the correlations disappeared, which was most likely because without the tumor and acute inflammatory process, the concentration of CFU-F could be regulated by other factors.
IL-10 is secreted by DLBCL cells [18]. The concentrations of IL-8, MIP-1a and IL-10 were increased in the various fluids associated with the tumor and in the peritumoral tissue [6]. It was shown that concentrations of IL-8, IP-10, MCP-1, MIP-1β, IL-6, IL-12p40/p70, MIP-1α, IFN-α, G-CSF, and IL-2R decreased in the peritumoral tissue after removal of the brain tumors [19]. Hence, the data obtained in our work showing increase of the cytokine/chemokine concentration levels and interrelation between these parameters in the DLBCL patient plasma indicate that the tumor is likely to make a significant contribution to the secretion of these cytokines and chemokines.
Characteristics of MSCs are changed in the DLBCL patients including total cell production, immunophenotypes, and expression level of many genes [3]. In this study relationships between the concentration of cytokines in the plasma from patients and expression of the certain genes in the MSCs from these patients at the onset of the disease were analyzed. Direct correlations were found between the expression of genes associated with proliferation, differentiation, and vascular formation in MSCs and the elevated levels of pro-inflammatory cytokines and GM-CSF in the plasma from these patients. This explains the changes in the properties of the MSCs derived from BM of these patients. An inhibitory effect of the increase in the levels of IL-6, G-CSF, RANTES, MIP-1a, and MIP-1b in the plasma from patients on the expression of genes involved in differentiation of MSCs and adhesion of lymphocytes to stromal cells was revealed. Since MSCs are one of the main components of the niche for hematopoietic stem cells, a change in their characteristics in the diseases involving BM has been actively studied. [20]. However, even without the direct contact of tumor cells with BM, significant changes occur in the MSCs. Moreover, it could be assumed that there is a feedback loop between the concentration of cytokines in plasma and the secretion of cytokines by MSCs [21]. It was shown that the IL-6, IL-8, MCP-1, TNFα, ICAM1, and M-CSF protein levels were increased in the MSC secretome of the patients with DLBCL without BM involvement compared with the levels seen in the MSCs from the healthy donor [22]. Thus, MSCs from the BM of patients with DLBCL contribute to the changes in the concentration and balance of the plasma cytokine levels in the patients at the onset of the disease.
Based on the obtained results, we decided to study the effect of the plasma from DLBCL patients on MSCs from the healthy donors. It was shown that addition of the plasma taken from the patients at the onset of the disease to the culture media significantly reduced the total production of MSCs derived from the healthy donors, while addition of the plasma taken from the patients after treatment increased the plasma cell production 2-fold (Fig. 3a). In addition to the changes in total cell production, MSC surface markers also changed. When plasma taken from the patients at the onset of the disease was added to the culture medium, the ability of MSCs to adhere to lymphocytes increased due to the increased expression of ICAM1 at both RNA (Fig. 3c) and protein levels. Moreover, the factors that increased ability of MSCs to inhibit activation of lymphocytes (PD-L1) were identified in the plasma taken from the patients before and after treatment. At the same time, the ability to regulate hematopoietic stem cells and endothelial cells decreased in these MSCs due to reduction in the ENG and MCAM levels (Fig. 3b). Increase in the expression of HLA-DR on the MSCs from the healthy donor following addition of the plasma from patients could be associated with activation of these cells.
All cytokines whose expression was reduced in the MSCs cultured with the plasma from patients are involved in the regulation of hematopoietic cells and immune response. Expression of SDF1 in the MSCs cultured with the plasma taken from the patients after treatment, unlike other cytokines, increased to the level observed in the MSCs treated with the donor plasma (Fig. 3b). These data indicate that the ability of MSCs to regulate hematopoietic cell migration in the BM was normalized and that the MSCs changes occurring during DLBCL could be reversible.
Thus, concentration of the proinflammatory and regulating hematopoietic cytokines in the plasma from patients with DLBCL was changed. The balance between these cytokines was disturbed at the onset of the disease and partially restored after the end of treatment and upon remission. Obviously, the presence of a B cell tumor in the organism affects all tissues, including the BM stroma. It was shown that this effect is carried out, at least in part, through soluble factors. MSCs without direct contact with the tumor cells change their properties, including the factors expressed and secreted by them, contributing to the change in the blood cytokine profile. Cultivation of the MSCs from healthy donors in the presence of plasma from the patients with DLBCL led to the changes similar to those observed in the MSCs derived from the patients. Overall, the obtained data indicate the influence of the tumor on the BM stromal microenvironment in the DLBCL patients, regardless of the intercellular contact of MSCs with the tumor cells. The results of this work demonstrate humoral regulation of the bone marrow stroma by tumor cells.
Funding. This work was supported by the Russian Foundation for Basic Research (project no. 17-04-00170).
Acknowledgments. The authors are grateful to O. Pshenichnikova for a productive discussion of the materials of this work.
Ethics declarations. The authors declare no conflict of interest in financial or any other sphere. All procedures performed in studies involving human participants were in accordance with the ethical standards of the institutional and/or national research committee and with the 1964 Helsinki declaration and its later amendments or comparable ethical standards.
Supplementary information. The online version contains supplementary material available at https://doi.org/10.1134/S0006297921020097.
REFERENCES
1.Beltran, B. E., Quiñones, P., Morales, D.,
Malaga, J. M., Chavez, J. C., et al. (2018) Response and survival
benefit with chemoimmunotherapy in Epstein–Barr virus-positive
diffuse large B-cell lymphoma, Hematol. Oncol., 36,
93-97, doi: 10.1002/hon.2449.
2.Swerdlow, S. H., World Health Organization,
International Agency for Research on Cancer (2017) WHO classification
of tumours of haematopoietic and lymphoid tissues. Revised 4t. Lyon:
International Agency for Research on Cancer, 2017.
3.Fastova, E. A., Magomedova, A. U., Petinati, N. A.,
Sats, N. V., Kapranov, N. M., et al. (2019) Bone marrow multipotent
mesenchymal stromal cells in patients with diffuse large B-cell
lymphoma, Bull. Exp. Biol. Med., 167, 150-153, doi:
10.1007/s10517-019-04480-6.
4.Chen, Q., Yuan, Y., and Chen, T. (2014) Morphology,
differentiation and adhesion molecule expression changes of bone marrow
mesenchymal stem cells from acute myeloid leukemia patients, Mol.
Med. Rep., 9, 293-298, doi: 10.3892/mmr.2013.1789.
5.Shipounova, I. N., Petrova, T. V, Svinareva, D. A.,
Momotuk, K. S., Mikhailova, E. A., and Drize, N. I. (2009) Alterations
in hematopoietic microenvironment in patients with aplastic anemia,
Clin. Transl. Sci., 2, 67-74, doi:
10.1111/j.1752-8062.2008.00074.x.
6.Kotyza, J. (2017) Chemokines in tumor proximal
fluids, Biomed. Pap. Med. Fac. Univ. Palacky. Olomouc Czech
Repub., 161, 41-49, doi: 10.5507/bp.2016.062.
7.Vilgelm, A. E., and Richmond, A. (2019) Chemokines
modulate immune surveillance in tumorigenesis, metastasis, and response
to immunotherapy, Front. Immunol., 10, 333, doi:
10.3389/fimmu.2019.00333.
8.Mantovani, A., Allavena, P., Sica, A., and
Balkwill, F. (2008) Cancer-related inflammation, Nature,
454, 436-444, doi: 10.1038/nature07205.
9.Okrój, M., and Potempa, J. (2019) Complement
activation as a helping hand for inflammophilic pathogens and cancer,
Front. Immunol., 9, 3125, doi:
10.3389/fimmu.2018.03125.
10.Lund, F. E. (2008) Cytokine-producing B
lymphocytes-key regulators of immunity, Curr. Opin. Immunol.,
20, 332-338, doi: 10.1016/j.coi.2008.03.003.
11.Munir, H., Ward, L. S. C., and McGettrick, H. M.
(2018) Mesenchymal stem cells as endogenous regulators of inflammation,
Adv. Exp. Med. Biol., 1060, 73-98, doi:
10.1007/978-3-319-78127-3_5.
12.Schmittgen, T. D., and Livak, K. J. (2008)
Analyzing real-time PCR data by the comparative CT method, Nat.
Protoc., 3, 1101-1108, doi: 10.1038/nprot.2008.73.
13.Metcalf, D. (2008) Hematopoietic cytokines,
Blood, 111, 485-491, doi:
10.1182/blood-2007-03-079681.
14.Metcalf, D., Willson, T. A., Hilton, D. J., Di
Rago, L., and Mifsud, S. (1995) Production of hematopoietic regulatory
factors in cultures of adult and fetal mouse organs: measurement by
specific bioassays, Leukemia, 9, 1556-1564.
15.Lyman, G. H., and Dale, D. C. (2010)
Introduction to the Hematopoietic Growth Factors, Springer,
Boston, MA, pp. 3-10.
16.Lenert, P., Brummel, R., Field, E. H., and
Ashman, R. F. (2005) TLR-9 activation of marginal zone B cells in lupus
mice regulates immunity through increased IL-10 production, J. Clin.
Immunol., 25, 29-40, doi: 10.1007/s10875-005-0355-6.
17.Ma, N., Zhang, Y., Liu, Q., Wang, Z., Liu, X., et
al. (2017) B cell activating factor (BAFF) selects IL-10-B cells over
IL-10+B cells during inflammatory responses, Mol. Immunol.,
85, 18-26, doi: 10.1016/j.molimm.2017.02.002.
18.Li, L., Zhang, J., Chen, J., Xu-Monette, Z. Y.,
Miao, Y., et al. (2018) B-cell receptor-mediated NFATc1 activation
induces IL-10/STAT3/PD-L1 signaling in diffuse large B-cell lymphoma,
Blood, 132, 1805-1817, doi:
10.1182/blood-2018-03-841015.
19.Portnow, J., Badie, B., Liu, X., Frankel, P., Mi,
S., et al. (2014) A pilot microdialysis study in brain tumor patients
to assess changes in intracerebral cytokine levels after craniotomy and
in response to treatment with a targeted anti-cancer agent, J.
Neurooncol., 118, 169-177, doi:
10.1007/s11060-014-1415-4.
20.Cheng, H., Sun, G., and Cheng, T. (2018)
Hematopoiesis and microenvironment in hematological malignancies,
Cell Regen., 7, 22-26, doi: 10.1016/j.cr.2018.08.002.
21.Zhong, W., Zhu, Z., Xu, X., Zhang, H., Xiong, H.,
et al. (2019) Human bone marrow-derived mesenchymal stem cells promote
the growth and drug-resistance of diffuse large B-cell lymphoma by
secreting IL-6 and elevating IL-17A levels, J. Exp. Clin. Cancer
Res., 38, 73, doi: 10.1186/s13046-019-1081-7.
22.Petinati, N. A., Sats, N., Drize, N. J.,
Malyants, I., Shender, V., et al. (2019) Alterations in secretome and
transcriptome of bone marrow derived MSCs in patients with diffuse
large B-cell lymphoma without bone marrow involvement, Blood,
134, 1514-1514, doi: 10.1182/blood-2019-122431.
Supplementary Material (PDF)