RNA Aptamers for Theranostics of Glioblastoma of Human Brain
Alexey M. Kopylov1,a,*, Lika V. Fab2, Olga Antipova1, Ekaterina A. Savchenko3, Alexander V. Revishchin2, Viktoriya V. Parshina2, Svetlana V. Pavlova2, Igor I. Kireev1, Andrey V. Golovin1,4, Dmitry Y. Usachev3, and Galina V. Pavlova2,3,4
1Chemistry Department, Lomonosov Moscow State University, 119991 Moscow, Russia2Institute of Higher Nervous Activity and Neurophysiology, Russian Academy of Sciences, 117485 Moscow, Russia
3Burdenko National Medical Research Center of Neurosurgery, Ministry of Health of the Russian Federation, 125047 Moscow, Russia
4Sechenov First Moscow State Medical University, 119991 Moscow, Russia
* To whom correspondence should be addressed.
Received May 26, 2021; Revised June 15, 2021; Accepted June 15, 2021
Conventional approaches for studying and molecular typing of tumors include PCR, blotting, omics, immunocytochemistry, and immunohistochemistry. The last two methods are the most used, as they enable detecting both tumor protein markers and their localizations within the cells. In this study, we have investigated a possibility of using RNA aptamers, in particular, 2′-F-pyrimidyl-RNA aptamer ME07 (48 nucleotides long), specific to the receptor of epidermal growth factor (EGFR, ErbB1, Her1), as an alternative to monoclonal antibodies for aptacytochemistry and aptahistochemistry for human glioblastoma multiforme (GBM). A specificity of binding of FAM-ME07 to the receptor on the tumor cells has been demonstrated by flow cytometry; an apparent dissociation constant for the complex of aptamer – EGFR on the cell has been determined; a number of EGFR molecules has been semi-quantitatively estimated for the tumor cell lines having different amount of EGFR: A431 (106 copies per cell), U87 (104 copies per cell), MCF7 (103 copies per cell), and ROZH, primary GBM cell culture derived from patient (104 copies per cell). According to fluorescence microscopy, FAM-ME07 interacts directly with the receptors on A431 cells, followed by its internalization into the cytoplasm and translocation to the nucleolus; this finding opens a possibility of ME07 application as an escort aptamer for a delivery of therapeutic agents into tumor cells. FAM-ME07 efficiently stains sections of GBM clinical specimens, which enables an identification of EGFR-positive clones within a heterogeneous tumor; and providing a potential for further studying animal models of GBM.
KEY WORDS: 2′-fluoro-pyrimidyl-RNA-aptamer, EGFR, human glioblastoma, cell cultures, flow cytometry, fluorescence microscopyDOI: 10.1134/S0006297921080113
Abbreviations: 2′-F-Py, 2′-fluoropyrimidine; A431, human epidermoid carcinoma cell line; aKD, apparent dissociation constant; EGFR, receptor of epidermal growth factor; FAM, 5(6)-carboxyfluorescein; GBM, human glioblastoma multiforme; MCF7, human luminal breast adenocarcinoma cell line; MoRE, molecular recognition element; U87, human glioblastoma cell line.
INTRODUCTION
Designing molecular recognition elements (MoREs) for theranostics involves, as the first step, investigating a possibility of MoRE application for identification of potential therapeutic targets; in our case, transmembrane receptor of epidermal growth factor (EGFR, glioblastoma tumor marker), in the tumor. At the second step, possibilities to block the targeted receptor with the MoRE or receptor-mediated delivery of tumor antiproliferation agents using the MoRE are explored. The theranostics of human glioblastoma multiforme (GBM) commonly uses monoclonal antibodies and their derivatives for EGFR identification on the cell/tumor surface and suppression of proliferation of EGFR-positive cells [1]. Recently, it was suggested that the antibodies could be replaced with aptamers.
One of the chapters in the book Molecular Biology. Ribosomes and Protein Synthesis by A. S. Spirin is titled “Evolution of ancient RNA world through systematic exponential enrichment” [2]. It starts with the following paragraph: “In 1990, three research groups in the USA (Gold and Tuerk, Ellington and Szostak, Robertson and Joyce) simultaneously suggested a methodology for the cell-free selection or cell-free evolution in a test tube that allowed rapid targeted production of synthetic non-coding RNA with specified functional activities, such as interactions with specific ligands (aptamers) or catalysis of specific chemical reactions (ribozymes), and for improving the functions of these RNAs. Repeated rounds of RNA selection and amplification (Systematic Evolution of Ligands by EXponential enrichment, SELEX) is a cornerstone of the ‘evolution-in-a-test tube’ technology” [2].
Basically, the main goal is to select unique RNA tertiary structures that would provide high affinity and specificity of aptamer irrespectively of the nature of targeted molecule (low-molecular-weight dye [3] or protein [4]) or RNA molecule function (ribozyme) [5]. In this regard, RNA molecules exhibit a high potential for the formation of complex three-dimensional structures. The presence of the 2′-hydroxyl group in each nucleotide provides a possibility of RNA interactions with multiple intramolecular donors and acceptors of hydrogen bonds, which could stimulate and define folding of RNA molecule, as well as stabilize its 3D structure. That is why early SELEX studies used randomized libraries made of RNA.
On the other hand, the presence of 2′-hydroxyl group has a negative impact, as it drives a susceptibility of RNA molecules to hydrolysis, which is critical for future applications of aptamers, for example, in tumor diagnostics and therapy (theranostics, aptatheranostics). Therefore, combinatorial libraries of RNAs with modified sugar residues have been used for aptamer selection [6]. Currently, the most popular derivatives are 2′-O-methyl- and 2′-fluoro-derivatives and the so-called locked nucleic acids (LNAs, also known as bridged nucleic acids, BNAs) [7]. And finally, combinatorial DNA libraries have nucleotides lacking the 2′-hydroxyl group.
It has to be stressed that selection does not yield a single molecule, but a family of molecules with similar affinities. This provokes a number of questions. Firstly, the finalists of selection, the aptamers, have different primary and spatial structures, even when belong to the same family. How do these different structures provide a specificity of interactions with the same target? Secondly, when structurally different aptamers from the same family are selected against the same or several protein epitopes, do the complexes have different or the same interfaces? And, finally, how do the properties of aptamers, derived by different selection processes, compare to each other?
Some questions can be answered when structures of both the target and the aptamers are known. One of this kind of targets is the receptor of epidermal growth factor (EGFR; Her1, ErbB1), for which a large number of RNA and DNA aptamers and the modified derivative have been selected. As a member of tyrosine kinase receptor family, EGFR is a common target in many types of cancer. Many antibodies against EGFR are available, both commercial and therapeutic ones. At present, clinical trials are underway for some types of tumors including GBM [1]. Toxic conjugates of therapeutic antibodies have been created that are currently tested in clinical trials. Therefore, EGFR is rather useful for investigating both theoretical and practical aspects of aptamer application.
EGFR is a receptor tyrosine kinase oncogene commonly overexpressed in human malignant neoplasms. It is activated by the binding of growth factors, resulting in the initiation of intracellular signaling and stimulation of cell migration, adhesion, invasion, proliferation, angiogenesis, and suppression of apoptosis [8]. This makes EGFR an attractive target in the therapy of malignant tumors. The level of expression of EGFR varies from thousands of molecules per cell in healthy cells to millions of molecules per cell in some tumor cell lines [9-11]. The most common EGFR mutant is EGFRvIII, which lacks the extracellular part of the receptor (residues 6 to 273, exons 2-7). This variant is expressed in gliomas, non-small cell lung carcinomas, and breast carcinomas. It was estimated by quantitative cytofluorimetric analysis of cells derived from human glioma biopsy that the number of EGFRvIII molecules could reached several hundred thousand copies per cell [12].
The pioneer studies on the selection of RNA aptamers for EGFR and on their properties have been made by the Ellington group, although the structure of the aptamers has not been examined. A 104-nucleotide (nt) RNA aptamer (J18) for EGFR extracellular domain was generated by 12 rounds of selection using the classic SELEX approach from an RNA library with a very large 62-nt randomized region. J18 bound the target with an apparent dissociation constant (aKD) ~7 nM [13, 14], and it interacted with neither murine EGFR, nor hErbB2 (Her2/neu).
J18 also bound to the native receptor within the membrane of human epidermoid carcinoma A431 cells. These cells contain extremely high amounts of the receptor on the cell surface, 1-3 millions of molecules per cell [10]. The complexes of cells with the phycoerythrin-labeled aptamers were analyzed by flow cytometry. The binding of J18 to A431 cells was inhibited by the therapeutic antibody against EGFR (Mab 225) [15, 16]. As demonstrated by fluorescence microscopy, the binding of J18 to A431 cells was blocked with a 10-fold excess of human epidermis growth factor EGF (but not murine EGF) and by Mab 225 antibody. Approximately ~35% aptamer was internalized after 30-min incubation at 37°C; while at low temperatures, all aptamer-receptor complexes remained on the cell surface.
Because of the high susceptibility of J18 to hydrolysis, next selection of RNA aptamers for EGFR was made using 2′-F-pyrimidyl RNA derivatives (2′-F-Y-RNA) [13]. Selection was performed against recombinant chimeric protein – extracellular domain of the receptor (L25–S645) fused to IgG1 Fc fragment (P100–K330) with the peptide linker IEGRMD, yielding a high-affinity 93-nt aptamer with aKD = 2.4 nM.
To introduce a fluorescent label into the aptamer, the following approach was used. 24-nt oligonucleotide probe labeled with 6-carboxyfluorescein (FAM) and complementary to the sequence at the 3′-end extension of the aptamer (anchoring sequence) was designed. Hybridization for 10 min at 70°C followed by annealing resulted in the formation of the hybrid that could be used for fluorescent detection of EGFR. The anchoring sequence was used for immobilization of the aptamer on glass [13] or gold [14] surfaces.
To generate new aptamer variants, the following strategy had been applied [17]. After selection from 2′-F-Y-RNA-library, a new sub-library was synthesized using the leader aptamer, E01, as a blueprint and randomizing 30% of nucleotides as described previously [18]. A series of seven 2′-F-Y-RNA-aptamers, E01–E07, was selected from the sub-library. The 92-nt aptamer E07 exhibited aKD = 2.4 nM (compared to 36 nM for the murine receptor, mEGFR). The anchoring probe was modified with biotin that was then used to introduce streptavidin-conjugated fluorophore, phycoerythrin.
Aptamer E07 interacted with A431 cells; 23% of E07 was internalized, comparing with 28% for C225 antibody and 71% for EGF.
E07 inhibited activation of the EGFR-dependent phosphorylation cascade (initiated with 2 nM EGF) with IC50 = 300 nM, vs. ICmax = 100 nM for C225 antibody [17].
E07 and its derivatives were used for studying proliferation and migration in microchannels [19], electrical detection of cellular EGFR in metal nanogaps [20], and separation of EGFR-positive cells [21, 22].
The current directions in the studies of aptamers against EGFR are quite diverse. One is a minimization of the E series aptamers, for example, generation of the 47-nt aptamer ME07 [23]. The affinity of ME07 for the EGFR extracellular domain measured using bilayer interferometry was high (aKD = 0.3 nM), although its affinity for the EGFRvIII mutant was 1000 times lower (aKD = 0.3 µM) [24, 25]. Another direction is a generation of aptamer derivatives for the in vivo tumor visualization for animal models. In particular, conjugates of hollow gold nanoparticles with E07 labeled with the gamma-emitter 111In were used for the visualization of highly malignant oral tumor OSC-19 in nude mice by the method of single-photon emission computed tomography. The aptamer conjugates accumulated in the tumor two times faster than the antibody conjugates [26]. A431 tumor xenografts in mice were visualized by positron emission tomography (PET) using 18F-benzoyl-ME07; in the images, the tumor/blood signal ratio was 3.9, and the tumor/muscles signal ratio was 8.7 [24, 25].
Internalization of complexes of E07 with cellular EGFR support an idea that E07 could be an escort aptamer for delivery of gemcitabine and its oligomeric forms into the tumor cells [27]. Besides, aptamer-siRNA chimera (AsiC) was used for a delivery of siRNAs into the cells for gene knockdown. In particular, the chimera of anti-HOTAIR siRNA (HOX antisense intergenic RNA) with E07 was effectively internalized into the endosomes of the triple negative breast cancer cells, followed by the knockdown of the target gene [28]. Due to a small size, aptamers, unlike the antibodies, could be used as unique MoREs for a detection of single molecules in live cells by the super-resolution microscopy [29-31].
In addition to the E series, other anti-EGFR RNA aptamers [32, 33], DNA aptamers [34, 35], and mixmers [36] with various functional properties, have been generated, although comparative analysis of these aptamers is difficult due to the lack of data on the epiapts and paraapts, which is also true for epitopes and paratopes of antibodies.
Targeted modification of aptamers with various fluorophores, as well as a development of methods for fluorescent detection, are important for gaining of fundamentally new information on mechanisms of aptamer interactions with the cells, and a fate of the internalized aptamers. These studies are required for a development of aptamer-based theranostics, which will likely have a higher clinical potential than immunotheranostics.
MATERIALS AND METHODS
Oligonucleotides. DNA oligonucleotides were synthesized and HPLC-purified by Evrogen (Russia). Fluorescently labeled 2′-F-RNA aptamer FAM-ME07 was synthesized and HPLC-purified by Sintol (Russia). Minimized variant of RNA aptamer MJ18 was synthesized with a MegaScript transcription kit (Thermo Fisher Scientific, USA) using PCR-amplified double-stranded DNA template containing the aptamer, primer, and RNA polymerase T7 promoter sequences. Transcription protocol included treatment with DNase and purification by repeated dissolution/precipitation. An additional 18-nt fragment at the 3′-end of the RNA aptamer, complementary to the FAM-labeled DNA 18-mer (FAM-CATTTAGGACCAACACAA), was used for the introduction of fluorescence label (table).
Oligonucleotide sequences
All buffer salts were of reagent grade (Biomedicals, France). Oligonucleotide solutions (10 µM) were prepared in phosphate buffered saline (PBS) (Thermo Fisher Scientific) containing 5 mM MgCl2 (Sigma-Aldrich, USA). The oligonucleotides were refolded in solution by heating to 75°C followed by slow cooling to 25°C.
Cell lines. Epithelial carcinoma A431, glioblastoma U87, fibroblast dF, and breast cancer MCF7 cell lines were purchased from the Institute of Cytology, Russian Academy of Sciences, St. Petersburg, Russia. The cells were cultured in modified Dulbecco medium (DMEM, Gibco, USA) supplemented with 10% fetal bovine serum (FBS, Thermo Fisher Scientific) in 5% CO2 at 37°C. The ROZH cell line was obtained from the Burdenko National Medical Research Center of Neurosurgery, Russia. The cell culture derived from the glioblastoma tumor tissue was used with the approval of the Ethics Committee of the Burdenko National Medical Research Center of Neurosurgery.
Culturing of tumor cells and cell lines. Cell liners and primary cell cultures were cultured in DMEM/F12 medium with sodium pyruvate (Gibco) supplemented with 10% FBS, 1% HEPES (Thermo Fisher Scientific), 1% GlutaMAX (Thermo Fisher Scientific), and 1% antibiotic/antimycotic solution (penicillin/amphotericin; Cytiva, USA) in a CO2 incubator (BINDER GmbH, Germany) at 37°C.
Flow cytometry of RNA aptamer MJ18. For introduction of the fluorescent label, 1 µM solution of RNA oligonucleotide MJ18 and FAM-DNA primer in PBS containing 5 mM MgCl2 was heated for 3 min to 75°C and then cooled to room temperature at a rate of 1°C/min.
For flow cytometry, the grown cells were suspended, divided into 500,000-cell portions, washed three times with the buffer, and resuspended in 500 µl PBS containing 100 nM duplex of MJ18 with FAM-Harm. Control cells were incubated with FAM-Harm. For the positive control, the cells were incubated with 1 µg/ml anti-EGFR H11 antibody (Thermo Fisher Scientific) for 1 h at room temperature in the dark; next, secondary anti-mouse Cy-5-conjugated AffiniPure antibodies (dilution 1 : 200 in PBS; Jackson ImmunoResearch, United Kingdom) were added and incubated for 1 h at 20°C. The cells were washed three times with the buffer and analyzed with an Attune NxT flow cytometer (Thermo Fisher Scientific); the fluorescence signal was measured in the BL1 channel (488 nm, cut-off set at 10,000 events). The data were analyzed with the FACSDiva ver. 02 software (Becton Dickinson, USA). Signals from the cell debris were excluded based on the forward and side scattering. The level of fluorescence was calculated relative to the control cells incubated without the aptamer.
Flow cytometry of 2′-F-RNA aptamer FAM-ME07. The cells were suspended, divided into 500,000-cell portions, washed three times with the buffer, resuspended in 500 µl PBS containing required concentration of FAM-ME07, and incubated for 1 h at room temperature in the dark. Similar to the experiment with MJ18, control cells were stained with anti-EGFR H11 antibody for 1 h at 4°C, and then incubated with Cy2-conjugated anti-mouse AffiniPure secondary antibodies (dilution 1 : 200 in PBS) for 1 h at 20°C, washed three times with PBS, and analyzed with an AccuriC6 flow cytometer (BD Bioscience, USA). Fluorescence signal was recorded in the FL1 channel (488 nm, cut-off set at 10,000 events). The level of fluorescence was calculated relative to the control cells incubated without the aptamer.
Fluorescence microscopy. Fluorescent cells were screened with an inverted Eclipse Ti2-E microscope (Nikon, Japan) equipped with a wide-range motorized H139 stage (Prior Scientific, United Kingdom), autofocus system based on the infrared laser Perfect Focus System (Nikon), and an extensive dynamic range sCMOS-camera Neo 5.5 (Andor Technologies, Ireland) under control of the NIS-Elements ver. 5.11 software (Nikon) with the automated screening module JOBS. Fluorescence was excited with a 16-channel LED pE-4000 (CoolLED, United Kingdom). Cell culture plates were scanned with a PlanApo 10× (NA = 0.45) objective; scanning of multi-well glass slides (8-well µ-Slide, IBIDI, Germany) was carried out using a PlanApo 20× (NA = 0.75) objective.
Fluorescence microscopy experiments were performed with FAM-ME07 aptamer (λex = 490 nm; λem = 513nm).
The cells were screened in the automated mode; 8 fields of view were examined in each well of the 96-well plates and 36 fields of view – in the multi-well glass slides. The obtained results were analyzed with the ImageJ software. For the automated analysis, a series of scripts were developed that allowed automated counting of cells based on DNA fluorescence and measurement of integral FAM fluorescence after background subtraction. The results are presented as the integral fluorescence intensity in arbitrary units normalized to the number of cells in the field of view.
Staining of fixed cell cultures with FAM-ME07. The cells were seeded into 4-well plates (10,000 cells per well) with inserted coverslips and incubated for 2 days at 37°C. Next, the cells were fixed with 4% paraformaldehyde for 20 min at 4°C, washed 3 times for 5 min with phosphate buffer, and incubated with 100 nM FAM-ME07 in PBS containing 25 mM MgCl2 for 60 min at room temperature. The cells were then washed 3 times for 5 min in PBS, and cell nuclei were stained with bisbenzimide (Hoechst 33342, Sigma-Aldrich, dilution 1 : 500 in PBS). The cells were incubated in the polyvinyl alcohol-based Mowiol mounting medium (Sigma-Aldrich, Germany) for 8 h at 4°C and for 24 h at room temperature and then examined under an inverted Axiovert 200M microscope equipped with a digital camera (Carl Zeiss MicroImaging GmbH, Germany).
Simultaneous staining of cultured cells with anti-EGFR antibodies and FAM-ME07. Cells cultured in microplates or on multi-well slides (10,000 per well) were incubated with 500 nM FAM-ME07 in PBS containing 25 mM MgCl2 for 60 min at room temperature. Next, the cells were washed twice with 3 volumes of PBS (pH 7.2-7.4) and fixed with 200 µl of 4% paraformaldehyde in PBS for 30 min at 4°C. The cells were then washed three times with 3 volumes of PBS, incubated with anti-EGFR antibody H11 (dilution 1 : 100) for 1 h, washed with PBS three times for 5 min, and incubated with Cy2-labeled secondary antibodies (dilution, 1 : 100) for 60 min at room temperature. Cell nuclei were stained with Hoechst 33342 (dilution, 1 : 500 in PBS). The cells were fixed by incubating in the Mowiol mounting medium with 1% antioxidant DABCO (Sigma-Aldrich) for 8 h at 4°C and for 24 h at room temperature and then examined under an inverted Axiovert 200M microscope equipped with a digital camera (Carl Zeiss MicroImaging GmbH).
Staining of cell cultures with FAM-ME07. Cells cultured in microplates or on multi-well slides (10,000 cells per well) were incubated with FAM-ME07 for 1 h, washed twice with 3 volumes of PBS (pH 7.2-7.4), and fixed with 200 µl of 4% paraformaldehyde in PBS for 30 min at 4°C, followed by washing three times with 3 volumes of PBS. Cell nuclei were stained with Hoechst 33342 (dilution, 1 : 500 in PBS), and the cells were placed in Mowiol 4-88 mounting medium containing 1% DABCO.
Staining of non-fixed frozen human glioblastoma tissues with FAM-ME07. Samples of human glioblastoma tissue were obtained from patients during surgery. Tissue sections (5-µm thick) were produced with a cryotome from fragments of human glioblastoma tumors frozen in liquid nitrogen. The sections were washed for 5 min in PBS, dried, and incubated with 100 nM FAM-ME07 for 1 h at room temperature followed by washing twice for 5 min in PBS. Cell nuclei were stained with Hoechst 33342 (dilution, 1 : 500 in PBS) for 5 min at room temperature. The sections were washed for 5 min in PBS and placed in Mowiol 4-88 mounting medium for 8 h at 4°C and for 24 h at room temperature. The sections were examined under an inverted Axiovert 200M microscope equipped with a digital camera (Carl Zeiss MicroImaging GmbH).
RESULTS
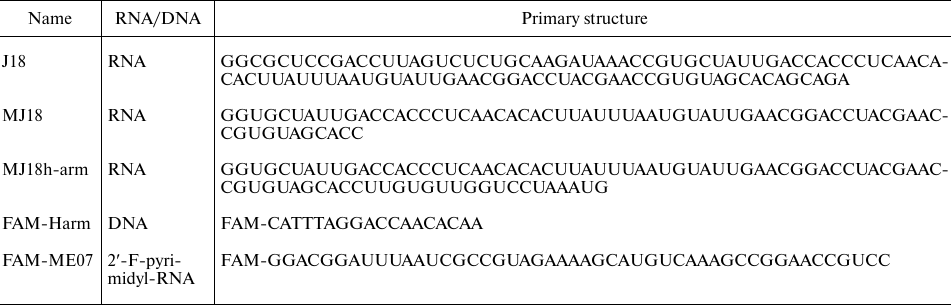
Predicted structures of anti-EGFR RNA aptamers. Possible secondary structures of RNA aptamers against EGFR (J18, MJ18, and 2′-F-modified E07 and ME07) are shown in Fig. 1. Such short (50-70 nt) structures could be studied experimentally.
Fig. 1. Predicted secondary structures of RNA aptamers against EGFR obtained by modeling with the RNAStructure algorithms [37] using the minimum free energy rules. The results of modeling are visualized with the RNApdbee software [38]. RNA aptamer J18 was shortened to 67 nt (MJ18).
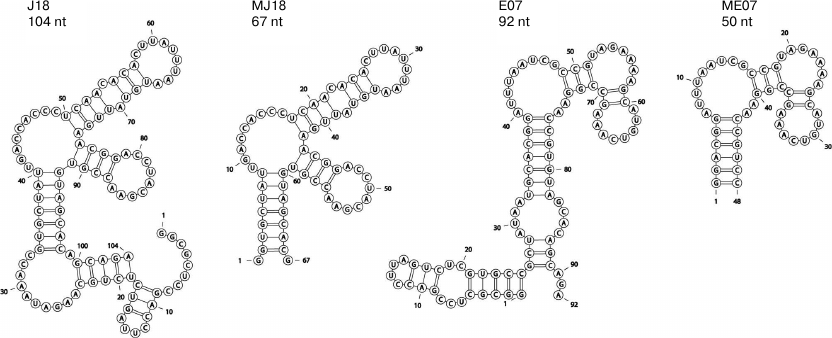
Flow cytometry of MJ18 and FAM-ME07 complexes with cells expressing EGFR on their surface. The presence of EGFR on the cell surface was confirmed using monoclonal H11 antibody labeled with the secondary Cy2-conjugated antibody. 2′-Fluoro-pyrimidine-ME07 (2′-F-Py-ME07) was synthesized by attaching fluorescein-based fluorophore 5(6)-carboxyfluorescein (FAM) to the 5′-end of ME07.
EGFR-overexpressing human epidermoid carcinoma A431 cells produced a strong fluorescence signal after incubation with fluorescently labeled H11 antibody (Fig. 2a), which was characterized by the shift of the right peak 2 along the abscissa axis relative to the peak of cell autofluorescence (1). Moreover, the amplitude of the shift was proportional to the fluorescence intensity, i.e., to the amount of labeled ligand bound to EGFR. The complex of MJ18 with the anchoring FAM-DNA duplex produced a slightly weaker signal (Fig. 2b). The signal for the negative control (oligonucleotide with the non-aptamer sequence) coincided with the autofluorescence signal from the original cells (left peak 2 in Fig. 2c; right peak 3 is ME07 signal).
Fig. 2. Flow cytometry of aptamer and antibody complexes with cancer cells. Cell autofluorescence is shown in grey (1). Upper row) A431 cells with (a) H11 antibody (green, 2), (b) anchoring FAM-DNA duplex (orange, 2) or MJ18h and anchoring FAM-DNA duplex (blue, 3), (c) anchoring FAM-DNA duplex (orange, 2) or FAM-ME07 (purple, 3). Middle row) titration of A431 cells with FAM-ME07: d) A431 cells with different concentrations of FAM-ME07 (1 – 0 nM, 2 – 100 nM, 3 – 250 nM, 4 – 500 nM, 5 – 1000 nM); e) intensity of cell fluorescence for different FAM-ME07 concentrations. Bottom row) FAM-ME07 binding to cells with different number of EGFR copies (2) on the cell surface: f) A431 cells, g) U87 cells, h) MCF7 cells.
The results of EGFR titration with FAM-ME07 on the surface of A431 cells confirmed the specificity of this aptamer toward the receptor. The shift along the abscissa axis increased with the increase in the aptamer concentration (Fig. 2, d and e), which allowed to estimate the apparent dissociation constant for the aptamer complex with the receptor on the cell surface as ~100 nM.
The data obtained for the typical cancer cell lines expressing different EGFR amounts on the surface provided even more evidence. Human epidermoid carcinoma A431 cells were used a positive control. This cell line overexpresses EGFR, with up to 3 × 10⁶ receptor molecules per cell [39] and normalized EGFR expression value NX = 346 (https://proteinatlas.org). Human glioblastoma U87 cells express hundred times less EGFR molecules (2 × 10⁴ molecules per individual cell) [40], with the normalized expression value NX = 2.6 (https://proteinatlas.org). Human luminal breast adenocarcinoma MCF7 cells express the minimal number of receptors (2 × 10³ molecules per cell) [41], with the normalized expression value NX = 0.2 (https://proteinatlas.org).
As seen in Fig. 2, the intensity of fluorescence signal decreased with the decrease in the number of receptors per cell and reached the value of cell autofluorescence in MCF7 cells.
Therefore, flow cytometry can be used for semiquantitative evaluation of the abundance of EFGR molecules on the cell surface.
Fluorescence microscopy can provide principally different information on the interaction of EGFR molecules on the cell surface with antibodies and aptamers.
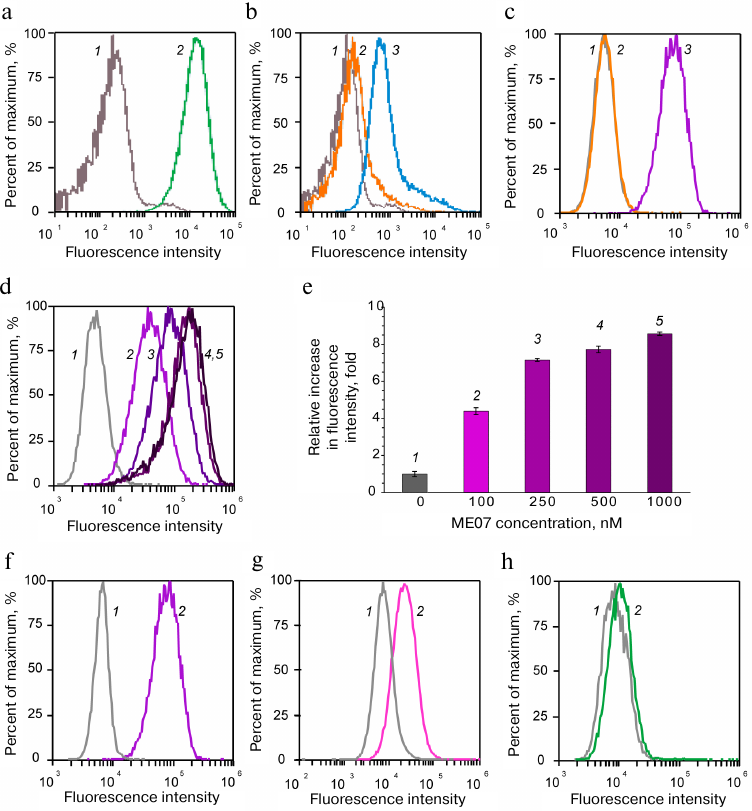
EGFR-overexpressing A431 cells were used as a positive control. The cells were treated simultaneously with the FAM-ME07 and Cy2-labeled H11 monoclonal antibody. Figure 3a shows the image of A431 cells stained with antibody H11 (red) and FAM-ME07 (green) (blue staining, nuclei). Other panels in Fig. 3 show more detailed images of a group of four A431 cells stained with the H11 antibody (b), FAM-ME07 (c), and Hoechst 33342 (d). The merged image is shown in Fig. 3e, with orange color indicating colocalization of FAM-ME07 (green) and H11 antibody (red).
Fig. 3. Fluorescence microscopy of A431 cells: a) whole field of view. Cells are stained with (b) Cy2-labeled H11 antibody (red), (c) FAM-ME07 (green), and (d) Hoechst 33342 (nuclei, blue); e) merged images (b), (c), and (d) (orange color produced by the overlay of red and green).
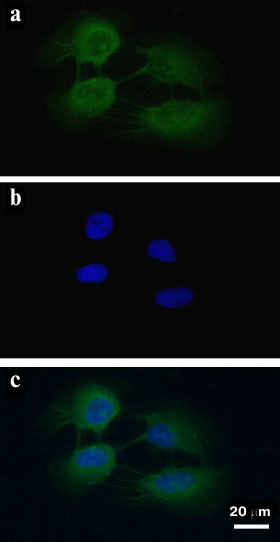
Similar to the H11 antibody, FAM-ME07 localized to the membrane of A431 cells. No competition between the H11 antibody and FAM-ME07 aptamers was observed. Unlike the H11 antibody, FAM-ME07 penetrated into the cell cytoplasm and nucleolus.
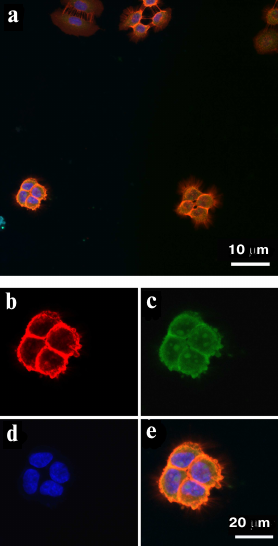
To examine localization of FAM-ME07 in A431 cells in more detail, the cells were stained with FAM-ME07 (without the H11 antibody). The fluorescence of FAM-ME07 could be clearly seen in the cell cytoplasm and nucleolus (Fig. 4).
Fig. 4. Fluorescence microscopy of A432 cells (frozen sample) stained with: a) FAM-ME07 (green); b) Hoechst 33342 (blue); c) merged images (a) and (b).
Very indicative data were obtained by comparison of the FAM-ME07 interaction with cells expressing different amounts of EGFR on the surface. The images of A431 cells (positive control), primary ROZH cells derived from a human GBM surgically removed from a patient, and human fibroblasts stained with FAM-ME07 are presented in Fig. 5.
Fig. 5. Fluorescence microscopy of cells with different levels of EGFR expression (frozen samples) stained with FAM-ME07 (green); nuclei are stained with Hoechst 33342 (blue): a) A431 cells, b) primary culture of human glioblastoma ROZH cells; c) human fibroblasts.
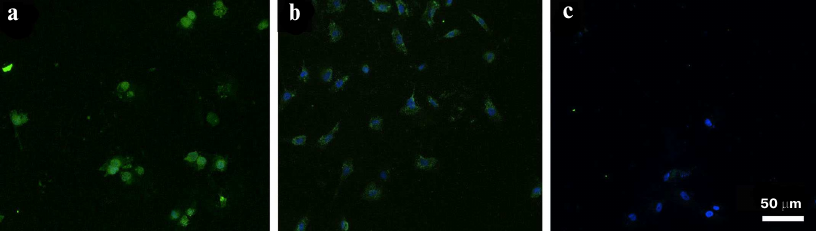
In order to visualize a small number of receptors on the cell surface, the concentration of FAM-ME07 was increased ten times (to 1 µM). At this aptamer concentration, the staining of A431 cells was very intense. ROZH cells were stained to a lesser degree, and FAM-ME07 localized predominantly to the cytoplasm. Despite the high FAM-ME07 concentration, fibroblasts were virtually unstained.
These results were typical only for the frozen cells. Fixation of A431 cells with formaldehyde resulted in an uncharacteristic staining (Fig. 6).
Fig. 6. Fluorescence microscopy of paraformaldehyde-fixed A431 cells stained with (a) FAM-ME07 and (b) Hoechst 33342; c) merged images (a) and (b).
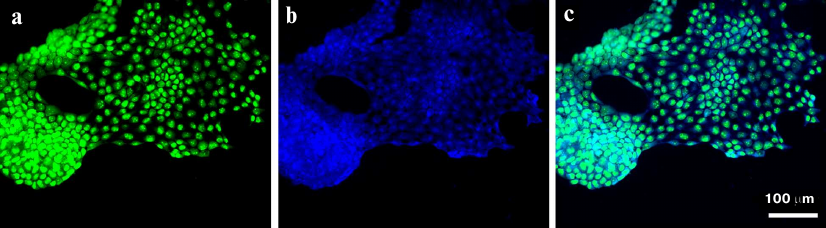
The results of semiquantitative analysis of the presence of EGFR on the cell surface demonstrated the possibility of aptamer application for visualization of EFGR-positive cells in tumor tissues derived from GBM patients. Tissue sections of GBM tumor derived from a biopsy of surgically removed tumor and stained with FAM-ME07 are shown in Fig. 7. EFGR-positive cells represented a significant fraction of the heterogenous tumor and were brightly stained with FAM-ME07.
Fig. 7. Fluorescence microscopy of non-fixed human glioblastoma tissue (patient 76, frozen sample) stained with (a) FAM-ME07 (green) and (b) Hoechst 33342 (blue); c) merged images (a) and (b).
DISCUSSION
The pioneer studies on the generation of RNA aptamers for EGFR and on their properties have been performed by the Ellington group. First, the 104-nt RNA aptamer J18 for the receptor extracellular domain with the apparent dissociation constant of ~7 nM was selected [13, 14]. Next, nuclease-stable 2′-F-pyrimidine-modified RNA aptamers (92-nt aptamer E07 and its minimized 48-nt variant ME07) for chimeric protein – EGRF extracellular domain fused with immunoglobulin constant region, were selected [17, 19-22, 26, 27]. However, even secondary structures of these aptamers have not been studied.
Here, we analyzed possible secondary structures of both original and 2′-F-modified RNA aptamers selected by the Ellington group. A putative secondary structure of ME07 predicted by us (Fig. 1) was different from the one suggested by the authors, it allowed formation of coaxial stacking interactions. Despite the difference in the predicted structures, the short variants of RNA aptamers (MJ18) and 2′-F-pyrimidine RNA derivatives (ME07) strongly interacted with EGFR on the cell surface (see below).
By analogy with the terms ‘epitope’ and ‘paratope’, commonly used for the antigenic determinant and recognition site in the antibody, respectively, we suggest the corresponding terms ‘epiapt’ and ‘paraapt’ for the aptamers. Small sizes of RNA aptamers and possibility of comparison of their structures can facilitate searching for paraapts in the aptamers.
To apply these aptamers into theranostics, firstly, it is required to check whether the aptamers detect EGFR on the surface of tumor cells and within tissue samples. Selection of aptamers for EGFR was made using isolated recombinant proteins. A state of EGFR in the cell membrane or in the tissue (including its conformation and microenvironment) could be different, which could result in different affinity and specificity of the aptamers. Other factors could also influence interpretation of results; thus, a standard technique of cell sample preparation from cell cultures or tissues involves trypsinization, which could effect EGFR. And, finally, a degree of tumor clonal heterogeneity could affect a detection of EGFR-positive cells within tissues as well.
Typically, aptamers are selected from RNA libraries because it is believed (and quite justifiably) that RNA molecules have more complex spatial structures compared to DNA due to the presence of 2′-hydroxyl group. Indeed, the first aptamer against EGFR (J18) was 104-mer of RNA. We made a shortened variant of J18 (MJ18) having 67 nt that retained the high affinity to the tumor cells (Figs. 1 and 2).
However, the high susceptibility of RNA to nucleases hydrolysis has forced researchers to switch to 2′-F-derivatives of RNA. 2-F-pyrimidines (2′-F-Py) are used to block the activity of pancreatic nucleases. Fluoro derivatives of RNA not only lack the 2′-hydroxyl group with its donor/acceptor properties, but it has a highly hydrophobic substituent, F. This circumstance escapes from researcher’s attention. Although the double-stranded F-modified RNAs retain A-form conformation, the increased hydrophobicity of the sugar-phosphate backbone results in a poorly predictable thermal stability and, in some cases, higher affinity to proteins [42-44].
This could be the reason why some 2′-F-Py-RNA aptamers used for the EGFR detection on the cell surface exhibit an increased non-specific binding [45], which requires a more thorough investigation of specificity of 2′-F-Py-RNA aptamers being translated into theranostics application. Some reported aptamers have not been tested with the cells, which is also a common case for monoclonal antibodies. It is essential to use at least two negative controls, like oligonucleotide with the non-aptamer sequence and cells with the minimal expression of EFGR on the surface.
Flow cytometry. The number of EFGR molecules on the surface of tumor cells was evaluated by flow cytometry using commercially available monoclonal antibody H11 developed for a linear epitope in the receptor extracellular domain (mainly in domain 3, amino acids 294-543) [46]. This antibody was labeled with the Cy2-conjugated secondary antibody. The 2′-F-Py-RNA-based aptamer ME07 was labeled with fluorescein amidite (FAM) at the 5′-end during the synthesis.
As seen in Fig. 2a, EGFR-overexpressing A431 cells provies a strong signal with the H11 antibody, which was exhibited by the peak shift along the abscissa axis (right peak 2) relatively to the peak of cell autofluorescence (left peak 1). Fluorescently labeled aptamer 5′-FAM-ME07 also produced a strong signal (Fig. 2c, right peak 3); at the same time, the signal from the negative control (FAM-labeled oligonucleotide with the non-aptamer sequence) is the same as the signal from the original cells (Fig. 2c, left peak 2). These results are in a vein with the previously reported data [25].
For the first time in this study the following experiments were performed, despite their obvious importance.
Titration of EGFR with FAM-ME07 on the surface of A431 cells verified a specificity of aptamer interactions with the receptor. The shift of the peak along the abscissa axis increased with the increase of the aptamer concentration (Fig. 2, d and e). As this shift was specific, it enabled to estimate aKD for the FAM-ME07 interactions with EGFR within A431 cells. The affinity of the aptamer to the receptor within the cells was at least 100-fold lower than for the free receptor: ~100 nM vs. 1 nM, respectively. Similar situation has been reported previously; in particular, for the E series aptamers that inhibited the protein kinase activity of EGFR at a concentration of ~300 nM [17].
Even more demonstrative data were obtained for tumor cell lines expressing different amounts of EGFR molecules on the surface. A431, which normally over-expressing EGRF on the cell surface, was used as a positive control. This cell line over-expresses EGFR (up to 3 × 10⁶ receptor molecules per cell) [39], with the normalized EGFR expression value NX = 346 (https://proteinatlas.org). U87 cells expressed hundred times less EGFR molecules (2 × 10⁴ molecules per cell) [40], with NX = 2.6. Human MCF7 cells had the minimal number of receptors (2 × 10³ molecules per individual cell) [41], with NX = 0.2.
The fluorescence signal shifted towards the cell autofluorescence signal while decreasing the number of receptor molecules per cell (Fig. 2). Moreover, the fluorescence signal for the MCF7 cells virtually the same as the cell autofluorescence signal, which indicated possible detection limit for the evaluation of the number of receptors using fluorescein. Fluorescein is not the brightest fluorophore that can be applied for labeling of oligonucleotides; for example, phycoerythrin provides ten times higher sensitivity of detection [17].
Nevertheless, FAM-labeled ME07 aptamer could be used for the semi-quantitative determination of the number of receptor copies on the cell surface using flow cytometry.
Fluorescence microscopy. Fundamentally different information on the interactions of both antibody and aptamers with EGFR on the cells could be gained by fluorescence microscopy. A431 cells, which over-expressed EGFR, were positive control, as described above. The cells were treated simultaneously with FAM-ME07 and monoclonal antibody H11, then H11 were stained with secondary antibody conjugated with Cy2. As seen in Fig. 3, FAM-ME07 can serve as an alternative to the anti-EGFR antibody. Firstly, FAM-ME07 is located on the membrane of A431 cells, similar to the H11 antibody. But, unlike the complex of antibody with the receptor, the aptamer-receptor complex is able to penetrate inside the cell. The known potential of the EGFR-ligand complex to endocytosis propounds that internalization occurs via the receptor-mediated mechanism. Secondly, the lack of the noticeable competition between the H11 antibody and FAM-ME07 assumes that EGFR epitopes for the antibody are different from epiapts for the aptamer. And, finally, after 30-min incubation at room temperature, FAM-ME07 was observed not only in cytoplasm, but also in the nucleoli.
To verify this unusual localization of FAM-ME07 in A431 cells, we performed the same experiment using FAM-aptamer only, with no H11. Bright emission of the FAM-ME07 both in the cytoplasm and the nucleoli can be clearly seen in Fig. 4. These unique characteristics of FAM-ME07 suggest that it could be used as an escort aptamer for specific EGFR-mediated delivery of various agents into the cells.
Similar to the flow cytometry experiments, the data obtained by the comparison of various types of tumor cells and fibroblasts, with different amounts of EGFR on the cell surface, are very indicative. The images of cells stained with FAM-ME07 are presented in Fig. 5, showing A431 cells (positive control), primary culture of ROZH cells derived from a surgical biopsy from a GBM patient, and human fibroblasts. To enhance an ability to detect low numbers of receptor molecules on the cell surface, the concentration of FAM-ME07 was increased 10-fold, up to 1 µM. It is not surprising that the A431 cells were stained so intensely, that the staining of the nuclei was masked. ROZH cells were stained to a lesser degree, and the aptamer localized predominately to the cytoplasm. Fibroblast were virtually not stained, despite high FAM-ME07 concentrations.
Hence, it is clear that both in the case of flow cytometry and fluorescence microscopy, the signal decreased with the decreasing of number of receptor molecules on the cell surface. Therefore, FAM-ME07 can be used for the aptacytochemistry of EGFR. Moreover, ME07 could be used as an escort aptamer for the delivery of reagent into human GBM cells.
These results opened a way of developing aptamers for aptahistochemistry in order to visualize EFGR-positive cells in tumor tissues derived from GBM patients. The images of FAM-ME07-stained GBM sections derived from a surgical samples of tumor (Burdenko National Medical Research Center of Neurosurgery) are presented in Fig. 7. The tumor is heterogenous, and EFGR-positive cells, being a significant portion of the tumore, are brightly stained with FAM-ME07.
Hence, the first step in the diagnostic of human GBM translating into aptatheranostics – visualization of EFGR-positive clones – has been a fortunate one. For further improvement, a sensitivity of detection should be enhanced by using other fluorophores. More efficient aptamers and versatile methods for aptamer labeling should be developed also, as well as new methods for the introduction of various agents for both diagnostics (e.g., PET) and targeted therapy against EGFR-positive clones.
Further advances in aptatheranostics of EGFR-positive cells will allow targeted eradication of aggressive clones from heterogenous GBM tumors.
Acknowledgments. The authors are grateful to A. A. Bisyaeva, S. F. Drozd, and M. V. Ryzhova for permanent help during this work.
Funding. This work was supported by the Ministry of Education and Science of the Russian Federation [project no. 075-15-2020-809 (13.1902.21.0030)] and by the Russian Foundation for Basic Research (project no. 18-29-01047 mk).
Ethics declarations. The authors declare no conflict of interest in financial or in any other area. All procedures used in the studies involving human participants were in accordance with the ethical standards of the institutional and/or national research committee and with the 1964 Helsinki declaration and its later amendments or comparable ethical standards. Written consent was obtained from all participants in the study.
REFERENCES
1.Kopylov, A. M., Zavyalova, E. G., Pavlova, G. V.,
and Pronin, I. N. (2020) Theranostics of glioblastoma with monoclonal
antibodies to epidermal growth factor receptor, Zhurn. Voprosy
Neirokhirurgii im. Burdenko, 84, 113-118, doi:
10.17116/neiro202084031113.
2.Spirin, A. S. (2019) Molecular biology.
Ribosomes and Protein Synthesis, Laboratoriya Znanii, Moscow.
3.Ellington, A. D., and Szostak, J. W. (1990) In
vitro selection of RNA molecules that bind specific ligands,
Nature, 346, 818-822, doi: 10.1038/346818a0.
4.Tuerk, C., and Gold, L. (1990) Systematic evolution
of ligands by exponential enrichment: RNA ligands to bacteriophage T4
DNA polymerase, Science, 249, 505-510, doi:
10.1126/science.2200121.
5.Robertson, D. L., and Joyce, G. F. (1990) Selection
in vitro of an RNA enzyme that specifically cleaves
single-stranded DNA, Nature, 344, 467-468, doi:
10.1038/344467a0.
6.Antipova, O. M., Zavyalova, E. G., Golovin, A. V.,
Pavlova, G. V., Kopylov, A. M., and Reshetnikov, R. V. (2018) Advances
in the application of modified nucleotides in SELEX technology,
Biochemistry (Moscow), 10, 1161-1172, doi:
10.1134/S0006297918100024.
7.Metelev, V. G., and Oretskaya, T. S. (2021)
Modified oligonucleotides: new structures, new properties, and new
spheres of application, Russ. J. Bioorg. Chem., 47,
339-343, doi: 10.1134/S1068162021020175.
8.Mendelsohn, J. (2004) EGF receptors as a target for
cancer therapy, Trans. Am. Clin. Climatol. Assoc., 115,
249-253.
9.Carpenter, G. (1983) The biochemistry and
physiology of the receptor-kinase for epidermal growth factor, Mol.
Cell. Endocrinol., 31, 1-19, doi:
10.1016/0303-7207(83)90027-8.
10.Carpenter, G. (1984) Properties of the receptor
for epidermal growth factor, Cell, 37, 357-358, doi:
10.1016/0092-8674(84)90365-9.
11.Carpenter, G., and Cohen, S. (1979) Epidermal
growth factor, Annu. Rev. Biochem., 48, 193-216, doi:
10.1146/annurev.bi.48.070179.001205.
12.Wikstrand, C. J., McLendon, R. E., Friedman, A.
H., and Bigner, D. D. (1997) Cell surface localization and density of
the tumor-associated variant of the epidermal growth factor receptor,
EGFRvIII, Cancer Res., 57, 4130-4140.
13.Wan, Y., Kim, Y. T., Li, N., Cho, S. K., Bachoo,
R., et al. (2010) Surface-immobilized aptamers for cancer cell
isolation and microscopic cytology, Cancer Res., 70,
9371-9380, doi: 10.1158/0008-5472.CAN-10-0568.
14.Li, N., Larson, T., Nguyen, H. H., Sokolov, K.
V., and Ellington, A. D. (2010) Directed evolution of gold nanoparticle
delivery to cells, Chem. Commun. (Camb)., 46, 392-394,
doi: 10.1039/b920865h.
15.Goldstein, N. I., Prewett, M., Zuklys, K.,
Rockwell, P., and Mendelsohn, J. (1995) Biological efficacy of a
chimeric antibody to the epidermal growth factor receptor in a human
tumor xenograft model, Clin. Cancer Res., 1,
1311-1318.
16.Groner, B., Hartmann, C., and Wels, W. (2004)
Therapeutic antibodies, Curr. Mol. Med., 4, 539-547, doi:
10.2174/1566524043360483.
17.Li, N., Nguyen, H. H., Byrom, M., and Ellington,
A. D. (2011) Inhibition of cell proliferation by an anti-EGFR aptamer,
PLoS One, 6, e20299, doi:
10.1371/journal.pone.0020299.
18.Li, N., Wang, Y., Pothukuchy, A., Syrett, A.,
Husain, N., et al. (2008) Aptamers that recognize drug-resistant HIV-1
reverse transcriptase, Nucleic Acids Res., 36, 6739-6751,
doi: 10.1093/nar/gkn775.
19.Wan, Y., Tamuly, D., Allen, P. B., Kim, Y. T.,
Bachoo, R., et al. (2013) Proliferation and migration of tumor cells in
tapered channels, Biomed. Microdevices, 15, 635-643, doi:
10.1007/s10544-012-9721-0.
20.Ilyas, A., Asghar, W., Allen, P. B., Duhon, H.,
Ellington, A. D., and Iqbal, S. M. (2012) Electrical detection of
cancer biomarker using aptamers with nanogap break-junctions,
Nanotechnology, 23, 275502, doi:
10.1088/0957-4484/23/27/275502.
21.Wan, Y., Liu, Y., Allen, P. B., Asghar, W.,
Mahmood, M. A., et al. (2012) Capture, isolation and release of cancer
cells with aptamer-functionalized glass bead array, Lab. Chip,
12, 4693-4701, doi: 10.1039/c2lc21251j.
22.Wan, Y., Mahmood, M. A., Li, N., Allen, P. B.,
Kim, Y. T., et al. (2012) Nanotextured substrates with immobilized
aptamers for cancer cell isolation and cytology, Cancer,
118, 1145-1154, doi: 10.1002/cncr.26349.
23.Avutu, V. (2010) Avidity Effects of MinE07, an
Anti-EGFR Aptamer, on Binding to A431 Cells, Texas Scholar Works
University of Texas at Austin.
24.Kim, H. J., Park, J. Y., Lee, T. S., Song, I. H.,
Cho, Y. L., et al. (2019) PET imaging of HER2 expression with an
18F-fluoride labeled aptamer, PLoS One, 14, e0211047,
doi: 10.1371/journal.pone.0211047.
25.Cheng, S., Jacobson, O., Zhu, G., Chen, Z.,
Liang, S. H., et al. (2019) PET imaging of EGFR expression using an
18F-labeled RNA aptamer, Eur. J. Nucl. Med. Mol. Imaging,
46, 948-956, doi: 10.1007/s00259-018-4105-1. Erratum in: Eur.
J. Nucl. Med. Mol. Imaging, (2018) 45, 2245.
26.Melancon, M. P., Zhou, M., Zhang, R., Xiong, C.,
Allen, P., et al. (2014) Selective uptake and imaging of aptamer- and
antibody-conjugated hollow nanospheres targeted to epidermal growth
factor receptors overexpressed in head and neck cancer, ACS
Nano, 8, 4530-4538, doi: 10.1021/nn406632u.
27.Ray, P., Cheek, M. A., Sharaf, M. L., Li, N.,
Ellington, A. D., et al. (2012) Aptamer-mediated delivery of
chemotherapy to pancreatic cancer cells, Nucleic Acid Ther.,
22, 295-305, doi: 10.1089/nat.2012.0353.
28.Wang, Y. L., Chang, L. C., Chen, K. B., and Wang,
S. C. (2021) Aptamer-guided targeting of the intracellular
long-noncoding RNA HOTAIR, Am. J. Cancer Res., 11,
945-954.
29.Opazo, F., Levy, M., Byrom, M., Schäfer, C.,
Geisler, C., et al. (2012) Aptamers as potential tools for
super-resolution microscopy, Nat. Methods, 9, 938-939,
doi: 10.1038/nmeth.2179.
30.Strauss, S., Nickels, P. C., Strauss, M. T.,
Jimenez Sabinina, V., Ellenberg, J., et al. (2018) Modified aptamers
enable quantitative sub-10-nm cellular DNA-PAINT imaging, Nat.
Methods, 15, 685-688, doi: 10.1038/s41592-018-0105-0.
31.Delcanale, P., Porciani, D., Pujals, S.,
Jurkevich, A., Chetrusca, A., et al. (2020) Aptamers with tunable
affinity enable single-molecule tracking and localization of membrane
receptors on living cancer cells, Angew. Chem. Int. Ed. Engl.,
59, 18546-18555, doi: 10.1002/anie.202004764.
32.Esposito, C. L., Passaro, D., Longobardo, I.,
Condorelli, G., Marotta, P., et al. (2011) A neutralizing RNA aptamer
against EGFR causes selective apoptotic cell death, PLoS One,
6, e24071, doi: 10.1371/journal.pone.0024071.
33.Passariello, M., Camorani, S., Vetrei, C., Ricci,
S., Cerchia, L., and De Lorenzo, C. (2020) Ipilimumab and its derived
EGFR aptamer-based conjugate induce efficient NK cell activation
against cancer cells, Cancers (Basel), 12, 331, doi:
10.3390/cancers12020331.
34.Peng, L., Liang, Y., Zhong, X., Liang, Z., Tian,
Y., et al. (2020) Aptamer-conjugated gold nanoparticles targeting
epidermal growth factor receptor variant III for the Treatment of
glioblastoma, Int. J. Nanomedicine, 15, 1363-1372, doi:
10.2147/IJN.S238206.
35.Zavyalova, E., Turashev, A., Novoseltseva, A.,
Legatova, V., Antipova, O., et al. (2020) Pyrene-modified DNA aptamers
with high affinity to wild-type EGFR and EGFRvIII, Nucleic Acid
Ther., 30, 175-187, doi: 10.1089/nat.2019.0830.
36.Wang, T., Philippovich, S., Mao, J., and Veedu,
R. N. (2019) Efficient epidermal growth factor receptor targeting
oligonucleotide as a potential molecule for targeted cancer therapy,
Int. J. Mol. Sci., 20, 4700, doi:
10.3390/ijms20194700.
37.Reuter, J. S., and Mathews, D. H. (2010) RNA
structure: software for RNA secondary structure prediction and
analysis, BMC Bioinformatics, 11, 129, doi:
10.1186/1471-2105-11-129.
38.Zok, T., Antczak, M., Zurkowski, M., Popenda, M.,
Blazewicz, J., et al. (2018) RNApdbee 2.0: multifunctional tool for RNA
structure annotation, Nucleic Acids Res., 46, W30-W35,
doi: 10.1093/nar/gky314.
39.Haigler, H., Ash, J. F., Singer, S. J., and
Cohen, S. (1978) Visualization by fluorescence of the binding and
internalization of epidermal growth factor in human carcinoma cells
A-431, Proc. Natl. Acad. Sci. USA, 75, 3317-3321, doi:
10.1073/pnas.75.7.3317.
40.Obaid, G., Samkoe, K., Tichauer, K., Bano, S.,
Park, Y., et al. (2021) Is tumor cell specificity distinct from tumor
selectivity in vivo? A quantitative NIR molecular imaging
analysis of nanoliposome targeting, Nano Res., 14,
1344-1354, doi: 10.1007/s12274-020-3178-x.
41.Davidson, N. E., Gelmann, E. P., Lippman, M. E.,
and Dickson, R. B. (1987) Epidermal growth factor receptor gene
expression in estrogen receptor-positive and negative human breast
cancer cell lines, Mol. Endocrinol., 1, 216-223, doi:
10.1210/mend-1-3-216.
42.Pallan, P. S., Greene, E. M., Jicman, P. A.,
Pandey, R. K., Manoharan, M., et al. (2011) Unexpected origins of the
enhanced pairing affinity of 2′-fluoro-modified RNA, Nucleic
Acids Res., 39, 3482-3495, doi: 10.1093/nar/gkq1270.
43.Murray, J. B., Dunham, C. M., and Scott, W. G.
(2002) A pH-dependent conformational change, rather than the chemical
step, appears to be rate-limiting in the hammerhead ribozyme cleavage
reaction, J. Mol. Biol., 315, 121-130, doi:
10.1006/jmbi.2001.5145.
44.Piao, X., Wang, H., Binzel, D. W., and Guo, P.
(2018) Assessment and comparison of thermal stability of
phosphorothioate-DNA, DNA, RNA, 2′-F RNA, and LNA in the context
of Phi29 pRNA 3WJ, RNA, 24, 67-76, doi:
10.1261/rna.063057.117.
45.Li, N., Ebright, J. N., Stovall, G. M., Chen, X.,
Nguyen, H. H., et al. (2009) Technical and biological issues relevant
to cell typing with aptamers, J. Proteome Res., 8,
2438-2448, doi: 10.1021/pr801048z.
46.Cochran, J. R., Kim, Y. S., Olsen, M. J.,
Bhandari, R., and Wittrup, K. D. (2004) Domain-level antibody epitope
mapping through yeast surface display of epidermal growth factor
receptor fragments, J. Immunol. Methods, 287, 147-158,
doi: 10.1016/j.jim.2004.01.024.