Coevolution of Brain, Culture, and Lifespan: Insights from Computer Simulations
Alexander V. Markov1,2,a* and Mikhail A. Markov1,b
1Lomonosov Moscow State University, 119991 Moscow, Russia2Paleontological Institute of the Russian Academy of Sciences, 117997 Moscow, Russia
* To whom correspondence should be addressed.
Received October 22, 2021; Revised November 4, 2021; Accepted November 4, 2021
Humans possess a number of traits that are rare or absent in other primates, including large brain size, culture, language, extended lifespan (LS), and long post-reproductive period. Here, we use a computer model, TribeSim, originally designed to explore the autocatalytic coevolution of the hominin brain and culture within the framework of the “cultural drive” theory, to find out how culture and brain could coevolve with LS (or aging rate). We show that in the absence of culture, the evolution of LS depends on the intensity of the between-group competition (BGC): strong BGC results in shorter LS. Culture, however, favors genetic evolution of longer LS even if the BGC is strong. Extended LS, in turn, enhances cultural development, thus creating positive feedback. Cultural evolution of LS (accumulation of survival-enhancing or survival-impairing knowledge) differs from the genetic evolution of the same trait, partially because “memes” (ideas, skills, and behaviors) that reduce the risk of death tend to spread in the meme pool even if it is not beneficial to genes. Consequently, cultural evolution of aging tends to result in longer LS than genetic evolution of the same trait. If LS evolves both genetically and culturally, the typical result is a society in which young individuals, due to their genetic predisposition, lead a riskier lifestyle in exchange for a chance to gain additional resources, but accumulate survival-enhancing knowledge with age. Simulations also showed that cultural evolution of adaptive behaviors can contribute to the genetic evolution of a long post-reproductive period, e.g., if the presence of knowledgeable long-livers increases the competitiveness of the group.
KEY WORDS: evolution of lifespan, aging, post-reproductive period, gene-culture coevolution, cultural drive, runaway brain-culture coevolutionDOI: 10.1134/S0006297921120014
Abbreviations: AR, aging rate; BGC, between-group competition; G, maximum group size; HE, hunting efficiency (group-beneficial behavioral trait); LE, learning efficiency; LS, lifespan; MC, memory capacity; TrE, Machiavellian trick efficiency (individually beneficial behavioral trait).
INTRODUCTION
Humans differ from other primates in many important ways, including large brain size, cumulative culture enabled by language or, speaking more broadly, by enhanced means of social learning [1-3], extended LS [4, 5] which probably stems from the “neotenic” retardation of aging [6, 7], and long post-reproductive period which is especially pronounced in women [8]. How and why have these traits co-evolved in the course of anthropogenesis is a matter of debate [9-13]. Here, we used computer modeling to explore the possible patterns of evolutionary interplay between culture, social learning, brain size, and LS in a social species with high group cohesion, cooperative resource acquisition, pair bonding, high parental investment in offspring, and basic abilities for the cultural transmission of adaptive behaviors. All these traits were probably present in the Pleistocene Homo species and their direct ancestors [14-16].
Brain volume has increased threefold during the last two million years of Homo evolution, despite apparently high costs [17-22]. This evolutionary pattern of rapid brain expansion appears to be quantitatively unique among primates [23]. These facts imply that selection for brain expansion in the course of human evolution has probably been driven by a strong positive feedback, rather than by simple ecological factors like climate or availability of different food resources (see [13] for a more detailed discussion). In the current study, we have built upon one of the most well-supported theories proposed to explain an extraordinarily rapid brain expansion in Homo: “Cultural drive” or “cultural brain” theory suggesting that the co-evolution of brain, social learning, and culture can be self‐sustaining or autocatalytic [1, 12]. In its simplest form, the positive feedback mechanism of the cultural drive can be described as following: better social learning and cognition → more behavioral innovations become fixed as cultural traditions; richer culture → more useful skills available to be learned from conspecifics; increased usefulness of social learning abilities → stronger selection for still better social learning and cognition; brain expansion occurs as a side effect of this selection [11-13, 24-27].
An additional positive feedback loop via longer LS (or slower aging) is conceivable in this context [1, 11, 13, 28]. LS (or aging rate, AR), can evolve both genetically and culturally. In the first case, elaborate culture is expected to facilitate selection for slower aging because longer lived individuals have more time to learn from their group mates and to teach the others (or to serve as models for imitation). In other words, longer lived individuals benefit more from culture and, at the same time, they are better at accumulating and disseminating knowledge. Therefore, genetic evolution of longer LS is expected to facilitate cultural development, which, in turn, may promote selection for the LS extension. In the second case (cultural evolution of LS), the following feedback loop is conceivable: elaborate culture → enhanced survival → longer LS → better prerequisites for intergenerational transfer of knowledge → still more elaborate culture → still better survival and stronger selection for enhanced social learning [12, 29, 30]. There are reasons to believe that human LS has increased (and AR decreased) in the course of human evolution, and that it was due both to genetic changes and cultural development [4, 6-7].
This hypothetical positive feedback mechanism in the evolution of the brain, social learning, and LS is in concordance with the fact that there are significant positive associations between longevity, brain volume (both absolute and relative), social learning proclivity, and technical innovation in primates [31-33] and cetaceans [34]. Although much attention is currently being paid to human life history research in general [35, 36], the patterns and implications of a possible co-evolutionary interplay between LS and evolving brain, social learning, and culture are poorly understood.
To explore these patterns, we used a computer model, TribeSim, which was originally designed to simulate the dynamics of the brain‐culture coevolution in a highly social species. The detailed description of the model and its comparison with the remotely similar “Cultural Brain” model [12] has been published previously [13]. Simulations confirmed the plausibility of the cultural drive in a social species in a socio‐ecological situation that makes the sporadic invention of new beneficial and cognitively demanding behaviors possible. The cultural drive is more likely to be initiated if some of the culturally transmitted behaviors are individually beneficial while the others are group‐beneficial. In this case, cultural drive is possible under varying levels of the between-group competition (BGC) and migration. Modeling also implies that brain expansion can receive additional boost if the evolving mechanisms of social learning are costly in terms of brain expansion (e.g., rely on complex neuronal circuits) and tolerant to the complexity of information transferred, that is, make it possible to transfer complex skills and concepts easily. Human language presumably fits this description. Modeling also confirmed that extended LS can accelerate the runaway brain‐culture coevolution [13]. This is consistent with the idea that a positive feedback loop via LS extension may further enhance cultural development and brain expansion. However, these simulations have not shown if, and under what circumstances, cultural evolution can contribute to the evolution of longer (or shorter) LS. Here, we used a modified version of TribeSim to explore the evolution of LS and aging (here defined as age-dependent increase in mortality rate) in the context of the runaway brain-culture co-evolution.
TribeSim: DESCRIPTION OF THE MODEL
The detailed description of TribeSim has been published previously [13], so here we restrict ourselves to a brief outline of its main principles.
TribeSim is an individual‐based model designed to simulate genetic and cultural evolution in a population of a highly social species. Population consists of competing social groups. The maximum possible group size is specified by the parameter G; after reaching this limit, the group splits in two halves. Group members engage in cooperative effort to acquire resources from the environment in competition with other groups. We dubbed it “collective hunting” [37], although other cooperative, group-beneficial behaviors can also be considered in this context. The resources acquired by the group are then distributed among the group members. Individuals compete with each other to increase their share. Thus, there are two levels of resource competition: between groups and between individuals, similar to the “nested tug‐of‐war” model which was previously used to explore the effects of BGC on the evolution of within‐group cooperation [38]. The outcome of competition depends on two behavioral traits that can evolve genetically and (or) culturally: “Hunting efficiency” (HE) and “Machiavellian trick efficiency” (TrE) [39, 40]. Both traits depend on culturally transmitted skills (memes), which can be invented from scratch (with a fixed low probability) or acquired from group mates via social learning. All individuals are born with genetically determined starting values of HE and TrE (10 and 0, respectively) and no memes in memory.
Higher values of HE benefit the group (HE is a “cooperative trait”), because the amount of resources acquired by the group is proportional to the sum of individual HEs of all group members who go hunting (“hunting effort” of the group). The higher the hunting effort of a group, the less is the share of other groups. This results in the intergroup competition, which presumably was quite strong in the Pleistocene hominins [11]. Within groups, the resources are distributed according to the individual values of TrE. TrE is a “selfish trait”: high TrE benefits an individual but not the group.
Here, we introduce another phenotypic character, AR (aging rate), which can evolve genetically and/or culturally, and a new category of memes (AR memes). AR memes affect the age-dependent risk of death and can either enhance or impair survival. Although AR has no direct impact on the outcome of resource competition, it can affect it indirectly (see below).
In TribeSim, selection acts at three levels.
1) Group selection. BGC for resources and selective survival, growth and splitting of the groups result in group selection which favors the development of cooperative traits [41, 42]. We can regulate the intensity of group selection by modifying parameter G. For instance, when G = 15, there are many small competing groups, BGC is very intense, and group selection is strong. When G is higher than the maximum possible population size (e.g., G = 2000), then all population is a single group, and there is no group selection.
2) Individual selection. Within‐group resource competition results in selective survival and reproduction of individuals. Individual selection favors the development of “selfish traits” that benefit the individual and may be deleterious or neutral for the group. TrE is usually neutral for the group because enhanced reproduction of individuals with higher TrE compensates for poor reproduction of individuals with lower TrE.
3) Meme selection. Memes compete for dominance in individual memory and in the group’s culture (meme pool). Meme selection favors memes that spread faster (those that are easier to learn or require less memory capacity to be remembered) [24]. The meme’s fate also depends on its influence on the individual and group phenotypes. Some meme categories may acquire “viral properties” if they help themselves to propagate (that is, if they make their bearer a more efficient machine for meme dissemination). Teaching skills are one example of such memes [13].
Individuals are diploid and reproduce sexually. Pairs are formed at random within groups (between‐group migration is a separate process); a pair produces one progeny if the parents have enough resources; both parents invest in progeny; pairs are formed anew each year.
The evolvable part of the genotype includes genes for memory capacity (MC), learning efficiency (LE), HE, TrE, and AR. Each gene can be either set to constant (in this case, the trait cannot evolve genetically) or allowed to mutate and therefore evolve. Each copy of a gene has a “value” which is directly translated into phenotype (e.g., if the starting value of MC gene is 0, then all individuals in the population initially have zero memory capacity; a heterozygous individual with two copies of MC gene with values 0 and 0.2 has MC = 0.1).
The genotypic values of MC and LE are linked to the brain volume: increasing them results in larger brains (by default, brain volume is equal to 20 + MC + 30*LE). This is in concordance with the empirical correlations between the brain volume and social learning in primates [32, 33], cetaceans [34], and presumably birds [43]. Brain volume is a costly trait, because the amount of resources needed to produce a child is proportional to the child’s brain volume. This agrees with the idea that parental investment has increased greatly in the course of hominin evolution along with the energetic and cognitive demands of the rapidly growing juvenile brain [18, 44].
Memes are stored in memory and affect phenotypic traits HE, TrE, and AR. Memes are rarely invented; they can be transferred via social learning and forgotten. Each meme is characterized by its category (HE, TrE, or AR), size (the amount of MC needed to store the meme), and efficiency (the change in the phenotypic trait of an individual who knows the meme). Size and efficiency are positively correlated, but the correlation is weak [24]. Large memes can only be learned by individuals with sufficient free MC; thus, meme size limits its propagation. LE affects the probability of successful meme transfer regardless of the meme size. The reasons for this are discussed in [13]; it is suggested that LE, when modeled this way, is helpful for understanding the evolution of human language abilities.
An individual phenotype includes five variable traits: HE (calculated as the sum of the genetic value of HE and the efficiencies of all HE memes known by the individual), TrE (genotypic value of TrE plus the sum of the efficiencies of all TrE memes known), AR (calculated similarly; efficiencies of AR memes can be both positive and negative; this corresponds to survival-impairing and survival-enhancing memes); LE (genetically defined; LE is broadly analogous to the social learning fidelity which is thought to be essential for the brain‐culture coevolution) [1, 2, 12]; and MC (genetically defined).
The life of the simulated population consists of steps (years). The following events take place every year.
1) Spending resources on life support. In the new version of TribeSim, the cost of life support depends on AR: one must spend additional resources to diminish the risk of death (e.g., by making shelter or clothes); otherwise, one can save a few resources by leading a more risky lifestyle. This automatically results in a classical trade-off between reproduction and survival [45], because extra resources saved by a risk-prone individual will be most probably spent on reproduction. Introducing the resource cost for enhanced survival is essential for the goals of the current study because (i) otherwise selection will always favor the lowest possible AR, and (ii) all limitations in TribeSim (e.g., constraints on birth rate and brain expansion) are basically resource limitations, so it is logical that enhanced survival should also be resource constrained. The idea of resource costs of enhanced survival is vividly illustrated by the story of three little pigs: Two pigs saved their resources by building houses of straw and sticks, but put their lives at risk, while the third pig spent many resources on a brick house, thereby enhancing his chances for survival. Per year cost of life support equals 40*(0.3–AR)2 + 2. This formula ensures that, as slower aging evolves, it becomes increasingly more costly to continue evolving in this direction.
2) Spontaneous invention of new memes. An individual invents a meme of a given category with a fixed, low probability (0.0001 per year), regardless of the number of meme categories allowed.
3) Spontaneous forgetting of memes. Each individual can forget any meme with a probability 0.01 per year.
4) Collective hunting. All individuals who possess enough resources go hunting; the cost of the action is 2 resources.
5) Sharing the resources. The resources obtained by the group are shared among all group members. This is consistent with the traditional behavior of some hunter–gatherers [46] and even chimpanzees often share meat after successful hunt [47]. By default, everyone’s shares are equal. However, if there are individuals with TrE > 0, they perform “Machiavellian tricks” to claim larger share. The resources are then distributed according to the individual values of TrE.
6) Learning. Each individual randomly selects a group mate and tries to learn a meme from her. The meme is selected randomly from the memes known by a potential teacher but not by the student. If there are no such memes, or if the size of the selected meme exceeds the free MC of the student, the attempt fails. Otherwise, the probability of success equals to the student’s LE.
7) Death. In the new version of TribeSim, we used the Gompertz law in its simplest form: The probability of death during the current year equals to IRM*eAR*(Age–1), where IRM (initial rate of mortality) is a constant (in the current study, IRM = 0.008); AR is a phenotypic trait that can evolve genetically and culturally; age is the individual’s age in years. Additionally, an individual can die of hunger if he or she does not have enough resources for life support for two years in a row (one hungry year often follows the birth of a child and is not lethal).
8) Reproduction. Each individual older than 6 years attempts to form a pair with a group mate and produce a child. Although age at maturation tends to covary with LS [48, 49], the focus of the current study was on the evolution of LS; so, we modeled a fixed age of maturation for simplicity. Pairs are formed for one year only (serial monogamy). If there are no unpaired individuals in the group, the attempt fails. After the pair is formed, the possibility of producing a child is tested. To produce a child, the parents have to spend the amount of resources which is equal to the proposed child’s brain volume multiplied by 2. Forty percent of these resources are transferred to the child. If both parents together do not have enough resources, the attempt to produce a child fails. After the child is produced, and if the parents have some resources left, 40% of these resources are also transferred to the child, and the remainder is distributed equally among the parents. The equality of parents in TribeSim is reminiscent of the supposedly increased paternal care, decreased sexual dimorphism, and trend toward monogamy and cooperative breeding in hominins [14, 16, 50]. For simplicity, simulated individuals in TribeSim do not have a fixed gender; any two individuals can form a pair and produce offspring.
9) Splitting of the groups. If the group exceeds its upper limit G, it splits in two equal groups.
10) Between‐group migration. An individual can leave his/her group and join another (randomly selected) group with a specified probability (0.001 per year by default).
The parameter values (table) were selected arbitrarily based on the logic of the model and the experience of the preliminary model runs (e.g., the default genetic value of HE was set to 10 to ensure that the population can survive even in the absence of adaptive knowledge). No attempt was made to simulate any real primate species or to obtain quantitatively precise predictions.
Default parameter values
RESULTS AND DISCUSSION
Genetic evolution of the rate of aging (AR) and other adaptive traits (HE and TrE). In the first series of simulations, we have switched the culture off (probability of meme invention was set to zero) to explore the mutual influence of the genetic evolution of AR and other adaptive traits. Some researchers have argued that aging can evolve as an adaptation aimed to enhance evolvability, that is, to accelerate the adaptive evolution of other traits [7, 51-54]. One hypothetical mechanism of such acceleration is via shorter generation time. We asked how fast will HE and TrE evolve at a fixed high (AR = 0.25) or low (AR = 0.03) aging rate. In TribeSim, individuals and groups engage in a never-ending evolutionary arms race with each other. Groups always compete with other groups, thereby promoting the evolution of HE by group selection. Within groups, individuals always compete with their group mates, thus facilitating the evolution of TrE by individual selection. This race never stops, and therefore, high evolvability is clearly beneficial to the evolving lineages, at least in the long term.
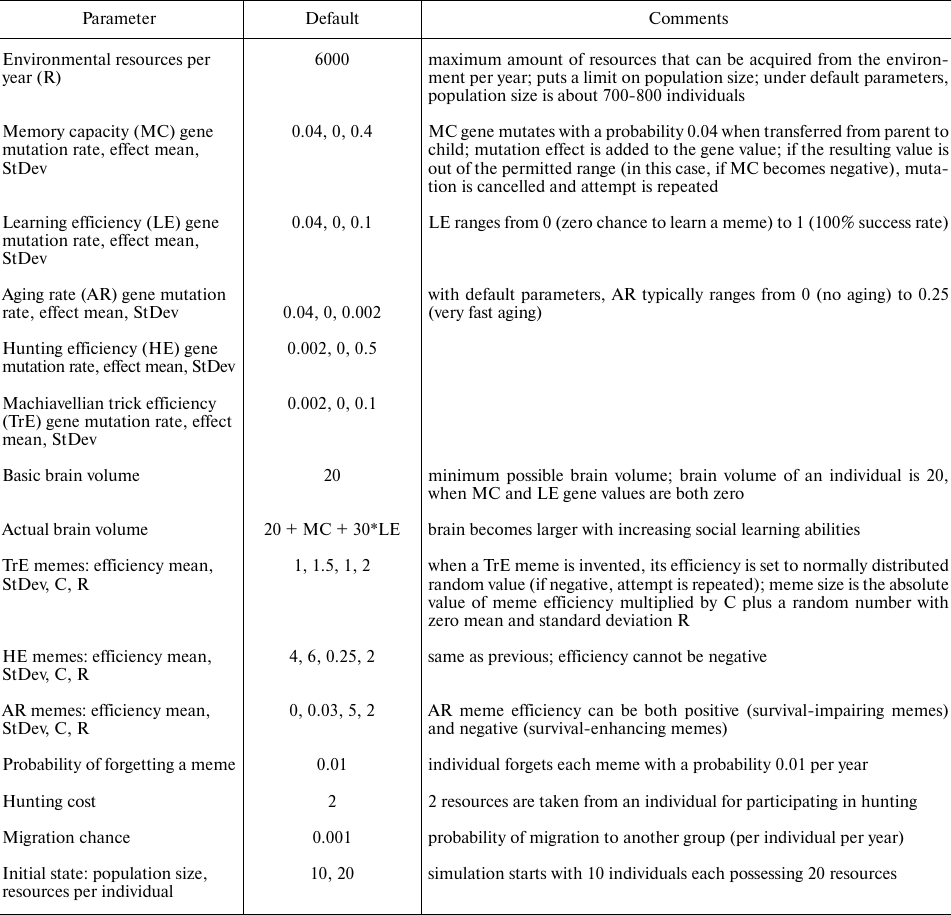
Will HE and TrE evolve faster when aging is fast? In this simulation experiment we used an intermediate level of BGC (G = 40) which ensures that both group selection and individual selection are reasonably efficient. The results are shown in Fig. 1.
Fig. 1. Genetic evolution of HE and TrE under fast and slow aging (short and long generation time). Mean population values are shown for the years 50,000-80,000, from three model runs (± standard deviation). The diagrams show that HE evolves faster when aging is fast, while TrE evolves faster when aging is slow. Parameters: Genetic evolution: HE, TrE; Culture: none; G = 40.
Simulation showed that the group-beneficial trait, HE, evolves faster when aging is fast than when aging is slow, as expected. However, the individually beneficial trait, TrE, evolves faster when aging is slow. Apparently, in this case, the evolution-decelerating effect of longer generation time is outweighed by some other factor. The nature of this factor becomes clear when we consider the way in which TrE affects the Darwinian fitness of individuals. Individuals with higher TrE receive larger share of resources acquired by the group than their group mates with lower TrE. This allows for more offspring (shortens the intervals between births) and reduces the risk of starvation. The first benefit is equally important for long- and short-lived individuals, but the second one is more important in a population of long-livers. When AR = 0.03, average LS is 38-40 years with the current parameters; when AR = 0.25, average LS is 12-13 years. In the first case, the resource competition is more intense, and the percentage of deaths by hunger is higher (17-18% of all deaths); when AR = 0.25, deaths by hunger are almost absent. Moreover, in a population of long-livers with heritable variation in TrE, there is a high resource inequality, which deprives the individuals with lower TrE from the opportunity to reproduce. Consequently, in a population of long-livers, TrE is under stronger selection. This turns out to be a more powerful evolutionary force than the effect of longer generation time. This results in faster evolution of TrE in a population of slowly aging individuals.
Thus, we see that faster aging can accelerate the evolution of some but not all adaptive traits. If the trait’s positive effect on fitness increases with LS, then the trait can even evolve faster in a population of slowly aging individuals.
Next, we asked if faster (or slower) aging can evolve because it accelerates the evolution of other adaptive traits. To this end, we modeled a population in which two traits (AR and HE or AR and TrE) evolve genetically, and compared it with a population in which only AR evolves genetically; culture is absent. If faster (or slower) aging can evolve specifically in order to accelerate the evolution of other traits, then we expect that the joint evolution of AR and HE will result in faster aging, while the joint evolution of AR and TrE will result in slower aging, as compared with a population in which only AR evolves.
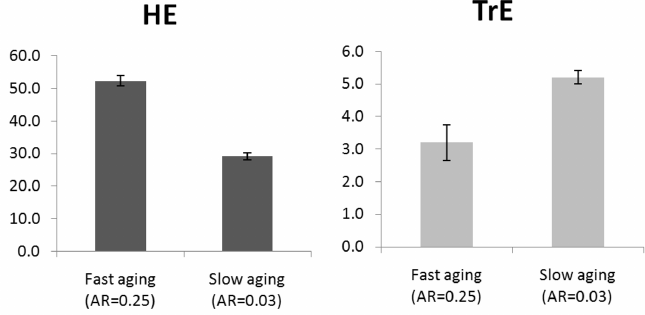
In this experiment, as well as in the subsequent ones, we used three different levels of BGC: G = 15 (strong BGC and group selection, weak individual selection), G = 40 (moderate BGC, group and individual selections of comparable strength), and G = 2000 (no BGC, no group selection, strong individual selection). The simulation results are shown in Fig. 2.
Fig. 2. Genetic evolution of AR, HE, and TrE in three situations: Only AR evolves, AR and HE evolve, AR and TrE evolve; culture is absent. Mean values for the years 50,000-80,000 from three model runs are shown (± standard deviation).
The diagrams show that the joint evolution with other traits has no significant effect on the evolution of AR. Minor differences seen in the chart are not in line with the above expectation and can be explained by other factors (small number of model runs and slightly lower efficiency of selection on a trait when more than one trait is under selection). Thus, simulations did not confirm the idea that the rate of aging can evolve specifically in order to accelerate the evolution of some other adaptive traits.
The diagrams also show that stronger BGC promotes the evolution of faster aging, while weaker BGC facilitates the evolution of slower aging. This is because longer LS is very beneficial to individuals but not to groups (the group’s competitiveness does not depend much on how quickly generations change within the group). When BGC is strong, both individual and group selections are working against excessive consumption of resources needed for enhanced survival, but when BGC is absent, only individual selection is doing the job. From the standpoint of the “good of the individual”, the benefits of a long life outweigh the damage caused by the costs of its extension, while from the standpoint of the “good of the group”, these costs are not compensated. Therefore, in the case of a predominance of group selection, faster aging evolves, and in the case of a predominance of individual selection, slower aging evolves.
We can see that HE (group-beneficial trait) develops better when BGC is strong (G = 15), as expected. In this particular case, the evolution of HE is also accelerated by faster aging. Conversely, TrE (individually beneficial trait) develops better when BGS is absent and individual selection is the strongest (G = 2000); slow aging also aids the evolution of TrE.
The impact of Machiavellian and cooperative cultures on the genetic evolution of aging. Cultural traits differ from genetically determined traits in several important ways [55], two of which are especially relevant for the current study. First, cultural traits are inherited not only vertically (from parents to children), but also horizontally (from any individual to any other). This means that reproduction of memes is not inextricably linked with reproduction of genes. As a result, memes can evolve in a “selfish” way: Cultural evolution can produce traits that reduce the Darwinian fitness of individuals (i.e., impair the propagation of their genes). Second, cultural traits take time to acquire through social learning. Individuals are born with empty memories and are able to learn throughout their lives. The longer they live, the more knowledge they can acquire, and the stronger the phenotypic expression of the culturally determined trait will be. For example, hunting prowess (HE) can be honed over a lifetime, making older individuals, on average, more efficient hunters than younger individuals.
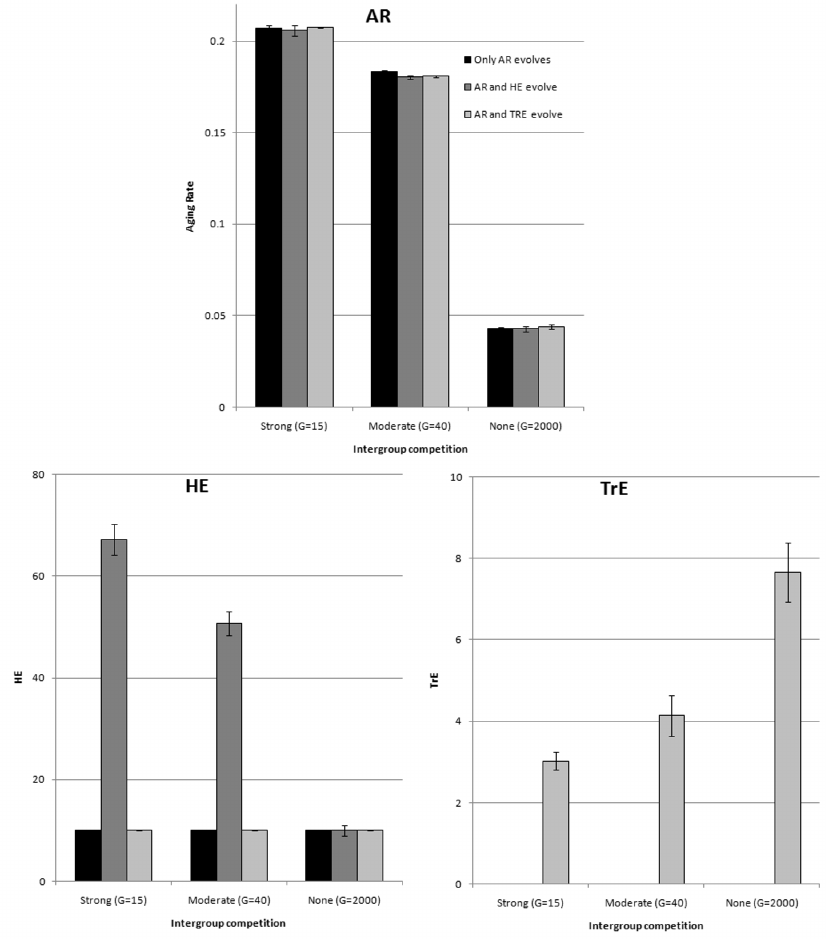
Our next task was to understand how culture (Machiavellian, cooperative, and complex) influences the evolution of AR. For simplicity, we started with modeling not a naturally developing culture (which, according to the theory of cultural drive, co-evolved with the ability for social learning), but a stationary one, evolving only within the initially specified limits. To do this, we set the fixed values MC = 5 (memory that can accommodate several large memes or several dozen small ones) and LE = 0.6 (at this level of learning efficiency, it takes about 10-20 years to fill the memory with memes). Both traits in this experiment were “free”, i.e., did not affect the brain volume, which was always equal to 20. With these parameters, the population’s meme pool is quickly (within the first hundreds of years) filled with a sufficient number of memes, so that the memory of individuals does not stay empty. The simulation results are shown in Fig. 3a.
Fig. 3. Genetic and cultural evolution of AR. Brain does not evolve (MC = 5, LE = 0.6, Brain volume = 20). Mean values for the years 50,000-80,000 from three model runs are shown (± standard deviation). a) Genetic evolution of AR in four situations: No Culture, culture contains only TrE memes (Machiavellian Culture), culture contains only HE memes (Cooperative Culture), culture contains both types of memes (Complex Culture). b) Cultural evolution of AR in four situations: only AR memes are allowed (No Culture), AR and TrE memes (Machiavellian Culture), AR and HE memes (Cooperative Culture), AR, TrE, and HE memes (Complex Culture). Genotypic (innate) level of AR is 0.1.
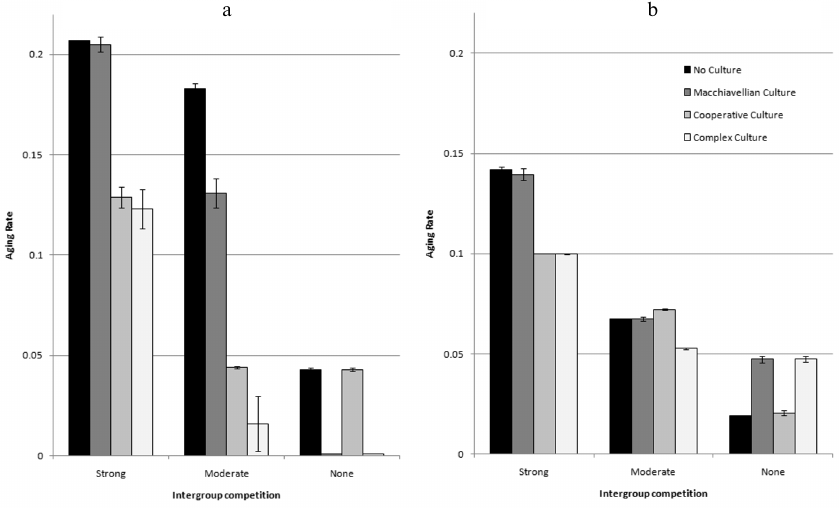
The figure shows that culture tends to facilitate the evolution of delayed aging (in each group of four bars, bars 2-4 are in most cases lower than bar 1). Machiavellian culture is more conducive to this when BGC is minimal (that is, when conditions for the development of such a culture are most favorable). Conversely, cooperative culture promotes slower aging most efficiently when BGC is strong (which means that conditions are favorable for the development of cooperative culture). Complex culture sums up the effects of both specialized cultures, enhancing selection for slow aging at any level of BGC.
Two exceptions are easy to explain. In the first case (strong BGC, Machiavellian culture, bar 2 in group 1), the culture develops poorly, because with a strong BGC, the effectiveness of individual selection, which supports “selfish” traits, is low. Accordingly, the influence of culture on the evolution of AR is negligible. In the second case (no BGC, cooperative culture, bar 3 in group 3), there is no group selection to support group-beneficial traits such as HE. Accordingly, culture develops poorly, and most importantly, it is not adaptive in the evolutionary sense, because HE is not favored by selection in the absence of BGC. Such an “adaptively neutral” culture, as one would expect, does not affect the evolution of aging.
Why does culture, as a rule, contribute to the evolution of delayed aging (Fig. 3a), while the genetic evolution of the same phenotypic traits (HE and TrE) does not affect the evolution of AR (Fig. 2)? The reason is that genetically determined traits are innate, while it takes time to master culturally determined traits. In the presence of cooperative culture (HE memes), individuals gradually become more and more skillful hunters throughout their lives. At the same time, they become better keepers and disseminators of useful knowledge (hunting skills). Therefore, the longer individuals live, the better for the group: There will be more good hunters and more useful knowledge in it. Consequently, group selection favors slower aging.
In the presence of “selfish” Machiavellian culture (TrE memes), individuals become more and more sophisticated Machiavellian intriguers during their lives. This allows them to receive more resources, and, therefore, to produce more offspring and less likely to die from hunger. Therefore, in the presence of Machiavellian culture (but not innate “Machiavellian instincts”), the Darwinian fitness of individuals grows with a strong acceleration as their LS increases. Consequently, individual selection favors LS extension.
Interestingly, in the absence of BGC, excessive slowing of aging in combination with Machiavellian culture (bar 2 in group 3, Fig. 3a) leads to the extinction of the population under basic parameters (congenital HE level = 10). To complete this experiment, we had to double the innate HE level (HE = 20), which is analogous to the artificial feeding of a population unable to feed itself. The mechanism of extinction is as follows. The extension of LS intensifies the competition for resources, and the Machiavellian culture makes the distribution of these resources extremely uneven (strong resource inequality). Young individuals get almost nothing until they have learned enough TrE memes. The few lucky enough to quickly learn efficient TrE memes live long lives and reproduce successfully, but most young individuals die from the lack of resources. A society of “greedy and cunning long-livers and starving youth” is emerging. An acute shortage of resources leads to a decrease in the proportion of individuals participating in collective hunting. Hunting is a costly action for which an individual spends 2 resources; if one does not have these resources, one does not go hunting. The decrease in the number of hunters could be compensated by the increase in hunting prowess, but in this case, this is not possible, since the innate HE level does not evolve, and there are no HE memes. As a result, destructive positive feedback is triggered (hunger increases – fewer hunters – hunger increases even more), which ends with the extinction of the population. The disaster begins at the moment when the total hunting effort of the population becomes insufficient to extract all 6000 resources provided annually by the environment. Of course, this is possible only in the absence of BGC. If group selection works, it will prevent the catastrophe by prudently discarding groups in which aging deceleration and resource inequality have gone too far. This is exactly what happens, for example, in the situation “Machiavellian culture, G = 40” (bar 2 in group 2, Fig. 3a): group selection does not allow aging to slow down too much.
Cultural evolution of the rate of aging. After looking at how culture influences the genetic evolution of AR, we repeated the previous experiment, this time allowing the trait to evolve culturally rather than genetically. To do this, we prohibited the AR gene from mutating (fixed genotypic value AR = 0.1) and introduced a new category of memes: AR memes. These memes can either increase or decrease AR. The first corresponds to a risky behavior that allows an individual to save resources or, which is the same thing, to get additional resources in exchange for the increased risk of death (“straw hut memes”). The second corresponds to spending additional resources to minimize risk of death (“brick house memes”).
We modeled the same three levels of BGC (G = 15, 40, 2000) and four variants of culture: No culture (AR memes only), Machiavellian culture (AR and TrE memes), Cooperative culture (AR and HE memes), and Complex culture (AR, TrE, and HE memes). Other parameters were the same as in the previous experiment.
We already know to what stable levels the genetic evolution of AR tends with these parameters (Fig. 3a). In other words, we know the evolutionary optima (or evolutionary stable states) of AR from the genes’ point of view. Will the cultural evolution of AR be attracted to the same stable states? The simulation results are shown in Fig. 3b.
We see that BGC affects the cultural and genetic evolution of AR in a similar way: strong BGC contributes to the cultural evolution of high AR (this allows the group to save resources), while weak BGC promotes the cultural evolution of low AR. However, the way Machiavellian and cooperative cultures influence the cultural evolution of AR is very different from what we observed in the case of genetic evolution of AR. There are several reasons for these differences.
The first reason is that in cultural evolution, competition between memes for dominance in the memory of individuals and group meme pools plays an important role. Indirect analogs of this can be found in genetic evolution in nature (e.g., trade-offs between different adaptive traits), but this is not the case in TribeSim. For example, the TrE gene alleles compete with each other, but not with the HE or AR gene alleles, and the evolution of innate Machiavellian abilities does not limit the evolution of innate hunting abilities in any way. Memes of different categories, on the contrary, compete for the same resources: hosts (individuals), their memory capacity, and the time they spend on learning.
The second reason is that certain categories of memes can become viral, that is, they can enhance their own spread by turning their hosts into more efficient “machines for meme storage and dissemination”. AR memes with a negative effect (“brick house memes”) are a typical example of viral memes because they extend the life of individuals. Long-lived individuals accumulate more memes in their memory, keep them longer and pass them on to a larger number of imitators (students). Therefore, other things being equal, “brick house memes” spread faster and outperform “straw hut memes”. Because of this, cultural evolution of AR often results in lower phenotypic values of AR than it is optimal from the point of view of genes (below the evolutionarily stable state characteristic of the genetic evolution of AR).
The third reason is that a long LS enhances cultural development, while a short LS inhibits it [13]. Therefore, all other things being equal, in a society of long-livers, any culturally determined phenotypic traits develop more strongly than in a society of short-lived individuals.
Let us consider in more detail the 12 situations shown in Fig. 3b (bars nos. 1-12) to understand how these factors work. It should be remembered that the genotypic (congenital) AR level is fixed and equal to 0.1, and the phenotypic AR value can be changed only by learning AR memes.
No. 1: Strong BGC, only AR memes are allowed. As we know, in this situation, the genetic evolution of AR tends to AR ≈ 0.21 (Fig. 3a, bar 1). A strong BGC makes saving resources highly relevant for groups. Group selection supports groups with low LS because short-lived individuals spend less resources per year. During cultural evolution (Fig. 3b, bar 1), a lower level of AR is established (AR ≈ 0.14), but it is still higher than the initial genotypic level of 0.1. This means that in competing groups, under the influence of cultural group selection [42], a “straw hut culture” is formed. The final AR level is still lower than in genetic evolution because “straw hut memes” shorten the life of their hosts, thereby hindering their own spread. Therefore, it is difficult for them to compete with the “brick house memes”, which, on the contrary, help themselves to spread (are viral).
No. 2: Strong BGC; AR and TrE memes allowed. Strong BGC results in poor development of the Machiavellian culture. As a result, AR memes with a positive effect (“straw hut memes”), supported by powerful group selection, drive out TrE memes from the meme pool. Consequently, the Machiavellian culture does not affect the final AR level, which turns out to be the same as in the previous case (about 0.14).
Nos. 3-4: Strong BGC; AR and HE or AR, TrE and HE memes are allowed. Strong cultural group selection supports groups with an effective cooperative (hunting) culture. As a result, this culture is developing strongly, and HE memes are almost completely displacing AR and TrE memes from the group meme pools. The AR culture cannot develop at all, and the phenotypic level of AR remains at its original, genetically determined level (0.1). This is also facilitated by the weakness of group selection in favor of “straw hut memes”, since the evolutionary optimum in the genetic evolution of AR with these parameters (cooperative culture and G = 15) is about 0.12-0.13 (Fig. 3a, bars 2 and 3) which is only slightly higher than the congenital genotypic level of AR in the current experiment (0.1). Therefore, group selection to reduce LS in this situation is not very strong. More important are the hunting skills which require time (that is, longer lives) for their acquisition.
No. 5: Moderate BGC; only AR memes are allowed. In this case, the level AR ≈ 0.07 is established, which is lower than the initial genotypic level (0.1) and much lower than the level to which the genetic evolution of AR tends under the same conditions (0.18, Fig. 3a, bar 5). The first means that the groups have developed a “culture of brick houses”. The second means that this culture has developed despite the fact that it would be more beneficial (in terms of Darwinian fitness) to individuals and groups to have lower LS, that is, to have a “straw hut culture”. Obviously, this is the result of “selfishness”, or the viral properties of the “brick house memes” (see above).
Nos. 6-8: Moderate BGC; AR and TrE, AR and HE or AR, TrE, and HE memes are allowed. In the genetic evolution of AR with these parameters, any culture (Machiavellian, Cooperative, or Complex) leads to a decrease in AR (in Fig. 3a, bars 6-8 are lower than bar 5). With cultural evolution, this is not observed: the final AR level remains approximately the same as in the previous situation (0.05-0.07; Fig. 3b, bar 5). The reason lies in the balance of two evolutionary forces. On one hand, Machiavellian and/or hunting culture enhances individual and/or group selection for longevity. On the other hand, Machiavellian and hunting memes, supported by selection, spread in the meme pool and thus limit the possibilities for the propagation of “brick house memes”.
Nos. 9 and 11: No BGC; AR or AR and HE memes are allowed. In the absence of BGC, the hunting culture is not supported by selection, HE memes do not spread and do not affect the final AR level, so these two situations are similar. The resulting AR level is very low (0.019-0.020). This is significantly lower than in the case of genetic evolution of AR under the same conditions (0.043). The reason is again in the “selfishness” of AR memes with a negative effect (memes of brick houses). By extending the life of individuals, these memes help themselves to spread. As a result, individuals live longer than would be optimal from the point of view of their Darwinian fitness.
Nos. 10 and 12: No BGC; AR and TrE or AR, TrE, and HE memes are allowed. In the absence of BGC, HE memes are not supported by selection and do not affect the final AR level, as already mentioned, so the two situations are similar. The resulting AR level is 0.047-0.048, which is significantly higher than in the case of genetic evolution of AR under these conditions (0.001). It is also higher than in the case of cultural evolution of AR in the absence of the Machiavellian culture (0.019-0.020, see above). The reason is in the extremely strong development of Machiavellian culture with these parameters. TrE memes fill a significant part of the meme pool (the volume of which is limited by fixed values of MC and LE) and thereby hinder the development of the culture of brick houses. The strong development of Machiavellian culture under these parameters is explained by the fact that the long life of individuals leads to a shortage of resources, while Machiavellian culture itself creates a strong resource inequality (a “society of greedy, cunning long-livers and starving simple-minded youth”). The combination of these two factors leads to a dramatic increase in the proportion of deaths by hunger. This proportion increases to 62-65% of the total number of annual deaths (in the absence of Machiavellian culture in situations 9 and 11, it is less than 1%). Under such circumstances, the best protection from premature death is provided not by the “brick house memes” (which actually increase the individual’s need for resources), but by the TrE memes, which provide the individual with additional resources. Machiavellian memes, by prolonging the life of individuals, acquire viral properties and spread even faster, displacing AR memes from the meme pool and thereby hindering the development of the culture of brick houses.
In the absence of hunting memes (situation 10), the population dies out in the same way as in the case of the genetic evolution of AR with the same parameters (see above). To complete this model experiment, we had to increase the innate HE level (from 10 to 20). If hunting memes are allowed (situation 12), then the population survives. Although hunting culture in the absence of BGC is not supported by selection, some HE memes still spread due to what can be called “cultural drift”, a phenomenon which is especially pronounced in the absence of BGC [13]. As a result, the average HE level is above 10, and the population does not reach the fatal threshold, when the total hunting effort of the population becomes insufficient to extract all 6000 resources provided annually by the environment.
Genetic-cultural evolution of AR. So far, we have compared the genetic and cultural evolution of AR, looking at them separately. However, in real anthropogenesis, these processes most likely have proceeded in parallel. There are reasons to believe that there were both the genetic evolution of AR (e.g., the maximum LS of Homo sapiens is about twice as high as the maximum LS of other great apes [56]) and cultural evolution: it is obvious that humanity has accumulated a huge amount of knowledge, customs, skills, social practices and norms that affect survival and LS [4-7].
In TribeSim, if AR is allowed to evolve in both ways simultaneously, then a complex process of genetic-cultural evolution of the trait unfolds. Genetic changes in AR affect the development of cultural AR controls and vice versa. Let us consider the course of the genetic-cultural evolution of AR in two situations that differ in the direction of “evolutionary interests” (the position of evolutionary stable states or optima) of the AR genes and AR memes.
1) The “interests” of genes and memes are initially in different directions. Parameters: Genetic evolution of AR (other genes are fixed); cultural evolution of AR (other memes are prohibited); initial genotypic level of AR is 0.1; G = 40 (moderate BGC).
We already know from previous experiments that with such parameters, the genetic evolution of AR, if other factors do not interfere with it, tends to an equilibrium level of about 0.18, while cultural evolution, due to the ability of “brick house memes” to facilitate their own spread, tends to a lower level of about 0.07.
In the case of genetic-cultural evolution, memes begin to shift the trait down, while genes are trying to shift it up and to compensate for the influence of culture (Fig. 4, left graph). Culture in this case plays the role of non-adaptive phenotypic plasticity, which contributes to the enhanced genetic evolution of a trait in the direction opposite to the direction of plastic changes [57]. In other words, because culture pulls the trait down, genes have to pull it up even more. This phenomenon is known as genetic compensation [58]. The genetic-cultural evolutionary process needs considerable time to come to a stationary state, partially because culture introduces a wide variation in the phenotypic manifestation of the trait, and thus selection turns out to be less effective. Eventually, the genotypic value of the trait rises above the level to which the purely genetic evolution of AR tends under the same conditions. In this case, the effect of culture is always aimed at reducing the phenotypic value of AR, that is, the culture of brick houses develops and is maintained.
Fig. 4. Genetic-cultural evolution of AR. Thin line – genotypic value of AR, thick line – phenotypic value of AR. Straight horizontal line marks the stable state of the trait, which the genetic evolution of AR tends to under the same conditions without culture. The difference between the phenotype and genotype reflects the effect of culture. This difference is positive (the phenotypic value of AR is higher than the genotypic one) when “the culture of straw huts” predominates, and negative when “the culture of brick houses” prevails. Mean values from three model runs are shown.
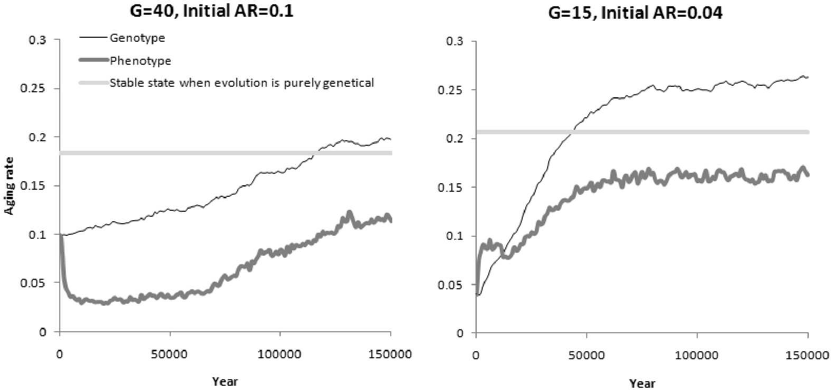
2) The “interests” of genes and memes are initially unidirectional. Parameters: Genetic evolution of AR (other genes are fixed); cultural evolution of AR (other memes are prohibited); initial genotypic level of AR is 0.04; G = 15 (strong BGC).
In this case, the genetic evolution of AR in the absence of culture tends to 0.21, and cultural evolution in the absence of genetic evolution tends to 0.14. Both levels are significantly higher than the starting genotypic level of AR in the current experiment (0.04). Therefore, at the initial stage, both memes and genes should strive to increase AR.
Indeed, in this situation, at first, the culture of straw huts quickly develops (Fig. 4: in the left part of the second graph the phenotypic AR level is higher than the genotypic level). The genetic level of AR is also growing, albeit at a slower pace. Soon enough, this growth results in culture first becoming neutral (the memes of straw huts and brick houses balance each other), and then a full-fledged culture of brick houses develops. This happens long before the genotypic or phenotypic value of AR approaches 0.21 or even 0.14, which is explained by the viral properties of brick house memes (these memes, as we remember, help themselves to spread, because they prolong the life of their carriers). The selfish evolution of memes shifts the AR level below the genetic evolutionary optimum.
As a result, in both cases shown in Fig. 4, a society is emerging in which young individuals lead a risky life, thereby gaining additional resources, and they have a genetic predisposition to this risky life. But with age, individuals acquire knowledge and skills that make life safer, albeit more resource costly. This is similar to what we see in many human societies.
Genetic evolution of AR and the cultural drive. So far, we have explored the influence of culture on the evolution of LS and aging with fixed (non-evolving) values of memory capacity (MC), learning efficiency (LE), and brain volume. However, in real anthropogenesis, human-specific evolutionary changes in LS and AR most probably took place against the background of a rapidly evolving brain and developing culture.
Our next task was to simulate the evolution of AR in the context of cultural drive (runaway coevolution of the brain, culture, and social learning). The TribeSim program was originally designed specifically for the study of cultural drive [13].
It has been suggested that an additional positive feedback loop through life extension may be present in the autocatalytic coevolution of the brain and culture. Cultural development leads to life extension (both through culturally transmitted skills that extend life and through selection for longevity, which culture promotes). The long life of individuals, in turn, contributes to an even greater development of culture, which stimulates further development of the brain [1, 11, 12, 28-30]. We have previously shown using TribeSim that extending the life of individuals does indeed facilitate brain expansion and cultural development [13], but we have not yet modeled the evolution of LS (or the AR) in the context of cultural drive.
To look at how the brain-culture co-evolution interacts with the evolution of AR, we used the following parameters: Genetic evolution of AR, MC, and LE; initial values: AR = 0.1, MC = 0, LE = 0. MC and AR are costly traits in the sense that their growth leads to an increase in brain volume (which equals to 20 + MC + 30 * LE), and with the increase in brain volume, the resource cost of reproduction increases.
We simulated the process at three different levels of BGC (G = 15, 40, and 2000) and four variants of culture: No culture, Machiavellian, Cooperative, and Complex. First, let us consider in detail the course of the process with G = 40 and a Complex culture (Fig. 5), and then more briefly at the remaining 11 combinations of parameters (Fig. 6a).
Fig. 5. Cultural drive (runaway co-evolution of the brain, social learning, and culture) with fixed or evolving AR. Parameters: Genetic evolution of MC, LE (or MC, LE, and AR); cultural evolution of TrE and HE; G = 40; starting level of AR is 0.1. Mean values from three model runs are shown.
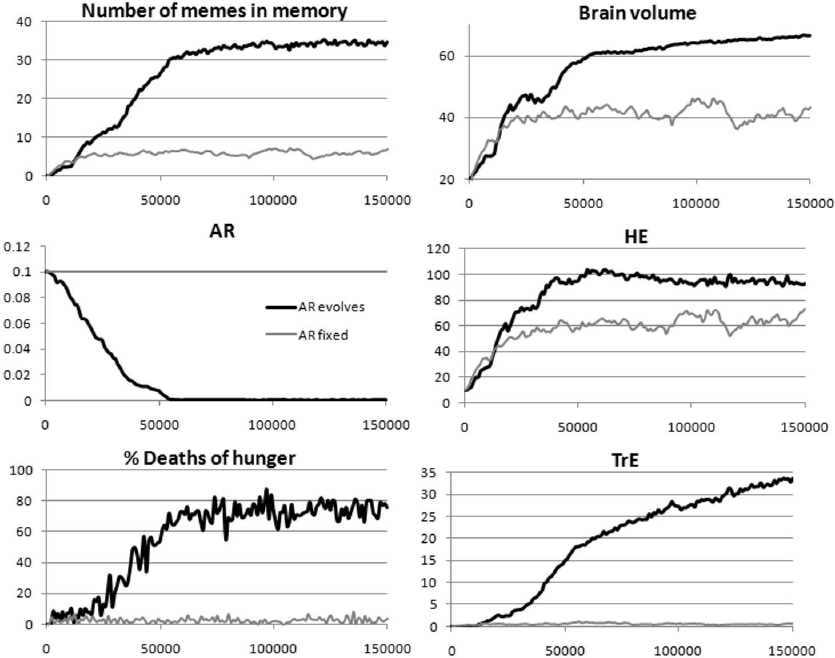
Fig. 6. Cultural drive (runaway brain-culture coevolution) and genetic evolution of AR. Mean values for the years 100,000-150,000 from three model runs are shown (± standard deviation). a) Individuals reproduce throughout lifetime (reproductive period from 6 years to death), b) reproductive period from 6 to 18 years.
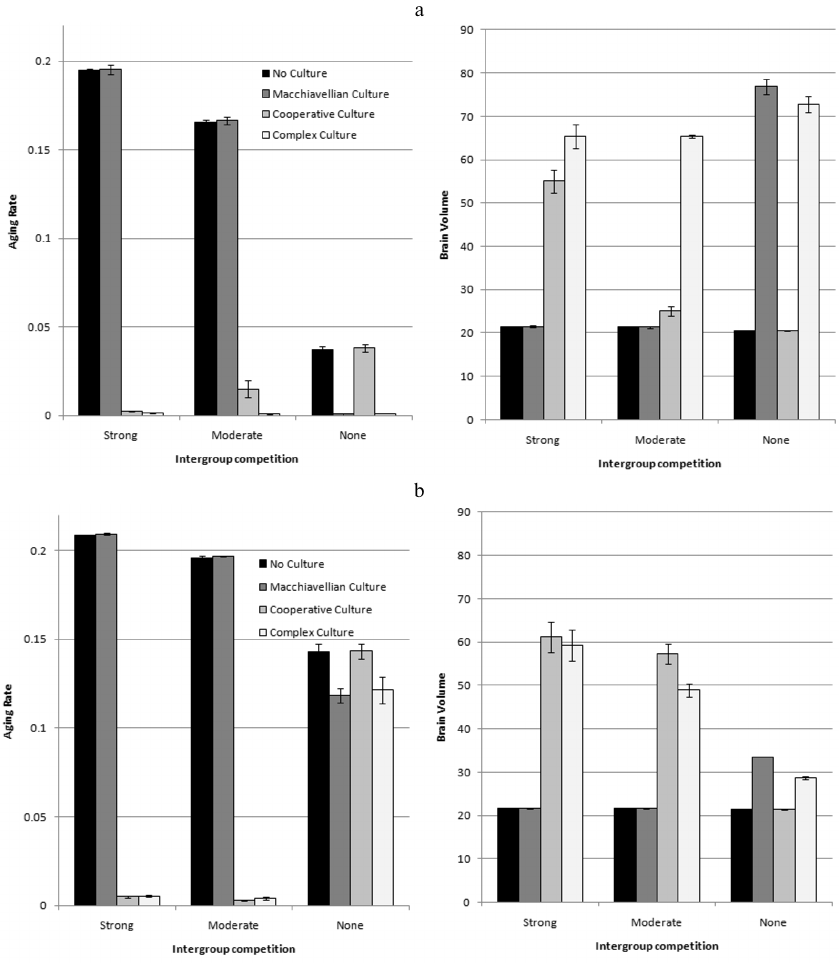
Figure 5 shows that with the evolving AR, a much more powerful cultural drive occurs than with AR fixed at a relatively high level (AR = 0.1): Social learning (MC and LE, on which the brain volume depends) and culture, especially Machiavellian, develop more strongly. This is primarily due to the extension of LS (long-livers are better keepers and disseminators of knowledge), and secondly, to the intensified development of Machiavellian culture. The latter, at a certain stage, forms a positive feedback loop with an increase in the proportion of deaths from starvation. TrE memes exacerbate resource inequality, which leads to the increase in the proportion of deaths by hunger. This, in turn, leads to the emergence of a strong lifesaving effect in TrE memes and, as a consequence, to an even greater spread of TrE memes and to an even greater resource inequality. At the same time, the development of Machiavellian culture spurs selection to improve social learning abilities, which results in brain expansion.
In this case, the cultural drive is first triggered by HE memes, which increase the competitiveness of the groups. Memory capacity and learning efficiency are initially at a zero level, but the MC and LE genes mutate, and therefore, individuals with non-zero values of these traits appear in the population. As long as there is no adaptive knowledge in the meme pool, the MC and LE genes with nonzero values behave like slightly deleterious alleles at the mutation-selection equilibrium: They slightly reduce fitness (there is nothing to learn, but reproduction is more costly), but selection cannot clean out all slightly deleterious alleles from the gene pool. As soon as at least one fairly simple (fitting in a small memory) but efficient HE meme appears in the meme pool, selection for better social learning can begin (groups in which there are individuals who are able to learn and remember this meme gain an advantage, and genes for higher MC and LE begin to proliferate).
At the initial stage (the first 10-20 thousand years), the cultural drive is supported by the spread of HE memes and group selection. The development of cooperative culture leads to a stronger selection for life extension, and AR begins to decline rapidly. A little later (20-30 thousand years after the start of the simulation), aging slows down so much that preconditions for the development of Machiavellian culture arise (long-lived individuals benefit more from this culture than short-lived ones). Machiavellian culture further enhances selection for life extension because it makes longer life more beneficial, and AR continues to decline rapidly. A decrease in AR, combined with the development of Machiavellian culture, leads to the scarcity of resources and increase in resource inequality, which is manifested in the increase in the proportion of deaths by hunger. This triggers the positive feedback discussed above, which gives additional impetus to the development of Machiavellian culture. Both cultures, cooperative and Machiavellian, stimulate the evolution of social learning, which, in turn, facilitates further cultural development.
If AR does not evolve, Machiavellian culture under these parameters does not develop, the second stage of the cultural drive does not occur, the brain and social learning develop weaker, and their development reaches the stationary level earlier.
As we saw from the results of previous experiments, with these parameters and without culture, AR stabilizes at a level of about 0.18 (Fig. 3a, bar 5). With a complex culture, but without brain evolution, AR stabilizes at a level of 0.016 (Fig. 3a, bar 8). Here we see that in the context of cultural drive, AR decreases to almost zero (Fig. 5). This means that not only the extension of life leads to a stronger cultural drive, but also the cultural drive contributes to the evolution of longer life. Thus, the simulations confirmed the theoretical plausibility of a positive feedback loop that enhances brain development and social learning through the evolution of slower aging or longer LS. This loop works even if only a small proportion of individuals manage to realize their innate ability to live long, and the majority (in this case, about 75%) of individuals die prematurely from the lack of resources.
Figure 6a shows the values of AR and brain volume (mean levels for the years 100,000-150,00) for the simulations with the cultural drive, evolving AR, three levels of BGC, and four variants of culture.
The cultural drive was able to start in 6 cases out of 12 (as indicated by the brain volume significantly exceeding the initial level of 20). In three cases (bars 1, 5, 9), the cultural drive could not start because there was no culture. In cases 2 and 6 (strong or moderate BGC, Machiavellian culture), the cultural drive did not start because TrE memes in these situations are not beneficial enough to trigger selection for larger brains, at least as long as LS remains low. In case 11 (no BGC, Cooperative culture), the cultural drive did not start because HE memes are not supported by individual selection, and group selection does not work in the absence of BGC.
In all cases when the cultural drive did start, it resulted in a dramatic decrease in AR which was more pronounced than in the presence of a “free”, initially limited culture (Fig. 3a).
Interestingly, in the course of the co-evolution of the brain, culture and LS (AR), different components of the complex culture “help” each other to develop. For example, Fig. 5 shows that the cultural drive was first triggered by the cooperative component of culture (HE memes). Over time, this created the preconditions for the rapid development of the Machiavellian component (TrE memes), which, in turn, contributed to the further development of the cooperative component. The evolution of the brain can be stimulated by one of the components of culture (the one which is the most beneficial at the moment), but when the costly brain has already developed, this can be used by another component of the culture for its development. For example, if with the same parameters as in Fig. 5 (and Fig. 6a, bar 8), only Machiavellian culture is allowed, then the cultural drive does not start at all and the culture does not develop (Fig. 6a, bar 6). If only cooperative culture is allowed, then the cultural drive starts, but works poorly, and the brain remains quite small (Fig. 6a, bar 7). If both components of culture are allowed at once, then the co-evolution of the brain, social learning, culture, and longevity proceeds very rapidly and leads to impressive results (Fig. 5; Fig. 6a, bar 8).
Genetic and cultural evolution of AR against the background of the cultural drive. In the previous section, we simulated a situation when, against the background of co-evolution of the brain, social learning and culture, the genetic evolution of AR (LS) also occurs. However, in real anthropogenesis, there was almost certainly not a purely genetic evolution of this trait, but a genetic-cultural one. Our next task was to model the genetic-cultural evolution of AR within the framework of the cultural drive. We used the same balanced (and probably realistic) set of parameters as in Fig. 5: moderate BGC, complex culture. The only difference is than now, along with the genetic evolution of AR, cultural evolution of AR is also allowed. The simulation results are shown in Fig. 7.
Fig. 7. Cultural drive with genetic-cultural evolution of the age-dependent probability of death (AR). Parameters: genetic evolution of MC, LE, and AR; cultural evolution of TrE, HE, and AR; G = 40; initial genotypic level of AR is 0.1. Mean values from eight model runs are shown.
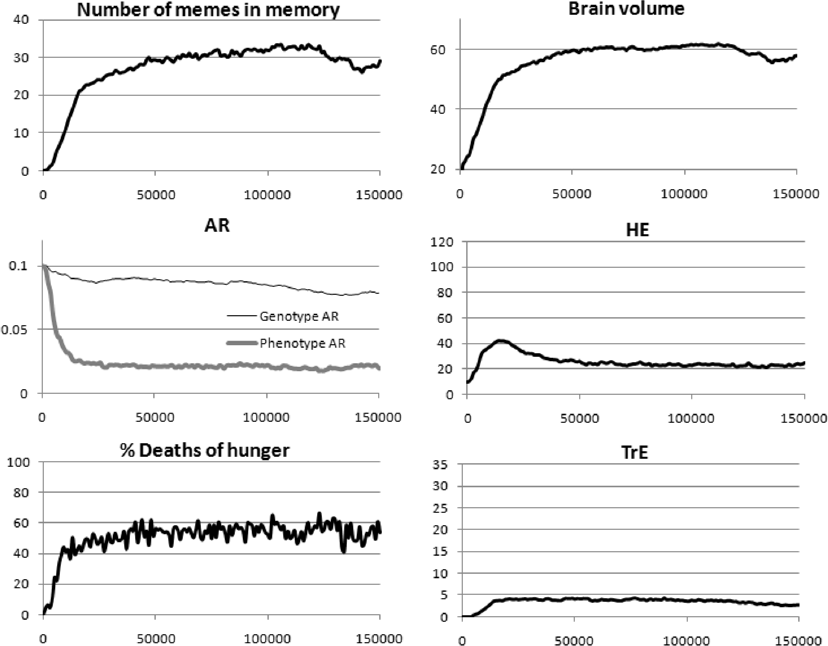
We see that the cultural drive got off to a good start, and the brain eventually expanded to almost the same volume as in the case of purely genetic evolution of AR. The main differences are as follows.
The culture of brick houses has developed strongly: life-extending AR memes have accumulated in the meme pool. This culture played the role of an evolutionary buffer (adaptive phenotypic plasticity), which weakened the selection pressure on the genetic component of AR. As a result, genetic evolution towards lower innate AR level has not gone very far. The resulting society is made up of risky, reckless youth and cautious elderly people. Perhaps something similar took place in real anthropogenesis: genetically, the aging rate did not decrease very much compared to other apes, but the real (“phenotypic”) potential for longevity increased greatly due to cultural achievements (there are plenty of elements similar to the life-extending AR memes in human cultures).
Due to their viral properties, AR memes flooded the meme pool and prevented the development of a powerful Machiavellian culture. The cooperative culture that had triggered the cultural drive in the beginning peaked in about 20,000 years and then declined as AR memes steadily replaced HE memes from the meme pool. Both the cooperative and the Machiavellian cultures did not disappear completely, but remained in a stable, moderately developed state.
The average LS stabilized at about 41 years. Interestingly, with a purely genetic evolution of AR, the average LS is only about 31 years, despite the lower phenotypic value of AR. This is explained by the fact that with a purely genetic evolution of AR, the extremely highly developed Machiavellian culture gives rise to “a society of greedy, cunning long-livers and starving youth”. In such a society, a significant part of young individuals who failed to quickly learn a sufficient number of TrE memes die from the lack of resources. This results in a decrease in the average LS.
In general, the development that we observe with this set of parameters (moderate BGC, complex culture, genetic evolution of costly means of social learning [MC and LE], genetic-cultural evolution of the age-dependent probability of death) is probably a fair approximation to the real evolutionary processes which has taken place during anthropogenesis (although the effect of AR memes driving out other memes from the meme pool is perhaps exaggerated).
Cultural drive and evolution of the post-reproductive period. In the experiments described above, the reproductive potential of individuals did not decrease with age. In humans, however, fertility decreases with age, especially in women, whose reproductive function is completely disabled at a certain age (menopause) [59, 60]. Our next task was to model an age-dependent decline in the reproductive potential in order to answer the following questions: (i) how will this affect the coevolution of the brain, culture, and age-dependent probability of death, (ii) can selection, guided and mediated by culture, support evolution of a long post-reproductive period, and if so, under what conditions?
We repeated the simulations described in “Genetic evolution of AR and the cultural drive” Section, with only one change: individuals could no longer reproduce after 18 years of age (reproductive period from 6 to 18 years; previously, the reproductive period was from 6 years to death).
Figure 8 shows detailed results for G = 40 and complex culture; Fig. 6b summarizes the results for three levels of BGC and four types of culture. These figures can be compared with Figs. 5 and 6a to see the effects of the cessation of reproduction at a certain age on the co-evolution of the brain, culture, and age-dependent probability of death.
Fig. 8. Coevolution of the brain (Brain volume), culture (HE, TrE), and age-dependent probability of death (AR) in the case of a cessation of reproduction at a certain age. All parameters as in Fig. 5, except that individuals cannot reproduce after age 18. Mean values from three model runs are shown.
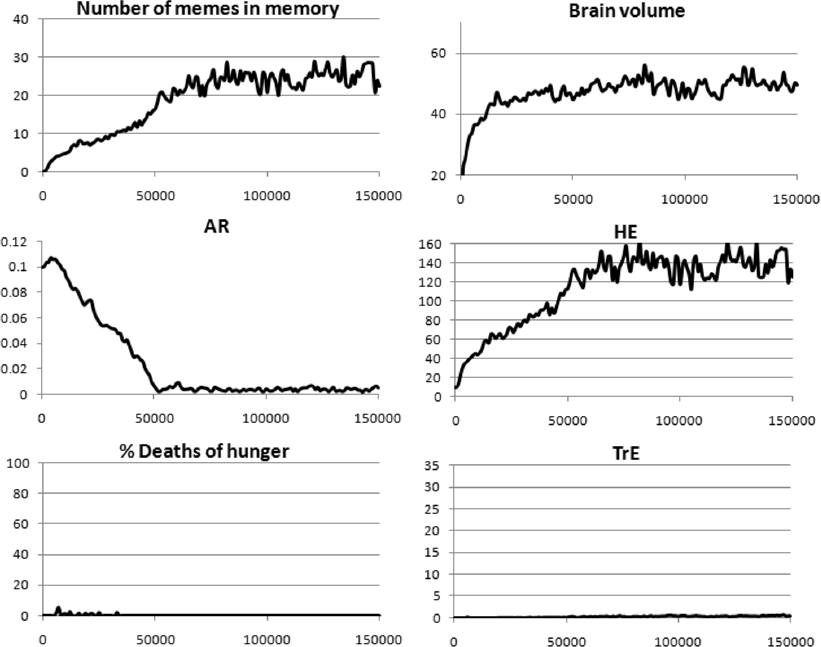
Figure 8 shows that with a moderate BGC and a complex culture (TrE and HE memes), disabling reproduction at the age of 18 does not impede either the cultural drive or the evolution of long life. Moreover, in this case, individuals live on average much longer (average LS = 88.6 years) than in the case of reproduction until death (Fig. 5, LS = 30.7 years), because there are almost no starvation deaths in the population. The absence of deaths by hunger is explained by the fact that after the age of 18, individuals stop spending resources on reproduction, and the birth rate is generally low. This results in a relative abundance of resources in the population. In addition, Machiavellian culture hardly develops (see below), and therefore there is almost no resource inequality in the groups.
Why does selection support the long life of individuals if it does not enhance their reproductive success? In this case, this happens solely for the reason that the presence of older individuals who had enough time to accumulate many HE memes (that is, skillful hunters) greatly increases the competitiveness of the group. Such individuals are useful for two reasons: firstly, they are good hunters and obtain a lot of resources for the group, and secondly, they are good keepers and disseminators of knowledge. Therefore, group selection supports groups with low AR values.
In contrast to the hunting culture, which develops more strongly in this situation than when reproduction continues until death (Fig. 5), the Machiavellian culture hardly develops at all. This is because with a short reproductive period, TrE memes cannot greatly enhance an individual’s reproductive success. They could protect against starvation, but this problem does not arise anyway for the reasons noted above. Therefore, TrE memes in this situation do not acquire viral properties, do not get widespread, and do not stimulate brain development. As a result, the brain volume stabilizes at a lower level than when reproduction continues until death.
These conclusions are confirmed by the simulation results shown in Fig. 6b. Comparison of Fig. 6, a and b shows that the cessation of reproduction at a certain age leads to the following evolutionary consequences (compared to the reproduction throughout lifetime):
1) Individual selection for longevity is generally weaker. This is especially noticeable in the absence of BGC, when only individual selection works. For example, at G = 2000 without culture, the resulting AR level is 0.037 (slow aging, average LS = 39.6 years) if reproduction continues until death (Fig. 6a), and 0.143 (rapid aging, LS = 18.1 years), if reproduction stops at the age of 18 (Fig. 6b).
2) Individually beneficial Machiavellian culture develops weakly, because with a short reproductive period, it brings relatively little benefit to individuals. It is still capable of initiating cultural drive in the absence of BGC, but even in this case, the resulting brain volume is smaller than with the same parameters and reproduction until death. Machiavellian culture does not contribute to the evolution of a long post-reproductive period. For example, at G = 2000 and Machiavellian culture, the resulting level of AR is 0.118 and average LS is 20.1 years. With the same parameters, but with reproduction until death, AR tends to zero (AR < 0.001) and average LS is 54.8 years.
3) In the presence of BGC and group-beneficial cooperative culture, group selection supports slow aging, despite the fact that old individuals do not reproduce. This is because long-livers benefit the group as they accumulate many HE memes and become efficient hunters and disseminators of useful knowledge. With some combinations of parameters (G = 40, cooperative culture), the brain develops even more strongly than in the case of reproduction until death. This is because, due to the absence of starvation deaths, the real LS is higher, which contributes to the development of culture and enhances the cultural drive. Starvation deaths are absent because long-livers do not spend resources on reproduction, and birth rate is generally lower.
4) The effect of “mutual assistance” between cooperative and Machiavellian cultures disappears: since Machiavellian culture becomes less beneficial, it can no longer significantly enhance brain development. As a result, competition between memes comes to the fore: TrE memes, being present in the meme pool as almost unnecessary ballast, do not help, but slightly hinder the development of cooperative culture.
Obviously, the decline in the importance of Machiavellian culture caused by the cessation of reproduction at a certain age would be less pronounced if post-reproductive individuals were able to transfer resources to or otherwise help their offspring or other relatives (that is, if nepotism developed). Indeed, model post-reproductive individuals do not spend resources on reproduction and therefore, on the one hand, they usually accumulate many resources, and on the other, these excess resources do not enhance their Darwinian fitness (because they do not reproduce). If individuals knew how to transfer excess resources to relatives, this would increase their inclusive fitness, and Machiavellian culture would again be very useful. In this case, the situation shown in Fig. 6b would become more like the situation depicted in Fig. 6a. A long post-reproductive period will then be able to evolve not only with a strong BGC and Cooperative culture, but also with a weak BGC and Machiavellian culture. This is in concordance with the “grandmother” hypothesis of the evolution of menopause which suggests that older women gain inclusive fitness by helping their offspring [61-64].
Another possibility for the evolution of a long post-reproductive period with a weak BGC is associated with the cultural evolution of LS. As already mentioned, life-prolonging memes are viral because they make their hosts more efficient meme disseminators. This effect does not depend on whether long-livers can reproduce or not: it is sufficient that they can spread knowledge. For example, if in the situation corresponding to bar 10 in Fig. 6b (genetic evolution of MC, LE, and AR; TrE memes; termination of reproduction at 18; G = 2000) we allow cultural evolution of AR instead of genetic one (genetic evolution of MC and LE; AR and TrE memes; termination of reproduction at 18; G = 2000), then instead of AR ≈ 0.118 (average LS of 20.1 years) we shall have AR ≈ 0.074 (average LS of 27.9 years) (mean values for the years 100,000-150,000 from three model runs). In other words, with these parameters, the genetic evolution of AR does not lead to the formation of a long post-reproductive period because it does not improve the Darwinian fitness of individuals, and there is no group selection. However, the cultural evolution of AR leads to the formation of a significant post-reproductive period (the average LS is 1.5 times the age at which reproduction ends), because it is beneficial to AR memes with a negative effect (brick house memes). As a result, memes, observing their own “selfish interests”, force individuals to live longer than would be optimal from the point of view of their genes.
Interestingly, in this situation (genetic evolution of MC and LE; AR and TrE memes; termination of reproduction at 18; G = 2000), due to the viral properties of AR memes, the progressive co-evolution of the brain and culture is reversed, the brain eventually returns to almost its original volume, and the Machiavellian culture degrades. Cultural drive is first triggered by TrE memes, which are not very beneficial to individuals that stop breeding after 18, but still beneficial enough to trigger selection for larger brains. But as soon as MC and LE begin to increase, life-extending AR memes (brick house memes) quickly spread in the meme pool. They do not increase the Darwinian fitness of individuals (since reproduction still stops at 18), but they spread due to their viral properties and displace TrE memes from culture. After that, the brain begins to shrink, because with these parameters, it is in the “interests” of genes to maintain a large brain for the sake of TrE memes, but not for the sake of AR memes. With the degradation of the brain, culture, especially the Machiavellian culture, gradually fades away. The residual culture of brick houses still keeps the average LS at about 27.9 years, which is one and a half times the age at which reproduction stops.
The ability of cultural evolution to generate a long post-reproductive period, regardless of the Darwinian fitness of individuals, is manifested even more clearly in the idealized situation of a free, but limited culture and a non-evolving brain (Fig. 3b). For example, if G = 40, only AR memes are allowed, and reproduction continues until death, the resulting level of AR is about 0.067, LS ≈ 30.1 (Fig. 3b, bar 5). In this case, there is no post-reproductive period, since reproduction continues throughout lifetime. If, with the same parameters, reproduction stops after 18 years, then the resulting level of AR is about 0.014, LS ≈ 86.9. That is, a very long post-reproductive period evolves. In this case, neither the group needs it (there is no hunting culture, and so everyone hunts with the same efficiency regardless of age), nor the genes of individuals (because long-livers do not reproduce). The only evolutionary actors that “want” individuals to live longer are memes: the long post-reproductive period arises as a result of selfish cultural (memetic) evolution. Group selection does not prevent this, because (i) long-livers do not waste resources on reproduction and therefore never miss a hunt due to the lack of resources; (ii) birth rate is low, and so the competition for resources is not very intense; (iii) due to the absence of a Machiavellian culture, resources within the group are divided equally among all group members; (iv) young individuals who have not yet learned many AR memes do not spend extra resources on life support, but spend them instead on breeding. Therefore, the culture of brick houses does not impair the competitiveness of the group, and group selection does not impede its development. For comparison, with the same parameters but with genetic (rather than cultural) evolution of AR, the resulting level of AR is about 0.185, LS ≈ 15.5 (if reproduction continues until death; Fig. 3a, bar 5) or AR ≈ 0.208, LS ≈ 14.4 (if reproduction stops after 18). This is the consensus reached by the group and individual selections about the “evolutionary interests of genes”. As we see, genes in this situation do not “need” a post-reproductive period.
These examples show that the cultural evolution of AR is capable of forming a long post-reproductive period in diverse situations, including those in which the genetic evolution of AR is unable to do it.
CONCLUDING REMARKS
It is widely accepted that the basic mechanisms of Darwinian evolution (such as selection, mutation, genetic drift, migration, and recombination) only provide a partial account of the evolution of humans and other animals capable of social learning, and that some aspects of their evolution are better described by the dual-inheritance, or gene-culture coevolutionary models [1, 9, 11, 55, 65, 66]. In concordance with this notion, simulations revealed a complex interplay between (i) cultural evolution of group-beneficial and individually beneficial behavioral traits, (ii) genetic evolution of brain capacity and social learning ability, and (iii) genetic and (or) cultural evolution of aging and LS in a simulated social animal species.
The following points deserve special mention.
Rate of aging, or age-dependent probability of death (AR), has different effects on the rate of evolution of other adaptive traits. Modeling confirmed that AR and LS can influence the rate of evolution of other adaptive traits (both individually beneficial and group-beneficial). The direction of this influence can be different. Rapid aging can accelerate the evolution of some traits due to the shorter generation time, while slowing down the evolution of others. For example, if a certain trait is more beneficial (increases the Darwinian fitness of individuals more strongly) in a population of long-livers than in a population of short-livers, then the trait will be under stronger selection pressure when AR is low. This effect may be stronger than the effect of a longer generation time, and as a result, the trait will evolve faster in the population of long-lived individuals.
AR does not evolve for the sake of accelerating the evolution of other traits (aging is not an adaptation for faster adaptive evolution). Modeling did not confirm that aging can evolve as means to accelerate the evolution of other adaptive traits [67]. The point is that the rate of aging is itself an important adaptive trait that is under the direct and very strict control of natural selection. More specifically, the extension of life, other things being equal, greatly enhances the Darwinian fitness of individuals, while the resource costs required to enhance survival reduce it. Therefore, an equilibrium level of AR is established, which depends on the parameters. Against the background of this primary, direct selection pressure on AR, hypothetical secondary, indirect effects associated with the fact that some other traits evolve faster or slower at different AR levels are not detectable (even in the presence of strong group selection).
The equilibrium (evolutionarily stable) levels of AR and LS depend on BGC. If life extension incurs resource costs and groups compete for resources, then, in the absence of culture, group selection works to reduce LS. With a weak BGC, individual selection for life extension comes to the fore and longer LS can evolve, because at the individual level, the benefits from life extension can outweigh significant resource costs.
Culture generally favors the genetic evolution of slow aging and long life, which, in turn, enhances cultural development. Cultural evolution can create novel culturally constructed environments which result in novel selective pressures on genes (cultural niche construction) [9, 68, 69]. In concordance with this, we show that cultural development (accumulation of culturally transmitted adaptive knowledge) can result, along with other factors, in stronger selection for life extension (slower ageing). Long life allows for the accumulation of more knowledge by individuals and thus makes culture more beneficial (that is, enhances the positive influence of culture on the Darwinian fitness of individuals and competitiveness of groups). In other words, if there is a lot of useful knowledge in the population’s meme pool, then it is more beneficial to both individuals and groups that individuals live longer. An individually beneficial (for example, Machiavellian) culture contributes more strongly to the genetic evolution of long life when BGC is weak, while a group-beneficial (e.g., hunting) culture does so when BGC is strong. Moreover, as long LS enhances the development of culturally determined traits (because long-livers accumulate more memes and pass them on to more recipients), a positive feedback may emerge between the genetic evolution of LS and the cultural evolution of other adaptive traits.
Cultural evolution of AR (LS) generally obeys the same laws as genetic evolution, but has its own specifics. The differences between the cultural evolution of LS and the genetic evolution of the same trait stem from several reasons, two of which are probably the most important. First, due to the fact that reproduction of memes is not inextricably linked with reproduction of genes, some categories of memes can acquire viral properties, and cultural evolution can produce traits that reduce the Darwinian fitness of individuals. A typical example are memes that reduce the risk of death (AR memes with a negative effect): they can spread in the meme pool even if it is not beneficial to genes, simply because these memes make their hosts more effective disseminators of memes. Because of this, purely cultural evolution of AR often results in lower values of this trait (and longer LS) than purely genetic evolution of the same trait. Secondly, memes of different categories compete for the same resources (memory capacity of individuals and learning time). Due to this competition, the strong development of some aspects of culture (e.g., the spread of HE memes) can inhibit the development of others (e.g., the spread of AR memes).
The genetic and cultural evolutions of AR (LS) influence each other in a complex way. If LS evolves both genetically and culturally, as was most probably the case in the real human evolution [4-7], then a complex and rather slow gene-cultural co-evolutionary process unfolds. The typical outcome of this process is a society in which young individuals, due to their genetic predispositions, lead a more risky lifestyle in exchange for a chance to gain additional resources. However, with age, they accumulate knowledge that helps to reduce the risk of death at the cost of spending more resources. This is probably similar to what happened in real evolution: innate AR decreased only moderately in humans compared to other apes, but the populations accumulated large amounts of survival-enhancing behaviors and knowledge. The latter acted as an evolutionary buffer (analogous to the adaptive phenotypic plasticity [57]) that slowed down the genetic evolution of low AR and long LS.
Cultural drive promotes the evolution of longer LS, which in turn enhances cultural drive. Simulations have confirmed the efficacy of a hypothetical positive feedback loop that enhances cultural drive (autocatalytic co-evolution of the brain, social learning, and culture) by extending the life of individuals. Long life promotes the development of culture and brain, and developed culture, in turn, promotes the evolution of extended LS.
Culture can contribute to the evolution of a long post-reproductive period. Modeling confirmed the possibility of genetic evolution of a long post-reproductive period by cultural group selection. This can happen if the presence of long-livers who have accumulated valuable knowledge via social learning increases the competitiveness of groups. Prerequisites are the presence of BGC and group-beneficial culture. In the absence of BGC, the cultural drive is stimulated only by individually beneficial knowledge and individual selection, while group-beneficial culture is not favored by selection. Individual selection cannot ensure the genetic evolution of the post-reproductive period, because individual fitness does not increase from the fact that individuals stay alive after the cessation of reproduction, regardless of whether there is culture or not. Moreover, individually beneficial knowledge ceases to be beneficial from the evolutionary point of view when reproduction stops. It is obvious, however, that if post-reproductive individuals can share their resources with relatives, then the post-reproductive period can evolve genetically even in the absence of BGC, since it will increase inclusive fitness [8, 64]. Another possibility of the evolution of the post-reproductive period in the absence of BGC and group-beneficial culture is associated with the cultural evolution of AR (LS), that is, with the spread of knowledge that directly prolongs life. Such memes have viral properties: they spread in the meme pool and “force” individuals to live longer, even if it results in lower Darwinian fitness of individuals.
Overall, simulations have shown numerous and varied possibilities for complex evolutionary interactions between the evolving brain, culture, and LS. Much additional research will be needed to understand which of these interactions actually took place during human evolution and what their relative importance was.
Acknowledgments. We thank V. I. Goloshchapov for optimizing the program code, which made it possible to complete the simulations in a reasonable amount of time, two anonymous reviewers for helpful comments, and E. B. Naimark for insightful discussions.
Ethics declarations. The authors declare no conflict of interest. This article does not contain any studies involving human participants or animals performed by any of the authors.
REFERENCES
1.Laland, K. N. (2017) Darwin’s Unfinished
Symphony. How Culture Made the Human Mind, Princeton & Oxford:
Princeton University Press.
2.Lewis, H. M., and Laland, K. N. (2012) Transmission
fidelity is the key to the build‐up of cumulative culture,
Phil. Trans. R. Soc. B, 367, 2171-2180, doi:
10.1098/rstb.2012.0119.
3.Morgan, T. J. H., Uomini, N. T., Rendell, L. E.,
Chouinard‐Thuly, L., Street, S. E., et al. (2015) Experimental
evidence for the co‐evolution of hominin tool‐making
teaching and language, Nat. Commun., 6, 6029, doi:
10.1038/ncomms7029.
4.Finch, C. E. (2010) Evolution of the human lifespan
and diseases of aging: Roles of infection, inflammation, and nutrition,
Proc. Natl. Acad. Sci. USA, 107, 1718-1724.
5.Finch, C. E., and Stanford, C. B. (2004)
Meat-adaptive genes and the evolution of slower aging in humans, Q.
Rev. Biol., 79, 3-50.
6.Skulachev, V. P., Holtze, S., Vyssokikh, M. Y.,
Bakeeva, L. E., Skulachev, M. V., et al. (2017) Neoteny, prolongation
of youth: from naked mole rats to “Naked Apes” (Humans),
Physiol. Rev., 97, 699-720.
7.Skulachev, V. P., Shilovsky, G. A., Putyatina, T.
S., Popov, N. A., Markov, A. V., et al. (2020) Perspectives of Homo
sapiens lifespan extension: focus on external or internal
resources? Aging (Albany NY), 12, 5566.
8.Johnstone, R. A., and Cant, M. A. (2010) The
evolution of menopause in cetaceans and humans: the role of demography,
Proc. R. Soc. B, 277, 3765-3771.
9.Ross, C. T., and Richerson, P. J. (2014) New
frontiers in the study of human cultural and genetic evolution,
Curr. Opin. Genet. Dev., 29, 103-109.
10.Kirkwood, T. B. L. (2003) Age differences in
evolutionary selection benefits, In Understanding Human
Development (Staudinger, U. M., and Lindenberger, U., eds)
Springer, Boston, MA, pp. 45-57.
11.Henrich, J. (2015) The Secret of our Success:
How Culture is Driving Human Evolution, Domesticating our Species, and
Making us Smarter, Princeton, Princeton University Press.
12.Muthukrishna, M., Doebeli, M., Chudek, M., and
Henrich, J. (2018) The cultural brain hypothesis: how culture drives
brain expansion, sociality, and life history, PLoS Comput.
Biol., 14, e1006504, doi: 10.1371/journal.pcbi.1006504.
13.Markov, A. V., and Markov, M. A. (2020) Runaway
brain‐culture coevolution as a reason for larger brains:
exploring the “cultural drive” hypothesis by computer
modeling, Ecol. Evol., 10, 6059-6077, doi:
10.1002/ece3.6350.
14.Lovejoy, C. O. (2009) Reexamining human origins
in light of Ardipithecus ramidus, Science, 326,
74-74e8, doi: 10.1126/science.1175834.
15.Raghanti, M. A., Edler, M. K., Stephenson, A. R.,
Munger, E. L., Jacobs, B., et al. (2018) A neurochemical hypothesis for
the origin of hominids, Proc. Natl. Acad. Sci. USA, 115,
E1108-E1116, doi: 10.1073/pnas.1719666115.
16.Stanyon, R., and Bigoni, F. (2014) Sexual
selection and the evolution of behavior, morphology, neuroanatomy and
genes in humans and other primates, Neurosci. Biobehav. Rev.,
46, 579-590, doi: 10.1016/j.neubiorev.2014.10.001.
17.Holloway, R. L. (2015) The evolution of the
hominid brain, In Handbook of Paleoanthropology (Henke, W., and
Tattersall, I., eds) Berlin, Heidelberg, Springer‐Verlag, pp.
1961-1987.
18.Leigh, S. R. (2012) Brain size growth and life
history in human evolution, Evol. Biol., 39, 587-599,
doi: 10.1007/s11692-012-9168-5.
19.Neubauer, S., and Hublin, J.‐J. (2012) The
evolution of human brain development, Evol. Biol., 39,
568-586, doi: 10.1007/s11692-011-9156-1.
20.Rightmire, G. P. (2004) Brain size and
encephalization in early to Mid‐Pleistocene Homo, Am. J.
Phys. Anthrop., 124, 109-123, doi: 10.1002/ajpa.10346.
21.Roth, G., and Dicke, U. (2005) Evolution of the
brain and intelligence, Trends Cognit. Sci., 9, 250-257,
doi: 10.1016/j.tics.2005.03.005.
22.Sherwood, C. C., Subiaul, F., and Zawidzki, T. W.
(2008) A natural history of the human mind: tracing evolutionary
changes in brain and cognition, J. Anatomy, 212, 426-454,
doi: 10.1111/j.1469-7580.2008.00868.x.
23.Miller, I. F., Barton, R. A., and Nunn, C. L.
(2019) Quantitative uniqueness of human brain evolution revealed
through phylogenetic comparative analysis, eLife, 8,
e41250, doi: 10.7554/eLife.41250.
24.Gavrilets, S., and Vose, A. (2006) The dynamics
of Machiavellian intelligence, Proc. Natl. Acad. Sci. USA,
103, 16823-16828, doi: 10.1073/pnas.0601428103.
25.Heyes, C. (2012) New thinking: the evolution of
human cognition, Phil. Trans. R. Soc. B, 367, 2091-2096,
doi: 10.1098/rstb.2012.0111.
26.Laland, K. N., and Rendell, L. (2013) Cultural
memory, Curr. Biol., 23, R736-R740, doi:
10.1016/j.cub.2013.07.071.
27.Whiten, A., Ayala, F. J., Feldman, M. W., and
Laland, K. N. (2017) The extension of biology through culture, Proc.
Natl. Acad. Sci. USA, 114, 7775-7781, doi:
10.1073/pnas.1707630114.
28.Kaplan, H. S., and Robson, A. J. (2002) The
emergence of humans: the coevolution of intelligence and longevity with
intergenerational transfers, Proc. Natl. Acad. Sci. USA,
99, 10221-10226.
29.Caspari, R., and Lee, S.‐H. (2004) Older
age becomes common late in human evolution, Proc. Natl. Acad. Sci.
USA, 101, 10895-10900.
30.Crews, D. E. (2003) Human Senescence:
Evolutionary and Biocultural Perspectives, Cambridge University
Press, Cambridge.
31.Navarrete, A. F., Reader, S. M., Street, S. E.,
Whalen, A., and Laland, K. N. (2016) The coevolution of innovation and
technical intelligence in primates, Phil. Trans. R. Soc. B,
371, 20150186, doi: 10.1098/rstb.2015.0186.
32.Reader, S. M., and Laland, K. N. (2002) Social
intelligence, innovation, and enhanced brain size in primates, Proc.
Natl. Acad. Sci. USA, 99, 4436-4441, doi:
10.1073/pnas.062041299.
33.Street, S. E., Navarrete, A. F., Reader, S. M.,
and Laland, K. N. (2017) Coevolution of cultural intelligence, extended
life history, sociality, and brain size in primates, Proc. Natl.
Acad. Sci. USA, 114, 7908-7914.
34.Fox, K. C. R., Muthukrishna, M., and Shultz, S.
(2017) The social and cultural roots of whale and dolphin brains,
Nat. Ecol. Evol., 1, 1699-1705, doi:
10.1038/s41559-017-0336-y.
35.Frankenhuis, W. E., and Nettle, D. (2020) Current
debates in human life history research, Evol. Hum. Behav.,
41, 469-473.
36.Stearns, S. C., and Rodrigues, A. M. M. (2020) On
the use of “life history theory” in evolutionary
psychology, Evol Hum Behav, 41, 474-485.
37.Stanford, C. B. (1999) The Hunting Apes: Meat
Eating and the Origins of Human Behavior, Princeton University
Press, Princeton.
38.Reeve, H. K., and Hölldobler, B. (2007) The
emergence of a superorganism through intergroup competition, Proc.
Natl. Acad. Sci. USA, 104, 9736-9740, doi:
10.1073/pnas.0703466104.
39.Byrne, R. W., and Whiten, A. (1988)
Machiavellian Intelligence: Social Expertise and the Evolution of
Intellect in Monkeys, Apes and Humans, Clarendon Press, Oxford.
40.Humphrey, N. K. (1976) The social function of
intellect, in Growing Points in Ethology (Bateson, P. P. G., and
Hinde, R. A. eds) Cambridge University Press, Cambridge, pp.
303-317.
41.Darwin, C. R. (1874) The Descent of Man, and
Selection in Relation to Sex (2nd Edn.) Appleton, New York, NY.
42.Richerson, P. J., Baldini, R., Bell, A. V.,
Demps, K., Frost, K., et al. (2016) Cultural group selection plays an
essential role in explaining human cooperation: A sketch of the
evidence, Behav. Brain Sci., 39, e30.
43.Van Schaik, C. P., Isler, K., and Burkart, J. M.
(2012) Explaining brain size variation: from social to cultural brain,
Trends Cognit. Sci., 16, 277-284, doi:
10.1016/j.tics.2012.04.004.
44.Hublin, J.‐J., Neubauer, S., and Gunz, P.
(2015) Brain ontogeny and life history in Pleistocene hominins,
Phil. Trans. R. Soc. B, 370, 20140062.
45.Bolund, E. (2020) The challenge of measuring
trade-offs in human life history research, Evol. Hum. Behav.,
41, 502-512.
46.Hawkes, K., O’Connell, J. F., and Blurton
Jones, N. G. (2001) Hadza meat sharing, Evol. Hum. Behav.,
22, 113-142, doi: 10.1016/S1090-5138(00)00066-0.
47.Gilby, C. (2006) Meat sharing among the Gombe
chimpanzees: Harassment and reciprocal exchange, Animal Behav.,
71, 953-963, doi: 10.1016/j.anbehav.2005.09.009.
48.Sear, R. (2020) Do human ‘life history
strategies’ exist? Evol. Hum. Behav., 41,
513-526.
49.Del Giudice, M. (2020) Rethinking the fast-slow
continuum of individual differences, Evol. Hum. Behav.,
41, 536-549.
50.Kramer, K. L., and Russell, A. F. (2015) Was
monogamy a key step on the hominin road? Reevaluating the monogamy
hypothesis in the evolution of cooperative breeding, Evol.
Anthropol., 24, 73-83.
51.Skulachev, V. P. (1999) Phenoptosis: programmed
death of an organism, Biochemistry (Moscow), 64,
1418-1426.
52.Weismann, A. (1889) Essays upon Heredity and
Kindred Biological Problems, Clarendon press, Oxford.
53.Longo, V. D., Mitteldorf, J., and Skulachev, V.
P. (2005) Programmed and altruistic ageing, Nat. Rev. Genet.,
6, 866-872, doi: 10.1038/nrg1706.
54.Goldsmith, T. C. (2008) Aging, evolvability, and
the individual benefit requirement; medical implications of aging
theory controversies, J. Theor. Biol., 252, 764-768, doi:
10.1016/j.jtbi.2008.02.035.
55.Creanza, N., Kolodny, O., and Feldman, M. W.
(2017) Cultural evolutionary theory: How culture evolves and why it
matters, Proc. Natl. Acad. Sci. USA, 114, 7782-7789.
56.Tacutu, R., Thornton, D., Johnson, E., Budovsky,
A., Barardo, D., et al. (2018) Human Ageing Genomic Resources: new and
updated databases, Nucleic Acids Res., 46,
D1083-D1090.
57.Ghalambor, C. K., Hoke, K. L., Ruell, E. W.,
Fischer, E. K., Reznick, D. N., et al. (2015) Non-adaptive plasticity
potentiates rapid adaptive evolution of gene expression in nature,
Nature, 525, 372-375.
58.Grether, G. F. (2005) Environmental change,
phenotypic plasticity, and genetic compensation, Am. Nat.,
166, E115-E123.
59.Lahdenperä, M., Gillespie, D. O. S., Lummaa,
V., and Russell, A. F. (2012) Severe intergenerational reproductive
conflict and the evolution of menopause, Ecol. Lett., 15,
1283-1290, doi: 10.1111/j.1461-0248.2012.01851.x.
60.Maklakov, A. A., and Lummaa, V. (2013) Evolution
of sex differences in lifespan and aging: causes and constraints,
BioEssays, 35, 717-724.
61.Williams, G. C. (1957) Pleiotropy, natural
selection, and the evolution of senescence, Evolution,
11, 398-411.
62.Hamilton, W. D. (1966) The moulding of senescence
by natural selection, J. Theor. Biol., 12, 12-45.
63.Hawkes, K., O’Connell, J. F.,
Blurton-Jones, N. G., Alvarez, H., and Charnov, E. L. (1998)
Grandmothering, menopause, and the evolution of human life histories,
Proc. Natl. Acad. Sci. USA, 95, 1336-1339.
64.Sear, R., and Mace, R. (2008) Who keeps children
alive? A review of the effects of kin on child survival, Evol. Hum.
Behav., 29, 1-18.
65.Whitehead, H., Laland, K. N., Rendell, L.,
Thorogood, R., and Whiten, A. (2019) The reach of gene-culture
coevolution in animals, Nat. Commun., 10, 2405, doi:
10.1038/s41467-019-10293-y.
66.Boyd, R., and Richerson, P. J. (1985) Culture
and the Evolutionary Process, The University of Chicago Press.
67.Markov, A. V., Barg, M. A., and Yakovleva, E. Yu.
(2018) Can aging develop as an adaptation to optimize natural
selection? (Application of computer modeling for searching some
conditions when the “fable about hares” is possible to
explain the evolution of aging), Biochemistry (Moscow),
83, 1504-1516.
68.Laland, K. N., and O’Brien, M. J. (2011)
Cultural niche construction: an introduction, Biol. Theory,
6, 191-202, doi: 10.1007/s13752-012-0026-6.
69.Laland, K. N., Odling‐Smee, J., and
Feldman, M. W. (2001) Cultural niche construction and human evolution,
J. Evol. Biol., 14, 22-33, doi:
10.1046/j.1420-9101.2001.00262.x.