REVIEW: Mathematical Simulation of Electron Transport in the Primary Photosynthetic Processes
Galina Yu. Riznichenko1,a*, Natalya E. Belyaeva1, Ilya B. Kovalenko1, Taras K. Antal2, Sergei N. Goryachev1, Aleksei S. Maslakov1, Tatiana Yu. Plyusnina1, Vladimir A. Fedorov1, Sergei S. Khruschev1, Olga V. Yakovleva1, and Andrew B. Rubin1
1Faculty of Biology, Lomonosov Moscow State University, 119234 Moscow, Russia2Pskov State University, 180000 Pskov, Russia
* To whom correspondence should be addressed.
Received June 22, 2022; Revised August 15, 2022; Accepted August 15, 2022
Summarized results of investigation of regulation of electron transport and associated processes in the photosynthetic membrane using methods of mathematical and computer modeling carried out at the Department of Biophysics, Faculty of Biology, Lomonosov Moscow State University, are presented in this review. Detailed kinetic models of processes in the thylakoid membrane were developed using the apparatus of differential equations. Fitting of the model curves to the data of spectral measurements allowed us to estimate the values of parameters that were not determined directly in experiments. The probabilistic method of agent-based Monte Carlo modeling provides ample opportunities for studying dynamics of heterogeneous systems based on the rules for the behavior of individual elements of the system. Algorithms for simplified representation of Big Data make it possible to monitor changes in the photosynthetic apparatus in the course of culture growth in a photobioreactor and for the purpose of environmental monitoring. Brownian and molecular models describe movement and interaction of individual electron carrier proteins and make it possible to study electrostatic, hydrophobic, and other interactions leading to regulation of conformational changes in the reaction complexes. Direct multiparticle models explicitly simulate Brownian diffusion of the mobile protein carriers and their electrostatic interactions with multienzyme complexes both in solution and in heterogeneous interior of a biomembrane. The combined use of methods of kinetic and Brownian multiparticle and molecular modeling makes it possible to study the mechanisms of regulation of an integral system of electron transport processes in plants and algae at molecular and subcellular levels.
KEY WORDS: photosynthesis, electron transport, fluorescence, kinetic models, Brownian multiparticle models, molecular modelingDOI: 10.1134/S0006297922100017
Abbreviations: Cyt b6f, cytochrome complexes; Fd, ferredoxin; FNR, ferredoxin-NADP+-reductase; MEA, multiexponential approximation method; Pc, plastocyanin; PQ, plastoquinone; PSI and PSII, multienzyme complexes of photosystems I and II.
INTRODUCTION
Living systems are far from thermodynamic equilibrium and are open systems exchanging matter and energy with their surroundings. In photosynthetic membrane, light energy is absorbed, which initiates a complex series of interdependent processes based on electron transport along the photosynthetic electron transport chain. In the first stages, oxidation of the photoactive pigment leads to charge separation and primary accumulation of energy in the form of a transmembrane electric potential. Further electron transfer along the photosynthetic chain is associated with proton transport and formation of the transmembrane electrochemical potential. Reduced NADPH compounds formed as a result of linear electron transport are the most important cofactors of the Calvin–Benson carbon fixation cycle; protons “pumped” into the luminal space are used by the ATP-synthase molecular machine to synthesize ATP from ADP and inorganic phosphate [1-10].
Mathematical and computer models enable evaluation of the values of the parameters of photosynthetic apparatus based on experimental data and to study the mechanisms of regulation of matter and energy transformation processes during photosynthesis. For the primary processes of photosynthesis, the rate constants of individual elementary stages were experimentally determined both in solutions and in native systems [10]. Kinetics of electron transfer along the photosynthetic chain and associated processes of energy conversion in the photosynthetic membrane can be directly recorded upon excitation by short powerful flashes of light using spectral methods (differential spectroscopy, fluorescence methods, electron paramagnetic resonance method). These methods make it possible to determine in real time the rates of rapid changes in the states of individual components of the system at the initial stages of photosynthesis. The ability to directly estimate rate constants of the elementary reactions is a significant advantage of the primary photosynthetic processes system in comparison with most biological processes, for which determination of rate constants of the individual reaction stages is a difficult task. Thus, kinetics of ordinary enzymatic reactions recorded in biochemical experiments reflects only the stages of formation and decomposition of the enzyme–substrate complexes, but not elementary interactions in them, which proceed according to quantum chemical mechanisms within a nanosecond time scale.
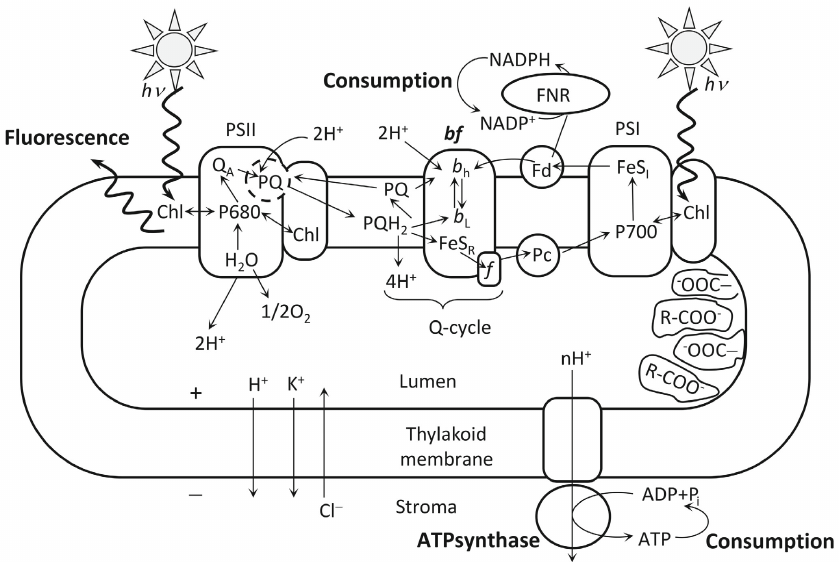
Main participants of the photosynthetic electron transport – multienzyme complexes of photosystem II (PSII), cytochrome complexes (Cyt b6f), complexes of photosystem I (PSI) – are imbedded into the bilayer lipid membrane and facilitate directed electron transfer across the photosynthetic membrane (Fig. 1). Plastocyanin (Pc) protein molecules diffusing in the lumen serve as mediators between Cyt b6f and PSI. Reduction of NADP molecules required in the carbon fixation cycle is carried out by ferredoxin-NADP+-reductase (FNR) complexes taking electrons from small mobile ferredoxin (Fd) proteins in the stroma. Complex shape of the granal and stromal lamellae, as well as heterogeneous distribution of PSII, PSI, and Cyt b6f complexes, have been actively studied recently with the help of electron tomography and cryogenic microscopy [11-14].
The first kinetic models of photosynthesis [15, 16], as well as models of other biochemical processes, were based on the mass action law, which states that the rate of interaction of two substances is proportional to the product of concentrations of these substances. This law is valid only in the case of rapid complete mixing, when a sufficiently large number of molecules of each substance freely diffuse in the volume. In this case, the reaction rate can be considered proportional to the probability of collisions between two molecules of different types.
Notions about the structure of photosynthetic membrane were formed as a result of numerous experimental studies. It has been recognized since late 1960s that the components of photosynthetic chain do not float freely in the cytoplasm. Photosynthetic reaction centers are multienzyme complexes built into the membrane, and interaction of photosystem II (PSII) and photosystem I (PSI) is realized via mobile carriers. These ideas gave rise to the models, where the photosynthetic reaction center is considered as a whole entity. In the first such models [17, 18], electron transfer within the PSII photosynthetic reaction center was considered as a strictly ordered transition between the states of the complex differing in charges on individual components of this complex, while electron transition from the donor to the acceptor side of the complex was initiated by light. Monograph by A. B. Rubin, V. P. Shinkarev [19] presented mathematical background and methods for analyzing electron transfer in the multienzyme complexes. Application of this method to describe processes in the isolated complexes of bacterial reaction centers and photosystems I and II is described in numerous articles [20-22] and monographs [23-26].
Most models of electron transfer processes within PSII are based on the model of a reversible radical pair [27-29], in which it is assumed that, under illumination, the molecule of the photosynthetic reaction center P680 is in exciton equilibrium with the antenna chlorophyll molecules. Interactions in the acceptor part of PSII are described according to the concept of a two-electron gate model (TEG-model) [30-31].
Concentrations of the states of photosynthetic reaction center are considered as variables [32-37]. Comparison with the experiment is carried out according to the fluorescence induction curves recorded under different illumination conditions. In a number of works, the linear and cyclic pathways of electron transfer through PSI are modeled [38-44], as well as the processes of interaction with the Calvin–Benson cycle of carbon fixation [45-49]. The models of photosynthetic electron transport and associated processes are reviewed in detail in the works of Stirbet, Govindjee, et al. [10, 50].
In the works of our group we used ordinary differential equations for describing the probabilities of the states of these complexes in the processes of electron transfer within the multienzyme complexes embedded in a photosynthetic membrane [39-41, 51-55]. The states of the complex are distinguished by the redox states of individual components of the complex, by the presence of non-occupied or occupied sites where mobile electron carriers can be anchored (as in the case of the QB site of PSII), and by the presence of protonated groups.
Rate constants of transitions between the states of the complex may be different for the complexes in different conformational states, for the complexes localized in the granal or stromal parts of the thylakoid, and may also depend on other variables and parameters of the system (temperature, transmembrane electric potential, external electric field, etc.). Rate constants of the transition between the states also depend on the photoinduced electric potential. Transitions between the states of the system are characterized by a directed graph of transitions between these states. The equations for the probabilities of the states are linear with respect to the probabilities of these states. But the rate constants of transitions between the states could depend on illumination conditions, on electric charges on individual carriers that make up the photosynthetic reaction center [56, 57], as well as on proton concentrations in the lumen and stroma, or on the concentrations of mobile carriers (concentration of molecules of the plastoquinone pool (PQ) on the acceptor side of PSII, Pc – on the luminal side of PSI, and Fd – on the stromal side of PSI). Therefore, in the general case, the equations describing transitions between the states of photosynthetic multienzyme complexes are non-linear. Concentration of a certain state of the entire multienzyme complex is equal to the product of probability of this state and concentration of the complex. A detailed description of the state graph construction method is presented by Rubin and Riznichenko [22], the algorithm for constructing the enzyme–substrate complex state graph using the example of the Cyt b6f complex containing 256 states is given by Ustinin et al. [58].
Another type of interaction between the components of the electron transport chain manifests itself in those parts of photosynthetic electron transport chain, where mobile carriers take part in the electron transfer. These involve interaction of the PSII complex with the cytochrome complex at the level of plastoquinone, of the cytochrome complex with the PSI complex at the level of plastocyanin, participation of ferredoxin and FNR in the linear and cyclic electron transport on the stromal side of PSI. In the thylakoid membrane, kinetic parameters of the interaction of complexes with the mobile carriers are determined both by the diffusion time of the mobile carrier to the corresponding complex and by the probability of “correct” landing (docking) of the mobile carrier at the corresponding site on the donor or acceptor side of the complex. Diffusion parameters of the mobile carrier in the corresponding compartment (PQ, inside the membrane, Pc, in the lumen, Fd, in the stromal space) play here an important role, as well as geometry of the reaction volume. Effectiveness of the interaction is mainly determined by the electrostatic interactions of the local charges of atomic groups on the surface of the donor and acceptor. In these areas the electron transfer rate depends on spatial organization of the membrane, which is regulated at the whole-cell level. To describe the nature of interaction of the mobile carriers with photosynthetic multienzyme complexes, direct (agent-based) methods of computer simulation, which are capable to describe motion of the individual macromolecules and their ensembles, rather than kinetic methods, seem to be more adequate. In general, the system of electron transport of the primary processes of photosynthesis is a complex multilevel system. The processes occurring in it are of different nature and differ greatly in time scale. Modeling of various processes in a single system of primary processes of photosynthesis requires different mathematical and computer-based approaches.
In this review, we do not claim to give a complete presentation of all the methods of mathematical and computer modeling currently used to describe the primary processes of photosynthesis. The detailed analytical review of the history of the development of the most widely developed kinetic modeling and modern kinetic models of primary processes is given in the work by A. Stirbet et al. [10]. In this review, using the results of the work of the Mathematical Modeling Group of the Department of Biophysics, Faculty of Biology, Lomonosov Moscow State University, we are trying to show the possibilities of kinetic, stochastic, multiparticle, and molecular modeling for in silico reconstruction of characteristics of the primary processes of photosynthesis, which could be verified with the available experimental data.
MODEL OF PHOTOSYNTHETIC ELECTRON TRANSPORT AND ASSOCIATED
PROCESSES IN THE THYLAKOID MEMBRANE OF GREEN PLANTS AND
MICROALGAE
Most of the early models of photosynthetic electron transport described the process of electron transfer within PSII, which is the main source of fluorescence [32, 33, 36-38, 59-61].
In our group a detailed PSII model was developed [54, 55, 62]; for identification of the parameters we used the fluorescence data recorded after illumination of the object with a short (ns) saturating laser flash. The fit of the simulation results to the experimental data made it possible to estimate parameters of the system that cannot be determined with experimental approach, such as rate constants of nonradiative relaxation in the PSII reaction center, which significantly depends on the illumination intensity [63]. At high light intensities, conversion of the energy into heat can be up to 30% of the light energy absorbed by the photosynthetic object [63], protecting the system from accelerated formation of reactive oxygen species. The PSII model allows us to reproduce real changes in the kinetics of the rising part of the fluorescence induction curve over the time range from microseconds to seconds.
Information value of the fluorescence induction curve is not limited to its rising part. Shape of the fluorescence induction curve in the course of culture growth and under unfavorable living conditions of autotrophic organisms also changes significantly in the slower decreasing part of the curve. For correct interpretation of the changes in the fluorescence yield over long time intervals, it is necessary to take into account the processes of electron transfer not only within PSII, but also along the further linear path of the electron through the cytochrome complex and PSI, cyclic electron flow around PSI, and other alternative electron transfer pathways, as well as the processes accompanying electron transport, especially non-photochemical quenching. These processes with varying degrees of detail are included in the models of Stirbet [10, 34], Lazar [38], Belyaeva et al. [39-41], and Ebenhof [42]. The scheme of processes in the photosynthetic thylakoid membrane, taken into account in the kinetic model developed in our research group, is shown in Fig. 1 and described in detail in Belyaeva et al. [39, 40]. Earlier versions of the model are presented in papers [22, 25].
Fig. 1. Scheme of the processes considered in the generalized kinetic model of the primary processes of photosynthesis. Designations: PSI, PSII, photosystems I and II; bf, cytochrome b6f complex; Chl, antenna chlorophyll; P680 and P700, pigments of the reaction centers of photosystems II and I; QA, PSII primary quinone electron acceptor; bL and bH, low- and high-potential cytochrome heme b; FeSR, Riske iron-sulfur center; f, cytochrome f; FeSI, PSI acceptor complex; PQ, plastoquinone; PQH2, plastoquinol; Fd, ferredoxin; Pc, plastocyanin; R–COO, buffer groups. The signs “+” and “–” show that, as a result of the light-induced processes, the thylakoid lumen is positively charged, and the chloroplast stroma is negatively charged. Wavy arrows denote fluxes of incident light quanta and fluorescence. Thin-line arrows show transfer of the electrons along the electron transport chain and fluxes of H+, K+, and Cl– ions after switching on illumination [40]. Reprinted with modifications by permission from Springer Nature, Photosynthesis Research, 140, 1-19, doi: 10.1007/s11120-019-00627-8, “Analyzing Both the Fast and the Slow Phases of Chlorophyll a Fluorescence and P700 Absorbance Changes in Dark-Adapted and Preilluminated Pea Leaves Using a Thylakoid Membrane model”, authors: Belyaeva, N. E., Bulychev, A. A., Riznichenko, G. Yu., Rubin, A. B. © 2019.
The model of processes in the thylakoid membrane (TM) includes a detailed submodel describing transitions between the PSII states and submodels of transitions between the states of the Cyt b6f and PSI complexes [39, 40, 56]. Transfer of an electron from Cyt b6f to PSI is carried out by the Pc carrier mobile in the lumen, which accepts electrons from Cyt f (the subunit of Cyt b6f facing the lumen) and donates electrons to the photoactive pigment P700. Fd molecules, which are mobile in the stroma and take part in the linear and cyclic electron transport, accept electrons from PSI. Interaction of the donor and acceptor components of the complexes with mobile carriers is described using the mass action law. The equations for proton concentration on the stromal and luminal sides of the membrane describe coupling of the electron transfer with transmembrane proton transition, and operation of ATP synthase; the role of buffer groups is also taken into account. The model by Belyaeva et al. [40] includes non-photochemical quenching and regulation associated with activation of FNR mediating both linear electron transport to NADH and partially cyclic electron flow around PSI. To fit the model, experimental curves of P700 redox transformations over the times from milliseconds to 30 seconds were used together with the fluorescence induction curves (Fig. 2a).
Fig. 2. Results of fitting the model of processes in the thylakoid membrane (a). Experimental curves of chlorophyll a fluorescence (- - - - -) and absorption curves of ΔA810 (⋅⋅⋅⋅⋅⋅⋅) were recorded using whole leaves of Pisum sativum adapted for 15 min in the dark under red light illumination of 200 μM photons m–2 s–1 (radiation maximum 650 nm). Registration time was 30 s. Model kinetic curves of fluorescence induction (FL, ––––) and redox transformations of the photoactive pigment PSI (P700+, – ⋅ – ⋅ –) reproduce well experimental data over the time interval of up to 30 s. b) Model dynamic curves of characteristics of the energized state of the photosynthetic membrane after switching on the light. Curves of fluorescence induction (FL, ––––) and redox transformations of P700 (– – –) were fitted to the experimental data (see Fig. 2a and its caption). ΔΨ(t) is electric transmembrane potential (– ⋅ – ⋅ –), pH of the lumen (⋅⋅⋅⋅⋅⋅⋅⋅⋅), pH of the stroma (--). Dependences of the rate constants of regulatory processes on time are also shown: rate constant of the energy dissipation reaction in the antenna kDAnt (- - - - -) and rate constant of the interaction of Fd with FNR on the acceptor side of the PSI (kFNR, – ⋅ ⋅ – ⋅ ⋅ –) [40]. Reprinted with modifications by permission from Springer Nature, Photosynthesis Research, 140, 1-19, doi: 10.1007/s11120-019-00627-8, “Analyzing Both the Fast and the Slow Phases of Chlorophyll a Fluorescence and P700 Absorbance Changes in Dark-Adapted and Preilluminated Pea Leaves Using a Thylakoid Membrane Model”, authors: Belyaeva, N. E., Bulychev, A. A., Riznichenko, G. Yu., Rubin, A. B., © 2019.
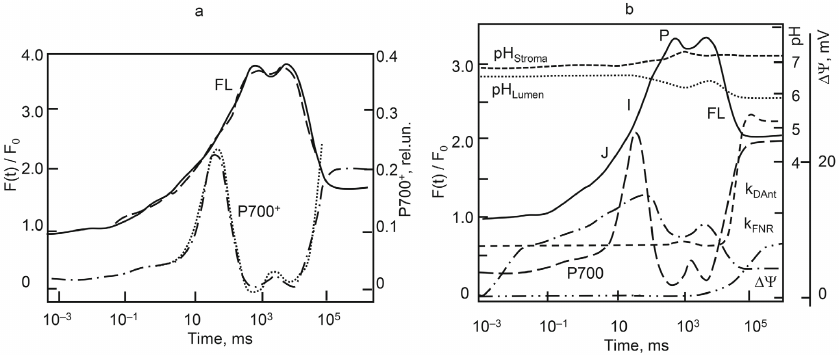
Figure 2b, along with fitted experimental curves of fluorescence induction and redox transformations of the photoactive pigment P700, shows time dependencies of the electric potential across the membrane, pH of the lumen and stroma, and rate constant of non-photochemical quenching. The model makes it possible to track dynamics of the ratio of these values and test the existing hypotheses about their regulatory role.
In recent years, various scientific groups have developed models that take into account the process of migration of the outer part of the PSII light-harvesting antenna to PSI and vice versa. These processes, called “State transition”, occur mainly at high light intensity. By reducing effective size of the antenna and, as a result, number of energy quanta reaching the reaction center, they prevent destructive effect of the intense radiation. It becomes possible to qualitatively reproduce the shape of the decreasing part of the fluorescence induction curve in the model by considering these processes [34, 42, 44].
In our work [41], the processes in the thylakoid membrane of cyanobacteria, where the content of PSI complexes is much higher than of PSII complexes, are considered taking also into account the process of transfer of the mobile part of the light-harvesting antenna from PSII of the granal part of the thylakoid to PSI in its stromal and marginal part. The specific light-harvesting antennae of cyanobacteria (phycobilisomes) are highly mobile, which allows these microorganisms to ensure efficient photosynthesis and prevent photodegradation in a wide range of light intensities. Incorporation of these processes in the model made it possible to describe the kinetics of fluorescence and phototransformations of P700 of cyanobacteria Synechocystis sp. PCC 6803 at high (3000 μM m–2·s–1 photons) and medium (1000 μM m–2·s–1 photons) illumination over the periods of time from milliseconds to several minutes [41, 64].
Thus, kinetic models based on differential equations for the probabilities of states of photosynthetic pigment–protein complexes and equations of chemical kinetics for mobile carriers and transmembrane ion fluxes enable in silico reproduction of the dynamics of the parameters not observed experimentally, in particular, proton concentration on the inner and outer side of the membrane, as well as to describe regulatory processes of the switching of electron flows and non-photochemical quenching of fluorescence.
Despite the large number of parameters in the model, only a few of them can be varied without restrictions to match the experimental curves. A large number of parameters of the detailed models of electron transfer within the PSI, PSII, Cyt b6f complexes were estimated in the course of independent experiments on isolated complexes and are reported in the literature. The ranges of their changes are known for different species and different experimental conditions [65]. The values of such parameters can be fixed when modeling processes in the integral photosynthetic chain. This significantly limits the range of possible parameter variation in the course of fitting model curves to experimental data, and makes the results of parameter identification based on the fitting results more reliable. Thus, in the work of Belyaeva et al. [40], the parameters of the processes within the complexes of PSII and PSI reaction centers were selected from the ranges reported in the literature. Based on the fit of the model, parameters of the time-dependent constants that determine heat loss during fluorescence quenching in the PSII antenna and FNR characteristic activation time FNR kD(t), as well as concentration of buffer groups, were estimated.
The systems of differential equations underlying the suggested kinetic models are given in the original papers [39-41, 62, 63].
Taking into consideration non-photochemical quenching processes, cyclic electron transport around PSI, Mehler reaction, connection with the carbon fixation cycle, and other alternative electron flows in the models makes it possible to qualitatively describe features of the fluorescence induction curves for different photosynthetic species, including those under stress conditions [43, 49, 66-70, 71].
PROBABILISTIC MODELS OF MONTE CARLO TYPE
In any experiment, a signal is recorded from a set of processes occurring in a cell suspension. Moreover, each cell contains millions of electron transport chains. In each of these chains, the process of electron transfer between the corresponding carriers, emission of a fluorescence quantum, and capture of a proton occur with a certain probability. The Monte Carlo simulation method allows you to reproduce the processes of interaction between the system components (agents), which are stochastic in nature. Frequency of the events leading to a change in the state of agents (transfer of an electron from one component to another, emission of a fluorescence quantum, protonation) can be characterized by a certain probability. In the “agent-based”, “corpuscular”, “atomistic” modeling method, general properties of a complex system are derived on the basis of the properties and mechanisms of interaction of the “agents” that make up these systems – some simple objects, constituent elements of this system. As early as in 1958, Garfinkel used the Monte Carlo method to model electron transfer in the mitochondrial complex. The model reproduced electron transfer along the chain, each of the 17,000 chains was represented by a number of cytochrome molecules, which can react with each other with some probability and be transformed into an oxidized, reduced, and inhibited state.
Simulation of the processes in individual photosynthetic chains of ensembles consisting of hundreds of thousands and millions of electron transport chains has become possible due to the use of modern computer technology. Total signal from the simulated ensemble imitates the signal obtained in the experiment with a suspension of cells (chloroplasts) using optical measurements.
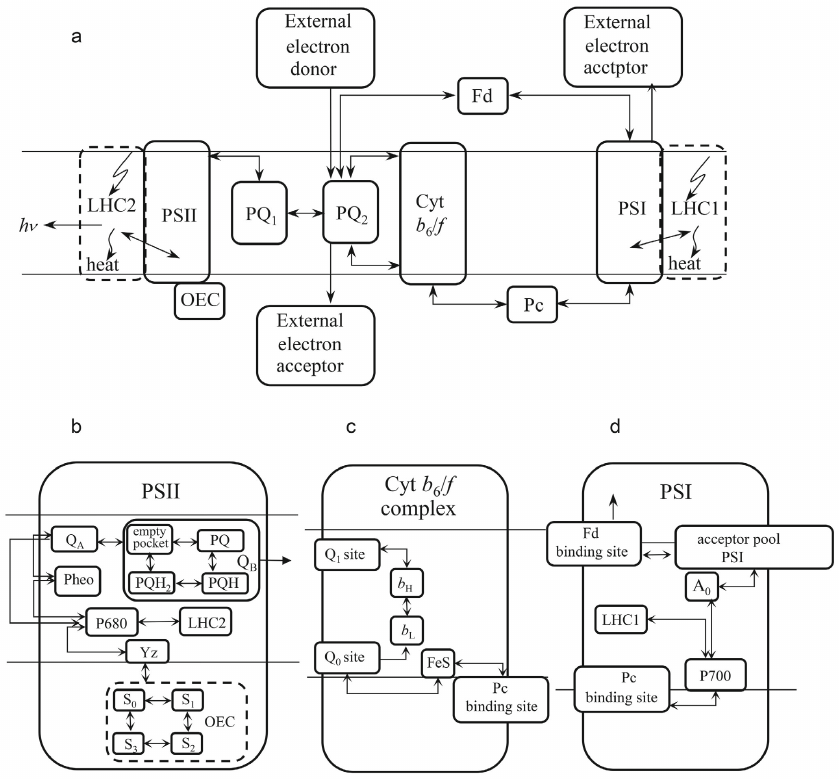
Transfer of an electron between the components, protonation, emission of a fluorescence quantum at each step of the calculation, occurs with a probability specified in accordance with the experimental data on the characteristic times of the ongoing processes, using a random number generator. The number of similar events (emissions of a fluorescence quantum, or acts of oxidation of a photoactive pigment) over a certain time interval is summed up. The model kinetic curve corresponds to the curve observed in the experiment. Thus, we obtain a kinetic curve for an ensemble of photosynthetic chains by introducing data on interaction of the components of individual representatives of this ensemble (agents) into the model. Figure 3 shows a diagram of the processes occurring in each of the several million electron transport chains modeled in the studies by Antal et al. [70] and Maslakov [72]. Explanations are given in the figure caption.
Fig. 3. a) General scheme of the electron transport chain used in the model; b) PSII internal structure; c) Cyt b6f complex internal structure; d) PSI internal structure. LHC2, PSII light harvesting complex; OEC, oxygen-evolving complex; YZ, tyrosine Z (electron donor for P680-chlorophyll of PSII reaction center); P680, PSII reaction center chlorophyll with absorption maximum at 680 nm; Pheo, pheophytin – an electron acceptor involved in the charge separation in PSII; QA, primary electron acceptor of PSII; QB, PSII two-electron acceptor; PQ, plastoquinone; PQ1, PQ pool interacting directly with PSII; PQ2, PQ pool interacting with the Cyt b6f complex; QO, PQH2 binding site; QI, PQ binding site; bL, low potential heme b; bH, high-potential heme b; FeS, Riske iron-sulfur center; Pc, plastocyanin; P700, PSI reaction center chlorophyll with absorption maximum at 700 nm; LHC1, PSI light harvesting complex; A0 is the primary PSI acceptor; pool of the acceptor part of PSI – a set of PSI electron carriers following the primary acceptor; Fd, ferredoxin. Reprinted with modifications from Maslakov [72], licensed under CC BY, © 2020 Maslakov, A. S.
Based on the given rules of transitions between the states of elements, the “Rule-based Monte Carlo” method of building a model makes it easy to modify the structure of the simulated electron transfer chains, to take into account differences in the individual chains, and to combine the photosynthetic reaction centers of photosystems into the groups (energy exchange). We first applied this method to assess the ratio of alpha and beta (QB-non-reducing) PSII centers in the control and heat-treated green microalgae Chlamydomonas reinhardtii [73].
Note that modeling changes in the structure of photosynthetic chain carrier bonds in the traditional way using systems of differential equations for the probabilities (concentrations) of the possible states of the system requires a multifold increase of a number of equations describing the system. Any modification of the simulated circuit requires here a change in the form of many equations of the system, which is a laborious task. By setting individual rules of behavior for all “agents” of the system and rules of interaction for any pairs of carriers, we can take into account any kind of heterogeneity of the system in an agent-based Monte Carlo model. Comparison with the experiment was carried out using fluorescence induction curves after turning on the light in the control and the detergent-treated samples, as well as kinetics of P700 (A820) redox transformations [70]. The number of electron transport chains in the model ranged from several hundred thousand to several million and was comparable to the number of photosynthetic chains in a microalgae cell. The model probabilistically reproduces the processes in individual photosynthetic chains.
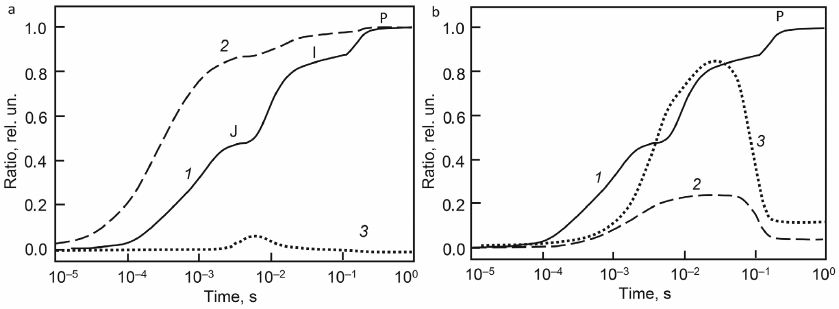
Kinetic curves of fluorescence induction (Fig. 4, panels (a), (b) curve 1) are shown together with the kinetic curves for individual components of photosynthetic chains, including total concentration of QA– [panel (a), curve 2], which is usually assumed to be proportional to the number of closed reaction centers. It can be seen from the model that, at stage J, almost 90% of photosynthetic reaction centers are in the closed state (QA–), which corresponds to the experimental estimate of the transition of 90% of PSII to the closed state after a single flash [74]. At the same time, the fluorescence yield does not exceed half of the maximum level. This difference is due to the lack of direct proportionality between the level of fluorescence and the redox state of QA, in particular, associated with fluorescence quenching by oxidized forms of PQ, which is taken into account in this model.
Fig. 4. Model fluorescence induction curves, OJIP curves (curve 1, a and b), and time dependencies of QA– (a, curve 2), P680+ (a, curve 3), Pc+ (b, curve 2), P700+ (b, curve 3). Reprinted with modifications by permission from Springer Nature, Photosynthesis Research, 138, 191-206, doi: 10.1007/s11120-018-0564-2, “Simulation of Chlorophyll Fluorescence Rise and Decay Kinetics, and P700-Related Absorbance Changes by Using a Rule-Based Kinetic Monte-Carlo Method”, authors: Antal, T. K., Maslakov, A. S., Yakovleva, O. V., Krendeleva, T. E., Riznichenko, G. Yu., Rubin, A. B., © 2018.
The results obtained so far by the Monte Carlo method can in principle be obtained in kinetic models using systems of differential equations [61, 71, 73, 75], while the Monte Carlo method requires more resources. However, rapid development of the experimental methods for studying the structure and complex notions on organization of the photosynthetic apparatus [76, 77] would enable modeling of the processes in complex heterogeneous systems, for which the agent-based Monte Carlo method is undoubtedly more adequate. Rapid development of computational approaches and increase of efficiency of computers performance would make it possible to use this method more widely to adequately reproduce processes in a living cell.
ANALYSIS OF FLUOREMETRY BIG DATA FOR BIOTECHNOLOGICAL AND
ENVIRONMENTAL MONITORING
Advantage of the detailed models of electron transfer processes described above, is the fact that their parameters are the rate constants of the elementary stages of charge transfer between the individual components of the photosynthetic electron transport chain. However, such models are too complicated for mass processing of experimental data, since identification of the parameters of these multicomponent models using standard procedures often turns out to be inefficient, and careful fitting of experimental curves requires laborious manual processing. Simplified models are more suitable for mass processing of experimental data. Models aimed at describing relationship between the primary processes and longer metabolic processes in a plant cell do not require such a detailed reproduction of experimental curves of fluorescence induction over short times. These models also use simplified models to describe the primary processes of photosynthetic electron transport [45, 49, 66].
Development of the methods for automatic recording of data makes it possible to obtain hundreds and thousands of fluorescence induction curves during culture growth in a photobioreactor [73], or in the process of automatic observation of natural systems. In order to understand what changes occur in the photosynthetic apparatus of the photosynthetic objects over time it is necessary to analyze the shape of these curves. For automatic analysis of large data arrays, it is convenient to use simplified models.
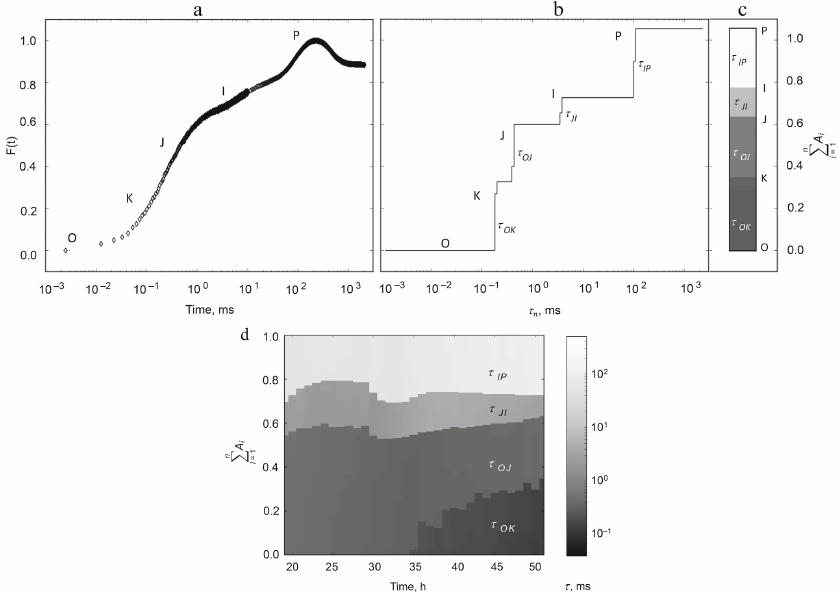
Phase analysis of the fluorescence induction curve. The chlorophyll fluorescence induction curve is usually considered to consist of two or three phases (or stages), which are usually separated by the observed inflection points on the induction curve. The first fast stage (up to hundreds of milliseconds) is best studied, denoted in the literature by the letters OJIP (Fig. 5a). Standard designations on the curve: O (origin, starting point), the first minimum fluorescence level, J and I, are intermediate inflections, P (peak) is the maximum value of fluorescence intensity. Unlike subsequent slower stages, the rising part of OJIP is fairly well reproduced. That is why in the majority of cases analyses of the fluorescence induction curves are focused on model reproduction of the shape of the OJIP curve, which is reliably observed in experiments.
Fig. 5. An example of application of the multiexponential approximation method for the analysis of fluorescence induction curves of chlorophyll a in a nitrogen-starved culture of Chlorella vulgaris. a) OJIP curve and (b) the result of its expansion into exponentials at the beginning of cultivation; c) representation of the multiexponential expansion amplitudes as a heatmap column. Characteristic times of the identified phases are: τOK ~ 0.15-0.25 ms, τOJ ~ 0.4-0.5 ms, τJI ~ 2.6-4.2 ms, τIP ~ 55-130 ms. d) Heat map of the component composition of the OJIP curves during cultivation; the abscissa shows time in hours. Width and shading of the bands reflect amplitude and lifetime of the exponential components of the induction curve. Ordinate on the left is the amplitude scale. Reprinted from [88] licensed under CC BY-NC-ND, © 2020 Plyusnina, T., Khruschev, S., Degtereva, N., Konyukhov, I., Solovchenko, A., Kouzmanova, M., Goltsev, V., Riznichenko, G., Rubin, A.
In many cases, the rising part of the OJIP fluorescence induction curve can be fairly well approximated by the sum of three exponents [78-81]. Strasser, R. [82] proposed a formalized method for calculating characteristics of the energy flows (JIP-test) based on the amplitudes of the phases of the induction curve, using the values of the amplitudes at fixed times (2 ms for OJ and 30 ms for JI), as well as slope of the curve at the initial moment of time. The values calculated employing this method are widely used to assess disturbances of the photosynthetic apparatus both for a culture in a photobioreactor [83, 84] and for agricultural crops [85].
Review by Stirbet et al. [86] discusses the possibility of using the JIP test to assess resistance of photosynthetic organisms to various stress factors. One of the limitations of its application is that the times of individual phases of the induction curve are not fixed. Therefore, although the OJIP test works quite well for green plants, it cannot always be applied to algae and cyanobacteria, in which the shape of induction curve differs significantly from the classical one [50].
Plyusnina and Khrushchev [87] developed a more versatile method for analyzing large arrays of induction fluorescence induction curves, the Multiexponential Approximation Method (MEA) and the pyPhotoSyn software. Instead of semi-empirical staging used previously in most of the studies, MEA allows introduction of more rigorous and universal criteria for estimating phases. The basis of the method is decomposition of the recorded signal into exponents and its representation as a series of exponents. The fluorescence induction kinetic curve is approximated by a series of N exponents with fixed characteristic times τn:
F(t) = FO + ΣNn = 1 An (1 – e–t/τn), (1)
where FO is the minimum value on the fluorescence induction curve F(t), An reflects contribution of the n-th exponent with characteristic time τn to the total signal, t is time.
The result of approximation is a set of amplitudes An, each of which corresponds to the selected fixed time τn (spectrum). For the case when the input signal F(t) is a sum of exponential functions, the spectrum has the form of individual bands with groups of times close to the characteristic times of the exponents that make up the input signal. Bandwidth is determined by the properties of the chosen numerical approximation method and presence of noise in the input signal. The characteristic times of individual stages of electron transfer in the photosynthesis chain differ significantly, and the bands are well resolved. The characteristic times of individual components of the series can be compared with the specific electron transfer processes in the photosynthetic electron transport chain.
Monitoring of photosynthetic activity of microalgae culture using MEA. Automatic methods for recording fluorescence induction curves developed at the Department of Biophysics make it possible to study changes occurring in the photosynthetic apparatus by measuring kinetic curves of the chlorophyll fluorescence induction directly in photobioreactor without disturbing physiological state of the cells [88]. Fluorescence induction curves are recorded at relatively short time intervals and ultimately constitute a large amount of data. Such observation of culture growth becomes especially relevant when solving biotechnological problems of targeted synthesis, when conditions for the growth of cultures enriched in lipids, carotenoids, or molecular hydrogen are selected.
MEA was used to analyze changes in photosynthetic apparatus during cultivation of the microalgae Chlorella vulgaris under nitrogen deficiency [89] and Chlamydomonas reinhardtii under sulfur deficiency [84]. Nutrient deficiency leads to the change in the functional state of photosynthetic apparatus and is manifested as a change in the shape of the fluorescence induction curves. Figure 5 shows the fluorescence induction curve for the nitrogen-starved culture of Chlorella vulgaris, recorded immediately after the start of incubation (Fig. 5a), its decomposition into exponential components obtained by the method of multi-exponential approximation using the pyPhotoSyn package (Fig. 5b), and representation of this decomposition as a heat map column (Fig. 5c). Figure 5d shows a heat map illustrating dynamics of the changes in the contributions of exponential components over time.
The ability to analyze a large array of induction curves is very promising for further study of the dynamics of transient processes during mineral starvation and the action of other stress factors. Comparison with the results of the analysis using the JIP test, parallel additional measurements of the composition of the medium and cellular components (starch, lipids, carotenoids) will make it possible to correlate the phases of the induction curves with the physiological processes of the cell with greater certainty and use this information in future to conduct an express analysis of the changes in the state of the cell under stress.
DIRECT MULTIPARTICLE COMPUTER SIMULATION
Kinetic models built on the basis of mathematical apparatus of ordinary differential equations proceed from the assumption of a homogeneous distribution of the system components in space. In the kinetic models of processes in a photosynthetic membrane, it is assumed that the multienzyme complexes PSI, PSII, and cytochrome complexes interact with mobile carriers in accordance with the mass action law. Meanwhile, in the interior of the photosynthetic membrane, interaction of the proteins does not correspond to the concept of free diffusion and random collisions in terms of reactions in solutions. Total number of the mobile carriers per grain as well as the number of reaction centers with low mobility in the membrane are from tens to hundreds of molecules, which is much less than the amount required to implement the concepts of free collisions and the mass action law.
The results obtained by electron microscopy indicate dense arrangement of multienzyme complexes in the membrane, and the complexes protrude for a considerable distance into the luminal space [90-92]. This makes it impossible for free diffusion of PQ in the intramembrane space and limits movement of the molecules of the mobile Pc carrier in the lumen, which transfer electrons from the cytochrome complex to PSI. The same is true for diffusion in the stromal space, where Fd molecules are involved in the electron transport along a linear path and a cyclic path around the PSI.
To describe formation of the reaction complex of two interacting proteins in solution Brownian dynamics (BD) models are used to predict structure of the complex and estimate rate constant of its formation based on the mathematical apparatus of the Langevin equations, which describe translational and rotational motion of proteins under the action of random Brownian force and electrostatic interactions [93-95]. However, in the interior of a photosynthetic membrane, it is necessary to consider ensembles of tens to hundreds of interacting molecules.
To explicitly describe Brownian diffusion of mobile protein carriers both in solution and in the interior of a biological membrane, we developed direct multiparticle Brownian models. In these models, proteins in amounts of tens to hundreds of molecules per reaction volume can be mobile, like Fd and FNR in the thylakoid stroma, or one of the proteins can be mobile, like Pc in the thylakoid lumen, and the other can be part of a relatively immobile membrane-embedded multienzyme complex (Cyt f protein is a subunit of the cytochrome b6f complex). Fundamentals of the method and the obtained results are described in books [25, 26] and original papers [58, 96-107].
The direct multiparticle modeling method developed in our research group makes it possible to use advantages of the BD method, which takes into account the role of protein shape and electrostatic interactions in the electron transport processes, to study interaction of not the individual proteins, but their ensembles in the reaction volumes of complex shape. The model provides a clear three-dimensional visual representation of the dynamics of processes in the system at different spatial and temporal scales, ability to observe behavior of the individual components and obtain averaged statistical information over the entire ensemble. An example of the arrangements in the model of many-particle Brownian dynamics is shown in Fig. 6.
Fig. 6. Model of multiparticle Brownian dynamics. A section of photosynthetic membrane, in which the mobile Pc protein transfers an electron from Cyt f, a subunit of the cytochrome complex, to the donor part of PSI. Reprinted with permission from John Wiley and Sons from [98].
Protein molecules – electron carriers are subjected to Brownian motion in the medium and simultaneously experience electrostatic interactions with each other and with the charged surface of the photosynthetic membrane. As confirmed by the results of computational experiments, the process of electrostatic orientation significantly (by 1-2 orders of magnitude) increases the observed kinetic constant of the total reaction rate compared to the case when proteins collide at random places on their surfaces as a result of purely Brownian motion without preliminary electrostatic mutual orientation [104].
When approaching, the donor and acceptor molecules are able to form a protein–protein complex. A detailed description of the algorithm for modeling formation of the protein–protein complexes by the Brownian dynamics method is given in the original papers [103, 104]. Models of Brownian dynamics, in which protein molecules are considered as solid bodies, are able to describe formation of preliminary (encounter) complex. The initially formed complex may eventually transform into the final complex, or fall apart under the action of the Brownian force. Formation of the final reaction complex proceeds through a complex sequence of processes that ensure conformational correspondence of the donor and acceptor protein molecules. In the final complex, tunneling electron transfer between the reaction centers of the donor and acceptor proteins becomes possible. To describe conformational movements in such reaction complex, the methods of molecular dynamics should be applied, and to describe transfer of an electron from the reaction center of a donor molecule to the reaction center of an acceptor molecule inside the complex it is necessary to use the methods of quantum chemistry.
The role of electrostatic interactions in the formation of a redox complex of two proteins was studied in detail for a pair of photosynthetic electron carrier proteins, Pc and Cyt f [96, 104, 108]. These proteins are redox partners with clearly localized reaction centers – copper and iron atoms, respectively. Final configurations of the molecules in the group of the most frequently encountered trajectories of Brownian dynamics, leading to formation of the preliminary complex, were next used as initial ones for calculations of the subsequent intramolecular dynamics. At this stage, in the course of molecular dynamics calculations, formation of the final complex occurred (or did not occur), where the copper atom Pc and the iron atom Cyt f approached each other up to the distances at which the tunneling electron transfer occurs. Figure 7 shows the results of molecular dynamics calculations of the interaction between Pc and Cyt f from the green alga C. reinhardtii [108].
Fig. 7. Central structures of the first (a, I), second (b, I), and third (c, I) clusters of diffusion–collision complexes of plastocyanin and cytochrome f from the green algae C. reinhardtii with an electrostatic attraction energy of more than 8 kT. a, II, b, II, c, II) Distance between copper and iron atoms of plastocyanin and cytochrome f obtained based on molecular dynamics calculations with the initial central structure of the first (a, I), second (b, I), and third (c, I) clusters. a, III, b, III, c, III) Structures of the first (a, I), second (b, I), and third (c, I) final complexes obtained based on molecular dynamics calculations. Reprinted with permission from John Wiley and Sons from [108].
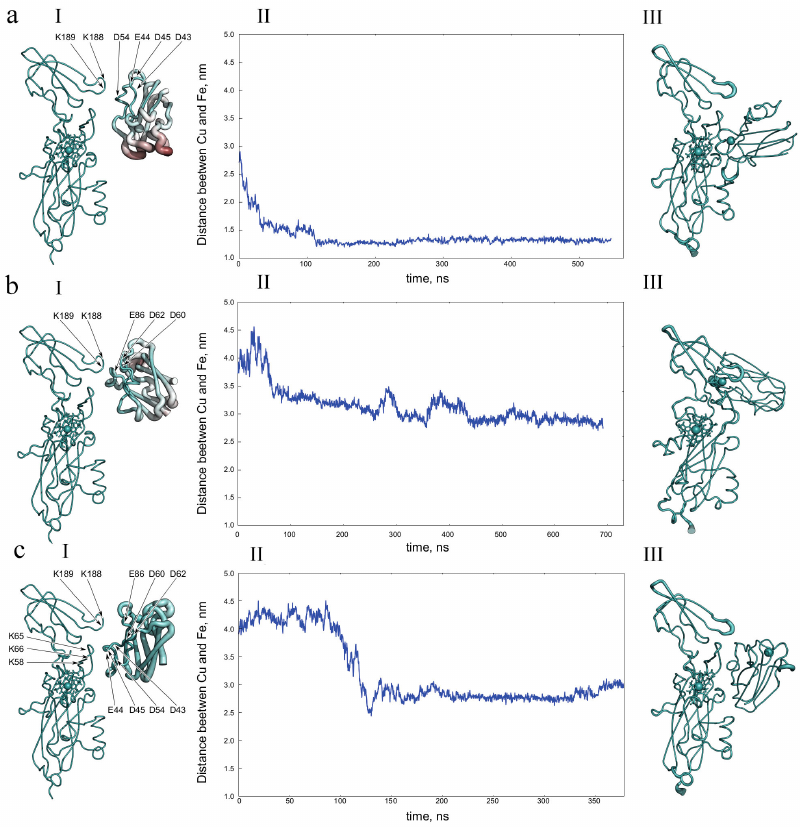
The ensemble of structures formed in the process of diffusion motion with an internal energy of 8 kT is divided into three clusters. The first cluster (35% of structures) is significantly different from the other two. Its structures have an electrostatic contact formed by the oppositely charged Pc (D43, E44, D45, and D54) and Cyt f (K188 and K189) regions. The Pc region that forms an electrostatic bond with Cyt f has low mobility relative to Cyt f, while the opposite side of the Pc molecule undergoes large fluctuations, as evidenced by the distribution of B-factor values shown in Fig. 7a, I.
The second cluster (25% of the structures) also has a one-point connection, but it is formed by other regions different from the first case (b, I). It is created by the positively charged loop (K188 and K189) of Cyt f and the negatively charged loop (D60, D62, and E86) of plastocyanin. In this orientation, rotational motion of the Pc molecule is not able to turn it into an orientation providing small enough distance for electron transfer between the cofactors. In the third ensemble (9% of structures), Pc is reversed relative to its orientation in the functionally active complex (c, I), and its movement is significantly limited by electrostatic interactions.
Further transformation of the central structures of these three ensembles was investigated by the method of molecular dynamics. The molecular dynamics calculations, in which proteins at the initial moment of time have a mutual orientation as in the central structure of the first cluster, demonstrate formation of a stable complex with a distance between cofactors of about 1.2 nm, which occurs in the first 150 ns (Fig. 7a, II). Note that this final complex is similar to the final complex formed by the central structure of the “productive” cluster of higher plants [108]. Molecular dynamics calculations with the central structures of the second (Fig. 7b, III) and third (Fig. 7c, III) clusters led to formation of the stable complexes with relatively large distances (about 3 nm) between the protein cofactors. Based on the molecular dynamics calculations, it can be concluded that the structures of the second and third clusters cannot easily achieve orientation with the distance of less than 2.5 nm between the cofactors, which is necessary for electron tunneling. Thus, only the first cluster is potentially productive (Fig. 7a).
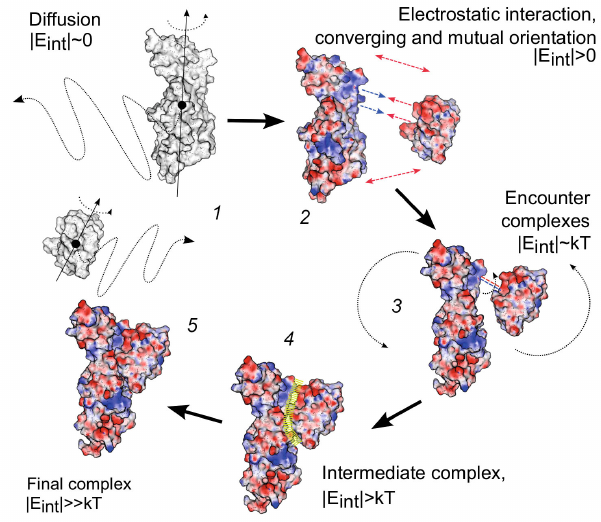
General sequence of the steps in the process of formation of the electron transport complex of proteins Pc and Cyt f from higher plants and green microalgae is shown in the diagram in Fig. 8.
Fig. 8. Scheme of protein–protein complex formation for electron transport proteins plastocyanin and cytochrome f from higher plants and green microalgae. (1) Free diffusion of molecules; (2) mutual orientation due to electrostatic interactions; (3) formation of energetically favorable conformations; (4) transformation of the diffusion–collision complex into a metastable energetically favorable state; (5) formation of the final complex (functionally active configuration) through conformational changes within the protein–protein interface. Protein surfaces are colored according to their surface potential in the range from –100 to +100 mV. Reprinted with permission from John Wiley and Sons from [108].
CONCLUSIONS
General goal of the dynamic modeling of complex systems is to reveal patterns of their behavior in time and time-dependent changes of the quantitative characteristics of interacting components. The key condition for the model adequacy to a real object is correspondence between the structure of the model and the real system, as well as correspondence of the equations, mechanisms, and parameters of the interaction of its constituent elements. The mathematical apparatus used must correspond to the specific mechanisms of component interactions, such as free collision according to the mass action law, diffusion displacements in a viscous medium, intramolecular cooperative transitions in macromolecular complexes. All this can be adequately reflected in the model only on the basis of independent experimental or observational data.
With deepening of our knowledge about the structure of photosynthetic apparatus, the arsenal of applied mathematical methods has changed and continues to change. This is the reason of transition from the ordinary system of differential equations describing kinetics in a homogeneous medium to equations in which, along with chemical reactions, diffusion of substances in a heterogeneous reaction space is also taken into consideration.
Modern powerful computers allow adequate simulation of the processes occurring simultaneously in millions of chains of active proteins that interact with each other. In individual compartments of the cell, where relatively small ensembles of molecules interact, the method of direct multiparticle modeling demonstrates its effectiveness. Apparently, to elucidate the mechanisms of cellular processes different methods are useful, both models based on differential equations, detailed and simplified, allowing a qualitative study, and algorithmic stochastic Monte Carlo models, as well as agent-based multiparticle modeling methods that reproduce the movements and interactions of individual mobile macromolecules in cells.
Computer reproduction of the Brownian diffusion approach of proteins is based on taking into account the action of random shocks experienced by protein molecules from the nearest environment. The effect of electrostatic interactions provides a significant correction to the “randomness” of the occurring collisions of the proteins, causing their beneficial mutual orientation. This actually means the presence of a factor of long-range interactions, which gives a “vector” character to the purely random paths of proteins. It can be assumed that this does not exhaust “vectorization” of the Brownian motion in a cell and that the existence of other long-range factors of interactions in a cell is possible. For example, the question of what contribution to the selection of random shocks can be made by the shape of a protein globule in relation to the emergence of predominant resulting direction of its Brownian motion is legitimate. This may indicate possible existence of the features of elementary interactions of structural elements in a living system, hidden from us so far, which have been identified and “expediently” used in biology over millions of years of evolution at the lower structural levels of organization of living systems.
This issue of Biochemistry (Moscow) journal is dedicated to the memory of Vladimir Shuvalov, the Full Member of the Russian Academy of Sciences, a world-renowned authority in the field of photobiology and primary processes of photosynthesis. The experimental data obtained by him by the method of laser spectroscopy made it possible to understand the nature of ultrafast processes occurring in the femtosecond time range in the photosynthetic apparatus, which have a directed nature and biological meaning. Taking into account these data will undoubtedly play an important role in modeling the whole set of the energy transformation processes over a wide range of times, including primary femtosecond processes.
Contributions. G. Yu. Riznichenko, A. B. Rubin – conception and work management; N. E. Belyaeva, I. B. Kovalenko, T. K. Antal, S. N. Goryachev, A. S. Maslakov, T. Yu. Plyusnina, V. A. Fedorov, S. S. Khruschev, O. V. Yakovleva – research; G. Yu. Riznichenko – writing the text.
Funding. The work was financially supported by the State Budget Projects of Moscow State University (nos. 16-116021660040-7, 121032500060-0). The work was partially funded by the Russian Foundation for Basic Research (grant no. 20-04-00465) and by the Russian Science Foundation (grants nos. 20-64-46018 and 22-11-00009).
Acknowledgments. The authors express their gratitude to the staff and graduate students of the Department of Biophysics, whose long-term joint work made it possible to obtain the results presented in this article.
We are grateful to the Russian Foundation for Basic Research for many years of support for research on photosynthesis.
The research was carried out using the equipment of the shared research facilities of HPC computing resources at Lomonosov Moscow State University.
Ethics declarations. The authors declare no conflict of interest in financial or any other sphere. This article does not contain any studies with human participants or animals performed by any of the authors.
Additional information. Detailed materials on kinetic models of primary photosynthetic processes and associated processes can be provided upon request by the co-author of this review, Natalya E. Belyaeva, e-mail: natalmurav@yandex.ru. Detailed description of the stochastic model algorithm is given in the original article by the author of the code Alexey S. Maslakov [72], co-author of this review. Additional details can be provided upon request, e-mail: alexei.maslakov@gmail.com. ProKSim software for Brownian Dynamics simulation of protein–protein interactions can be provided upon request by the author Sergei S. Khruschev, e-mail: styx@biophys.msu.ru. Cyt f–Pc protein–protein complexes obtained by molecular dynamics methods for green plants, green algae, and cyananobacteria can be provided upon request by the co-author of this review, Vladimir A. Fedorov, e-mail: xbgth@yandex.ru.
REFERENCES
1.Amesz, J. (1987) Photosynthesis,
Elsevier.
2.Rabinowitch, E., and Govindjee (1969)
Photosynthesis, Wiley, NY.
3.Hall, D. O., and Rao, K. (1999)
Photosynthesis, Cambridge University Press, Cambridge.
4.Ke, B. (2006) Photosynthesis: Photobiochemistry
and Photobiophysics, Springer Science & Business Media.
5.Nelson, N., and Yocum, C. F. (2006) Structure and
function of photosystems I and II, Annu. Rev. Plant. Biol.,
57, 521-565, doi: 10.1146/annurev.arplant.57.032905.105350.
6.Barber, J. (2015) The Photosystems: Structure,
Function and Molecular Biology, Elsevier.
7.Barber, J., and Ruban, A. V. (2017)
Photosynthesis and Bioenergetics, World Scientific.
8.Rubin A.B. (2017) Compendium of Biophysics,
Wiley & Sons, USA.
9.Shevela, D., Bjorn, L., and Govindjee (2019)
Photosynthesis: Solar Energy for Life, World Scientific,
Singapore, doi: 10.1142/10522.
10.Stirbet, A., Lazar, D., Guo, Y., and Govindjee
(2020) Photosynthesis: basics, history and modelling, Ann. Bot.,
126, 511-537, doi: 10.1093/aob/mcz171.
11.Ruban, A. V. (2012) The Photosynthetic
Membrane: Molecular Mechanisms and Biophysics of Light Harvesting,
Wiley, doi: 10.1007/s11120-014-0015-7.
12.Kouřil, R., Oostergetel, G. T., and
Boekema, E. J. (2011) Fine structure of granal thylakoid membrane
organization using cryo electron tomography, Biochim. Biophys. Acta
Bioenerg., 1807, 368-374, doi:
10.1016/j.bbabio.2010.11.007.
13.Koochak, H., Puthiyaveetil, S., Mullendore, D.
L., Li, M., and Kirchhoff, H. (2019) The structural and functional
domains of plant thylakoid membranes, Plant J., 97,
412-429, doi: 10.1111/tpj.14127.
14.Rantala, M, Rantala, S., and Aro, E.-M. (2020)
Composition, phosphorylation and dynamic organization of photosynthetic
protein complexes in plant thylakoid membrane, Photochem. Photobiol.
Sci., 19, 604-619, doi: 10.1039/D0PP00025F.
15.Holzapfel, C., and Bauer, R. (1975) Computer
simulation of primary photosynthetic reactions compared with
experimental results on O2-exchange and chlorophyll
fluorescence of green plants, Z. Naturforsch., 30,
489-498, doi: 10.1515/znc-1975-7-812.
16.Kukushkin, A. K., Tikhonov, A. N., Blumenfeld, L.
A., and Ruuge, E. K. (1973) Theoretical analysis of primary
photosynthetic processes in higher plants and algae [in Russian],
Doklady Akademii Nauk SSSR, 211, 718-721.
17.Malkin, S. (1971) Fluorescence induction studies
in isolated chloroplast. On the electron-transfer equilibrium in the
pool of electron acceptors of photosystem II, Biochim. Biophys.
Acta, 234, 425-427, doi: 10.1016/0005-2728(71)90208-8.
18.Sorokin, E. M. (1973) Non-cyclic electron
transport and connected processes [in Russian], Soviet Plant
Physiol., 20, 733-741.
19.Rubin, A. B., and Shinkarev, V. P. (1984)
Electron transport in biological systems [in Russian], Nauka,
Moscow.
20.Riznichenko, G. Yu., Vorobjeva, T. N., Khrabrova,
E. N., and Rubin, A. B. (1986) Comparative analysis of the kinetic and
conformational characteristics of solubilized and embedded into
liposomes pigment-protein complexes of higher plant Photosystem 1 [in
Russian], Biophysics, 31, 793-799.
21.Riznichenko, G. Yu., Chrabrova, E. N., and Rubin,
A. B. (1988) Identification of the parameters of photosynthetic
electron transport system, Studia Biophys., 126,
51-59.
22.Rubin, A. B., and Riznichenko, G. Yu.
(2009) Modeling of the primary processes in a photosynthetic membrane,
in Photosynthesis in silico: understanding complexity from molecules
to ecosystems (Laisk, A., Nedbal, L., and Govindjee, eds) Springer,
Dordrecht, 29, 151-176, doi: 10.1134/S000635091603009X.
23.Riznichenko, G. Yu., Vorobjeva, T. N., Khrabrova,
E. N., and Rubin, A. B. (1990) Identification of kinetic
parameters of plastocyanin and P-700 interactions in chloroplasts and
pigment–protein complexes of photosystem 1,
Photosynthetica, 24, 495-501.
24.Riznichenko, G. Yu. (1991) Mathematical models of
primary photosynthetic processes [in Russian], Usp. Nauk Tekh, Ser.
Biofizika, VINITI, Moscow, 31.
25.Riznichenko, G. Yu., and Rubin, A. B. (2020)
Dynamic models of electron transport in photosynthesis [in
Russian], IKI, Izhevsk.
26.Rubin, A. B., and Riznichenko, G. Yu. (2014)
Mathematical Biophysics, Springer, N.Y., doi:
10.1007/978-1-4614-8702-9.
27.Schatz, G. H., Brock, H., and Holzwarth, A. R.
(1988) Kinetic and energetic model for the primary processes in
photosystem II, Biophys. J., 54, 397-405, doi:
10.1016/S0006-3495(88)82973-4.
28.Roelofs, T. A., Lee, C.-H., and Holzwarth, A.
R. (1992) Global target analysis of picosecond chlorophyll
fluorescence kinetics from pea chloroplasts: a new approach to the
characterization of the primary processes in photosystem II α-
and β-units, Biophys. J., 61, 1147-1163, doi:
10.1016/S0006-3495(92)81924-0.
29.Baake, E., and Shloeder, J. P. (1992) Modelling
the fast fluorescence rise of photosynthesis, Bull. Math. Biol.,
54, 999-1021, doi: 10.1007/BF02460663.
30.Bouges-Bocquet, B. (1973) Electron transfer
between two photosystems in spinach chloroplasts, Biochim. Biophys.
Acta, 31, 250-256, doi: 10.1016/0005-2728(73)90140-0.
31.Velthuys, B. R., and Amesz, J. (1974) Charge
accumulation at the reducing side of Photosystem 2 of photosynthesis,
Biochim. Biophys. Acta, 333, 85-94, doi:
10.1016/0005-2728(74)90165-0.
32.Stirbet, A., Govindjee, Strasser, B. J., and
Strasser, R. J. (1998) Chlorophyll a fluorescence induction in
higher plants: modelling and numerical simulation, J. Theor.
Biol., 193, 131-151, doi: 10.1006/jtbi.1998.0692.
33.Stirbet, A., and Govindjee (2012) Chlorophyll
a fluorescence induction: a personal perspective of the thermal
phase, the J–I–P rise, Photosynth. Res., 113,
15-61, doi: 10.1007/s11120-012-9754-5.
34.Stirbet, A., and Govindjee (2016) The slow phase
of chlorophyll a fluorescence induction in silico: origin of the
S–M fluorescence rise, Photosynth. Res., 130,
193-213, doi: 10.1007/s11120-016-0243-0.
35.Vredenberg, W. J. (2000) A 3-state model for
energy trapping and fluorescence in PS II incorporating radical pair
recombination, Biophys. J., 79, 26-38, doi:
10.1016/S0006-3495(00)76271-0.
36.Lazár, D. (2003) Chlorophyll a
fluorescence rise induced by high light illumination of dark adapted
plant tissue studied by means of a model of photosystem II and
considering photosystem II heterogeneity, J. Theor. Biol.,
220, 469-503, doi: 10.1006/JTBI.2003.3140.
37.Lazár, D. (2009) Modelling of
light-induced chlorophyll a fluorescence rise
(O–J–I–P transient) and changes in 820
nm-transmittance signal of photosynthesis, Photosynthetica,
47, 483-498, doi: 10.1007/s11099-009-0074-8.
38.Lazár, D. (2013) Simulations show that a
small part of variable chlorophyll a fluorescence originates in
photosystem I and contributes to overall fluorescence rise, J.
Theor. Biol., 335, 249-264, doi: 10.1016/j.jtbi.2013.06.028.
39.Belyaeva, N. E., Bulychev, A. A., Riznichenko, G.
Yu., and Rubin, A. B. (2016) Thylakoid membrane model of the Chl
a fluorescence transient and P700 induction kinetics in plant
leaves, Photosynth. Res., 130, 491-515, doi:
10.1007/s11120-016-0289-z.
40.Belyaeva, N. E., Bulychev, A. A., Riznichenko, G.
Yu., and Rubin, A. B. (2019) Analyzing both the fast and the
slow phases of chlorophyll a fluorescence and P700 absorbance
changes in dark-adapted and preilluminated pea leaves using a Thylakoid
Membrane model, Photosynth. Res., 140, 1-19, doi:
10.1007/s11120-019-00627-8.
41.Belyaeva, N. E., Bulychev, A. A., Klementiev, K.
E., Paschenko, V. Z., Riznichenko, G. Yu., et al. (2020) Model
quantification of the light-induced thylakoid membrane processes in
Synechocystis sp. PCC 6803 in vivo and after exposure to
radioactive irradiation, Photosynth. Res., 146, 259-278,
doi: 10.1007/s11120-020-00774-3.
42.Ebenhoh, O., Fucile, G., Finazzi, G. G., Rochaix,
J.-D., and Goldschmidt-Clermont, M. (2014) Short-term acclimation of
the photosynthetic electron transfer chain to changing light: a
mathematical model, Philos. Trans. R. Soc. Lond. B Biol. Sci.,
369, 20130223, doi: 10.1098/rstb.2013.0223.
43.Matuszyńska, A., Heidari, S., Jahns, P.,
and Ebenhoh, O. (2016) A mathematical model of non-photochemical
quenching to study short-term light memory in plants, Biochim.
Biophys. Acta, 1857, 1860-1869, doi:
10.1016/j.bbabio.2016.09.003.
44.Feng, S., Fu, L., Xia, Q., Tan, J., Jiang, Y.,
and Guo, Y. (2018) Modelling and simulation of photosystem II
chlorophyll fluorescence transition from dark-adapted state to
light-adapted state, IET Syst. Biol., 12, 289-293, doi:
10.1049/iet-syb.2018.5003.
45.Laisk, A., Nedbal, L., and Govindjee (2009)
Photosynthesis in silico: understanding complexity from
molecules to ecosystems, in Advances in Photosynthesis and
Respiration (Govindjee, and Sharkey, T. D., eds) Springer,
Dordrecht, 29, doi: 10.1093/aob/mcq022.
46.Zhu, X. G., Wang, Y., Ort, D. R., and Long, S. P.
(2013) e-Photosynthesis: a comprehensive dynamic mechanistic model of
C3 photosynthesis: from light capture to sucrose synthesis, Plant
Cell Environ., 36, 1711-1727, doi: 10.1111/pce.12025.
47.Vershubskii, A. V., Nevyantsev, S. M., and
Tikhonov, A. N. (2018) Modeling of electron and proton transport in
chloroplast membranes with regard to thioredoxin-dependent activation
of the Calvin–Benson cycle and ATP synthase, Biochemistry
(Moscow), Suppl. Ser. A Membr. Cell Biol., 12, 287-302, doi:
10.1134/S1990747818020150.
48.Vershubskii, A. V., and Tikhonov, A. N. (2020)
pH-Dependent regulation of electron and proton transport in
chloroplasts in situ and in silico, Biochemistry
(Moscow), Suppl. Ser. A Membr. Cell Biol., 14, 154-165, doi:
10.1007/s11120-013-9845-y.
49.Saadat, N. P., Nies, T., van Aalst, M., Hank, B.,
Demirtas, B., et al. (2021) Computational analysis of alternative
photosynthetic electron flows linked with oxidative stress, Front.
Plant Sci., 12, 750580, doi: 10.3389/fpls.2021.750580.
50.Stirbet, A., Riznichenko, G. Yu., Rubin, A. B.,
and Govindjee (2014) Modeling chlorophyll a fluorescence
transient: relation to photosynthesis, Biochemistry (Moscow),
79, 291-323, doi: 10.1134/S0006297914040014.
51.Riznichenko, G. Yu., Lebedeva, G. V., Demin, O.
V., and Rubin, A. B. (1999) Kinetic mechanisms of biological regulation
in photosynthetic organisms, J. Biol. Phys., 25, 177-192,
doi: 10.1023/A:100510170318.
52.Lebedeva, G. V., Belyaeva, N. E., Riznichenko, G.
Yu., Rubin, A. B., and Demin, O. V. (2000) Kinetic model of photosystem
II of higher green plants [in Russian], Russ. J. Phys. Chem B,
74, 1702-1710.
53.Lebedeva, G. V., Belyaeva, N. E., Demin, O. V.,
Riznichenko, G. Yu., and Rubin, A. B. (2002) Kinetic model of primary
processes of photosynthesis in chloroplasts. Fast phase of chlorophyll
fluorescence induction under light of various intensity [in Russian],
Biophysics, 47, 968-980.
54.Belyaeva, N. E., Schmitt, F.-J., Steffen, R.,
Paschenko, V. Z., Riznichenko, G. Yu., et al. (2008) PSII model-based
simulations of single turnover flash-induced transients of fluorescence
yield monitored within the time domain of 100 ns-10 s on dark-adapted
Chlorella pyrenoidosa cells, Photosyn. Res., 9,
105-119, doi: 10.1007/s11120-008-9374-2.
55.Belyaeva, N. E., Schmitt, F.-J., Paschenko, V.
Z., Riznichenko, G. Yu., Rubin, A. B., et al. (2011) PS II model based
analysis of transient fluorescence yield measured on whole leaves of
Arabidopsis thaliana after excitation with light flashes of different
energies, BioSystems, 103, 188-195, doi:
10.1016/j.biosystems.2010.09.014.
56.Schansker, G., Tóth, S. Z., Kovács,
L., Holzwarth, A. R., and Garab, G. (2011) Evidence for a fluorescence
yield change driven by a light-induced conformational change within
photosystem II during the fast chlorophyll a fluorescence rise,
Biochim. Biophys. Acta Bioenerg., 1807, 1032-1043, doi:
10.1016/j.bbabio.2011.05.022.
57.Magyar, M., Sipka, G., Kovács, L., Ughy,
B., Zhu, Q., et al. (2018) Rate-limiting steps in the dark-to-light
transition of Photosystem II – revealed by chlorophyll-a
fluorescence induction, Sci. Rep., 8, 2755, doi:
10.1038/s41598-018-21195-2.
58.Ustinin, D. M., Kovalenko, I. B., Riznichenko, G.
Yu., and Rubin, A. B. (2013) Combination of different simulation
techniques in the complex model of photosynthetic membrane [in
Russian], Comput. Res. Model., 5, 65-81, doi:
10.20537/2076-7633-2013-5-1-65-81.
59.Duysens, L. N. M., and Sweers, H. E. (1963)
Mechanism of two photochemical reactions in algae as studied by means
of fluorescence, Photosynth. Bacteria, 372, 353-372.
60.Zhu, X.-G., Govindjee, Baker, N. R., deSturler,
E., Ort, D. R., et al. (2005) Chlorophyll a fluorescence
induction kinetics in leaves predicted from a model describing each
discrete set of excitation energy and electron transfer associated with
photosystem II, Planta, 223, 114-133, doi:
10.1007/s00425-005-0064-4.
61.Xin, C.-P., Yang, J., and Zhu, X.-G. (2013) A
model of chlorophyll a fluorescence induction kinetics with
explicit description of structural constraints of individual
photosystem II units, Photosynth. Res., 117, 339-354,
doi: 10.1007/s11120-013-9894-2.
62.Belyaeva, N. E., Schmitt, F.-J., Paschenko, V.
Z., Riznichenko, G. Yu., Rubin, A. B., et al. (2014) Model based
analysis of transient fluorescence yield induced by actinic laser
flashes in spinach leaves and cells of green algae Chlorella
pyrenoidosa Chick, Plant Physiol. Biochem., 77,
49-59, doi: 10.1016/j.plaphy.2014.01.017.
63.Belyaeva, N. E., Schmitt, F.-J., Paschenko, V.
Z., Riznichenko, G. Yu., and Rubin, A. B. (2015) Modelling of the redox
state dynamics in photosystem II of Chlorella pyrenoidosa Chick
cells and leaves of spinach and Arabidopsis thaliana from single
flash induced fluorescence quantum yield changes on the 100 ns-10 s
time scale, Photosynth. Res., 125, 123-140, doi:
10.1007/s11120-015-0163-4.
64.Belyaeva, N. E., Bulychev, A. A., Pashchenko, V.
Z., Klementev, K. E., Ermachenko, P. A., et al. (2022) Dynamics of
processes in algal thylakoid membranes in vivo studied in
Photosystem II and thylakoid models by measurements of fluorescence
induction, Biophysics, in press.
65.Antal, T. K., Kovalenko, I. B., Rubin, A. B., and
Tyystjärvi, E. (2013) Photosynthesis-related quantities for
education and modeling, Photosynth. Res., 117, 1-30, doi:
10.1007/s11120-013-9945-8.
66.Matuszyńska, A., Saadat, N.P., and
Ebenhoh, O. (2019) Balancing energy supply during photosynthesis
– a theoretical perspective, Physiol. Plant., 166,
392-402, doi: 10.1111/ppl.12962.
67.Snellenburg, J., Johnson, M. P., Ruban, A. V.,
van Grondelle, R., and van Stokkum, I. H. M. (2017) A four state
parametric model for the kinetics of the non-photochemical quenching in
Photosystem II, Biochim. Biophys. Acta, 1858, 854-864,
doi: 10.1016/j.bbabio.2017.08.004.
68.Morales, A., Yin, X., Harbinson, J., Driever, S.
M., Molenaar, J., et al. (2018) In silico analysis of the
regulation of the photosynthetic electron transport chain in C3 plants,
Plant Physiol., 176, 1247-1261, doi:
10.1104/pp.17.00779.
69.Mathur, S., Sunoj, V., Elsheery, N., Jajoo, A.,
and Cao, K.-F. (2021) Regulation of Photosystem II heterogeneity and
photochemistry in two cultivars of C4 crop sugarcane under chilling
stress, Front. Plant Sci., 12, 627012, doi:
10.3389/fpls.2021.627012.
70.Antal, T. K., Maslakov, A. S., Yakovleva, O. V.,
Krendeleva, T. E., Riznichenko, G. Yu., et al. (2018) Simulation of
chlorophyll fluorescence rise and decay kinetics, and P700-related
absorbance changes by using a rule-based kinetic Monte-Carlo method,
Photosyn. Res., 138, 191-206, doi:
10.1007/s11120-018-0564-2.
71.Suslichenko, I. S., Trubitsin, B. V.,
Vershubskii, A. V., and Tikhonov, A. N. (2022) The noninvasive
monitoring of the redox status of photosynthetic electron transport
chains in Hibiscus rosa-sinensis and Tradescantia leaves,
Plant Physiol. Biochem., 185, 233-243, doi:
10.1016/j.plaphy.2022.06.002.
72.Maslakov, A. S. (2020) Describing processes in
photosynthetic reaction center ensembles using a Monte Carlo kinetic
model [in Russian], Comput. Res. Model., 12, 1207-1221,
doi: 10.20537/2076-7633-2020-12-5-1207-1221.
73.Antal, T. K., Kolacheva, A., Maslakov, A.,
Riznichenko, G. Yu., Krendeleva, T. E., et al. (2013) Study of the
effect of reducing conditions on the initial chlorophyll fluorescence
rise in the green microalgae Chlamydomonas reinhardtii,
Photosynth. Res., 114, 143-215, doi:
10.1007/s11120-012-9789-7.
74.Joliot, P., and Joliot, A. (1981)
Characterization of photosystem II centers by polarographic,
spectroscopic and fluorescence methods. In Photosynthesis III
(Akoyunoglou, G., ed.) Balaban International Science Services,
Philadelphia, pp. 885-899.
75.Guo, Y., and Tan, J. (2014) Kinetic Monte-Carlo
simulation of the initial phases of chlorophyll fluorescence from
photosystem II, BioSystems, 115, 1-4, doi:
10.1016/j.biosystems.2013.10.004.
76.Ruban, A., Foyer, C., and Murchie, E. (2022)
Photosynthesis in Action: Harvesting Light, Generating Electrons,
Fixing Carbon, Academic Press.
77.Staehelin, L. A., and Paolillo, D. J. (2020) A
brief history of how microscopic studies led to the elucidation of the
3D architecture and macromolecular organization of higher plant
thylakoids, Photosynth. Res., 145, 237-258, doi:
10.1007/s11120-020-00782-3.
78.Pospíšil, P., and Dau, H. (2002)
Valinomycin sensitivity proves that light induced thylakoid voltages
result in millisecond phase of chlorophyll fluorescence transients,
Biochim. Biophys. Acta, 1554, 94-100, doi:
10.1016/s0005-2728(02)00216-5.
79.Boisvert, S., Joly, D., and Carpentier, R. (2006)
Quantitative analysis of the experimental O-I-J-P kinetic fluorescence
induction kinetics. Apparent activation energy and origin of each
kinetic step, FEBS J., 273, 4770-4777, doi:
10.1111/j.1742-4658.2006.05475.x.
80.Vredenberg, W. J. (2008) Algorithm for analysis
of OJDIP fluorescence induction curves in terms of photo-and
electrochemical events in photosystems of plant cells: derivation and
application, J. Photochem. Photobiol. B, 91, 58-65, doi:
10.1016/j.jphotobiol.2008.01.005.
81.Vredenberg, W., and Prasil, O. (2009) Modeling of
chlorophyll a fluorescence kinetics, in Photosynthesis in
silico: Understanding Complexity from Molecules to Ecosystems
(Laisk, A., Nedbal, L., and Govindjee, eds) Dordrecht, Springer,
29, 125-149, doi: 10.1007/978-1-4020-9237-4_6.
82.Strasser, B. J., and Strasser, R. J. (1995)
Measuring fast fluorescence transients to address environmental
questions: The JIP test, in Photosynthesis: From Light to
Biosphere (Mathis, P., ed.), Kluwer Academic, The Netherlands,
5, 977-980, doi: 10.1007/978-94-009-0173-5_1142.
83.Solovchenko, A., Aflalo, C., Lukyanov, A., and
Boussiba, S. (2013) Nondestructive monitoring of carotenogenesis in
Haematococcus pluvialis via wholecell optical density spectra,
Appl. Microbiol. Biotechnol., 97, 4533-4541, doi:
10.1007/s00253-012-4677-9.
84.Plyusnina, T. Yu., Khruschev, S. S., Frolov, A.
E., Riznichenko, G. Yu., and Rubin, A. B. (2019) Monitoring of the
photosynthetic activity of the microalgae Chlorella under
nitrogen depletion conditions, Biophysics, 64, 358-366,
doi: 10.1134/S0006350919030175.
85.Kalaji, H. M., Oukarroum, A., Alexandrov, V.,
Kouzmanova, M., Brestic, M., et al. (2014) Identification of nutrient
deficiency in maize and tomato plants by in vivo
chlorophyll a fluorescence measurements, Plant Physiol.
Biochem., 81, 16-25, doi: 10.1016/j.plaphy.2014.03.029.
86.Stirbet, A., Lazar, D., Kromdijk, J., and
Govindjee (2018) Chlorophyll a fluorescence induction: can just
a one-second measurement be used to quantify abiotic stress responses?
Photosynthetica, 56, 86-104, doi:
10.1007/s11099-018-0770-3.
87.Plyusnina, T. Yu., Khruschev, S. S., Riznichenko,
G. Yu., and Rubin, A. B. (2015) An analysis of the chlorophyll
fluorescence transient by spectral multi-exponential approximation,
Biophysics, 60, 392-399, doi:
10.1134/S000635091503015X.
88.Antal, T., Konyukhov, I., Volgusheva, A.,
Plyusnina, T., Khruschev, S., et al. (2019) Chlorophyll fluorescence
induction and relaxation system for the continuous monitoring of
photosynthetic capacity in photobioreactiors, Physiol. Plant.,
165, 476-486, doi: 10.1111/ppl.12693.
89.Plyusnina, T., Khruschev, S., Degtereva, N.,
Konyukhov, I., Solovchenko, A., et al. (2020) Gradual changes in the
photosynthetic apparatus triggered by nitrogen depletion during
microalgae cultivation in photobioreactor, Photosynthetica,
58, 443-451, doi: 10.32615/ps.2020.002.
90.Kirchhoff, H., Mukherjee, U., and Galla, H. J.
(2002) Molecular architecture of the thylakoid membrane: lipid
diffusion space for plastoquinone, Biochemistry, 41,
4872-4882, doi: 10.1021/bi011650y.
91.Albertsson, P.-A. (2001) A quantitative model of
the domain structure of the photosynthetic membrane, Trends Plant.
Sci., 6, 349-354, doi: 10.1016/s1360-1385(01)02021-0.
92.McKenzie, S. D., Ibrahim, I. M., Aryal, U. K.,
and Puthiyaveetil, E. (2020) Stoichiometry of protein complexes in
plant photosynthetic membranes, Biochim. Biophys. Acta
Bioenergetics, 1861, 148141, doi:
10.1016/j.bbabio.2019.148141.
93.Pearson Jr., D. C., and Gross, E. L. (1998)
Brownian dynamics study of the interaction between plastocyanin and
cytochrome f, Biophys. J., 75, 2698-2711, doi:
10.1016/S0006-3495(98)77714-8.
94.Gross, E. L., and Rosenberg, I. (2006) A Brownian
dynamics study of the interaction of Phormidium cytochrome
f with various cyanobacterial plastocyanins, Biophys. J.,
90, 366-380, doi: 10.1529/biophysj.105.065185.
95.Khruschev, S. S., Abaturova, A. M., Fedorov, V.
A., Ustinin, D. M., Kovalenko, I. B., et al. (2015)
Brownian–dynamics simulations of protein–protein
interactions in the photosynthetic electron transport chain,
Biophysics, 60, 212-231, doi:
10.1016/S0006-3495(03)74633-5.
96.Kovalenko, I. B., Abaturova, A. M., Gromov, P.
A., Ustinin, D. M., Grachev, E. A., et al. (2006) Direct simulation of
plastocyanin and cytochrome f interactions in solution, Phys.
Biol., 3, 121-129, doi: 10.1088/1478-3975/3/2/004.
97.Kovalenko, I. B., Diakonova, A. N., Abaturova, A.
M., Riznichenko, G. Yu., and Rubin, A. B. (2010) Direct computer
simulation of ferredoxin and FNR complex formation in solution,
Phys. Biol., 7, 026001, doi:
10/1088/1478-3975/7/2/026001.
98.Kovalenko, I. B., Diakonova, A. N., Riznichenko,
G. Yu., and Rubin, A. B. (2011) Computer simulation of interaction of
photosystem 1 with plastocyanin and ferredoxin, BioSystems.,
103, 180-187, doi: 10.1016/j.biosystems.2010.09.013.
99.Kovalenko, I. B., Knyaseva, O. S., Antal, T. K.,
Ponomarev, V., Riznichenko, G. Yu., et al. (2017) Multiparticle
Brownian dynamics simulation of experimental kinetics of cytochrome
bf oxidation and photosystem 1 reduction by plastocyanin,
Physiol. Plant., 161, 88-96, doi: 10.1111/ppl.12570.
100.Knyazeva, O. S., Kovalenko, I. B., Abaturova,
A. M., Riznichenko, G. Yu., Grachev, E. A., et al. (2010) Multiparticle
computer simulation of plastocyanin diffusion and interaction with
cytochrome f in the electrostatic field of the thylakoid membrane,
Biophysics, 55, 221-227, doi:
10.1134/S0006350910020090.
101.Riznichenko, G. Yu., Kovalenko, I. B.,
Abaturova, A. M., Diakonova, A. N., Ustinin, D. M., et al. (2010) New
direct dynamic models of protein interactions coupled to photosynthetic
electron transport reactions, Biophys. Rev., 2, 101-110,
doi: 10.1007/s12551-010-0033-4.
102.Riznichenko, G. Yu., and Kovalenko, I. B.
(2019) Multiparticle models of Brownian dynamics for the description of
photosynthetic electron transfer involving protein mobile carriers,
Int. J. Appl. Res. Bioinform., 9, 1-19, doi:
10.4018/IJARB.2019010101.
103.Khruschev, S. S., Abaturova, A. M., Diakonova,
A. N., Ustinin, D. M., Zlenko, D. V., et al. (2013) Multi-particle
Brownian Dynamics software ProKSim for protein-protein
interactions modeling [in Russian], Comput. Res. Model.,
5, 47-64, doi: 10.20537/2076-7633-2013-5-1-47-64.
104.Khruschev, S. S., Abaturova, A. M., Fedorov, V.
A., Kovalenko, I. B., Riznichenko, G. Yu., et al. (2015) The
identification of intermediate states of the electron transfer proteins
plastocyanin and cytochrome f diffusional encounters,
Biophysics, 60, 513-521, doi:
10.1134/S0006350915040156.
105.Diakonova, A. N., Khrushchev, S. S., Kovalenko,
I. B., Riznichenko, G. Yu., and Rubin, A. B. (2016) Influence of pH and
ionic strength on electrostatic properties of ferredoxin, FNR, and
hydrogenase and the rate constants of their interaction, Phys.
Biol., 13, 056004, doi: 10.1088/1478-3975/13/5/056004.
106.Diakonova, A. N., Khruschev, S. S., Kovalenko,
I. B., Riznichenko, G. Yu., and Rubin, A. B. (2016) The role of
electrostatic interactions in the formation of
ferredoxin–ferredoxin NADP+ reductase and
ferredoxin–hydrogenase complexes, Biophysics, 61,
572-579, doi: 10.1134/S0006350916040060.
107.Riznichenko, G. Yu., Plyusnina, T. Yu.,
Diakonova, A. N., Kovalenko, I. B., Khruschev, S. S., et al. (2017) pH
regulation of hydrogen–generating microalgae photosynthetic
chain. Kinetic and multiparticle Brownian models, Nonlinearity:
Problems, Solutions and Applications, Science Publishers, Inc.,
United States, pp. 181-202.
108.Fedorov, V. A., Kovalenko, I. B., Khruschev, S.
S., Ustinin, D. M., Antal, T. K., et al. (2019) Comparative analysis of
plastocyanin–cytochrome f complex formation in higher
plants, green algae and cyanobacteria, Physiol. Plant.,
166, 320-335, doi: 10.1111/ppl.12940.