Metrological comparison of direct
and spectral estimates of EEG amplitude in frequency domains
г
A.P. Kulaichev, 2016
citing: International
Journal of Psychological and Brain Sciences. 2016, 1(2):21-28.
Аннотация:
This
work performs the metrological comparison of two groups of indicators estimating
the average level of EEG–potentials. The indirect spectral indicators (ISI)
based on amplitude spectrum and power spectrum are contrasted with natural
indicators (NI) based on period-amplitude analysis, on EEG absolute value
and on EEG envelope. Five major results were obtained: 1) NI give almost
equivalent estimates that differ from ISI significantly; 2) NI demonstrate
smooth dynamics of their value change at successive epochs whereas ISI
are subject to drastic and casual fluctuations; 3) ISI unlike NI do not
possess the additivity property of statistical averaging, their estimates
depending on number and length of averaged epochs can differ over 3 times
in their values; 4) ISI at simulated signals with a known amplitude ratio
give estimates that differ 1.4–1.55 times from true value whereas NI show
the proper estimates; 5) ISI depending on differences between EEG spectral
distribution give estimates which differ over 5 times in their ratios while
NI show the same ratios which differ 1.38–3.7 times from ISI.
The least reliable results in all comparisons
are related to the power spectrum. These conclusions do not allow to qualify
metrologically ISI as an analytical tool that is adequate for the nature
and peculiarities of EEG potentials. Their use may lead to incompatibility
of the results obtained by different researchers.
Ключевые
слова: EEG amplitude, amplitude spectrum,
power spectrum, period-amplitude analysis, envelope, filtration, metrology
1. Introduction
In this work we examine
and discuss one of the major questions for the field of metrology. It is
concerned with those criteria, estimates and standards in computing or
quantitative EEG (QEEG) that were not generally formulated for a number
of reasons (Kulaichev, 2007). As follows from the special monographic review
(Tong, Thankor, 2009) as well as from many papers on QEEG, metrological
questions still remain beyond the scope of interest of EEG researchers.
The newly proposed mathematical methods are not compared with their previous
analogues, their efficiency in solving typical physiological tasks is not
estimated, compared, and neither it is statistically verified. The methods
traditionally used in practice are not critically examined and reviewed.
Moreover, there is still no global normative EEG database.
Only a fraction of
literature on the topic (Ivanov, 2011, Kulaichev, 2007, 2009, 2011, Orihovskaya,
Antonova-Rafi, 2014) focuses on special metrological aspects. A separate
branch is represented by 65 years long discussion about an optimal EEG
reference which still has not led to the development of some universally
estimated quantitative criteria and standards (cf. reviews in Ng., Raveendran,
2007, Kayser, Tenke, 2010). The lack of metrological support and standards
leads to incompatibility and inconsistency of results and conclusions drawn
by different researchers (cf. literature reviews in (Kulaichev, 2012, Kulaichev,
Gorbachevskaya, 2013, Kulaichev, Iznak et al., 2014)).
More favourable situation
developed in traditional clinical EEG diagnostics which focused entirely
on visual studying of records and where clear criteria and standards for
both symptomatology and drawing clinical conclusions were formulated (Deuschl,
Eisen, 1999). Another positive example is concerned with heart rate variability
analysis where the permanent international working group established by
European cardiological society and North American society of stimulation
and electrophysiology several decades ago provides metrological standardization
and regulation of computing methods and estimated indicators (Malik et
al, 1996).
One way or another,
the scientific EEG investigations during many decades mainly followed the
physical and technical applications of mathematical methods of signal analysis
which were often directly and noncritically transferred by invited engineering
specialists without any consideration given to fundamental nonstationarity
of bio-signals and nonharmonic nature of their sources (Kulaichev, 2007).
Indeed, there isn't any widely known pure or applied mathematician who
developed special methods of EEG analysis.
However, there will
hardly be objections against the vital necessity to seek better accuracy
and more adequate measurement as well as analytical tools in any field
of science or domain of knowledge. If a researcher has two analytical tools
with different measurement error then being responsible for the evidence
and consultations he presents he will definitely choose the tool of higher
measuring accuracy and reliability, otherwise scientific community can
qualify his results and conclusions as insufficiently convincing. Furthermore,
fundamental questions of accuracy and adequacy of measuring and analytical
means are undoubtedly methodically significant, actual and primary in any
scientific area including EEG studies.
Based on the aforesaid,
our aim is to compare metrologically the direct measurements of average
EEG amplitude in frequency domains to indirect estimates obtained from
amplitude and power spectra. The following analysis reveals the numerous
errors peculiar to spectral EEG amplitude estimates.
2. Methods to estimate EEG average amplitude
From the very beginning
of the computer era, especially due to FFT algorithm developed in 1965,
EEG amplitude in chosen frequency domain began to be estimated via amplitude
spectrum or power spectrum as squared amplitude spectrum (Otnes, Enochson,
1978, Randall, 1987).
However, in case
of insufficient professional mathematical intuition a nonlinear relationship
between power spectrum estimates is difficult to perceive in comparison
with linear relationship between amplitude spectrum estimates. Moreover,
it is not easy to realize the physiological meaning of estimations expressed
in squared microvolts when EEG biopotentials are initially measured rather
than their squares or volumes. As a result of its nonlinearity the power
spectrum is characterized by dominant high-amplitude peaks with leveled
and even disappearing medium-amplitude and low-amplitude details. This
is expressed in ratios of frequency domains in chosen derivation and in
ratios of derivations in chosen domain but it is visually-hypertrophied
and evident for topographic maps displaying only two areas on a scalp in
blue and red colours. And finally, let us speculate about the mathematical
meaning of power spectrum average value. It is the dispersion of EEG amplitude
spectrum with respect to zero as the mean value (Otnes, Enochson, 1978).
The rhetorical question immediately arises: what physiological meaning
can be associated with this indicator?
Moreover, the results
of spectral analysis are characterized by a number of errors, the most
famous one is the power leakage from the main peaks. However this effect
is narrowed by increased frequency resolution and it is accounted for signals
with powerful monoharmonic sources. That does not correspond to EEG where
this kind of generators does not exist. So if the phenomenon does not exist,
any ways of dealing with it (Harris, 1978) make no sense. Less known error
is caused by the influence of amplitude modulation which is inherent in
EEG signals. It leads to appearance of side peaks in spectrum which can
be at a considerable distance from the main peak (Kulaichev, 2007).
Notably, at frequency
resolution of 0.25 Hz and better distribution of EEG, spectral harmonics
appears to be a chaotic sequence of high and low amplitude components which
are also highly variable in their amplitude and frequency through epochs
(fig.1). Therefore, separate harmonics are not viable for analysis and
they make no physiological sense. And that is why the averaged spectral
estimates within a selected frequency domain are commonly used in practice
for they are more statistically stable indicators. These indicators will
be considered as indirect estimates based on amplitude spectrum (As)
and power spectrum (Ps).
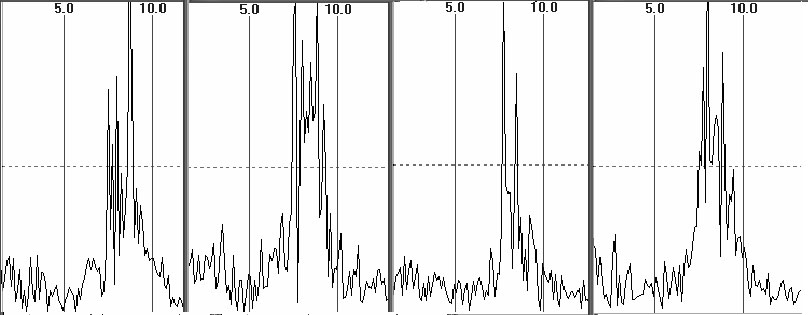
Fig.1. The amplitude spectra in four successive 8-second epochs
in O2 derivation, "closed eyes" test
Now let us discuss
what is meant by "average signal amplitude". For monoharmonic signals the
answer seems to be obvious - it is the difference between maximum and minimum
of oscillations. In case of polyharmonic character of signal the answer
is not so obvious. During the pre-computer era this problem was solved
by period-amplitude analysis when the measurements of amplitudes and periods
of consecutive oscillations were performed manually on paper record, then
the average amplitude was calculated (it is designated it as Ap), as well
as other descriptive statistics. With the profound use of computers this
method was fulfilled by a preliminary digital signal filtration in a chosen
frequency domain and subsequent automatic measurements of differences between
ascending and descending amplitude extremums (fig. 2B). Under these conditions,
however, there are two options depending on a critical decision: to consider
or not to consider the amplitude differences relating to periods which
are beyond the analyzed frequency domain (such periods usually belong to
the low-amplitude oscillations). Furthermore, averaging of amplitude differences
usually is not corrected taking into account variability of their temporary
duration.
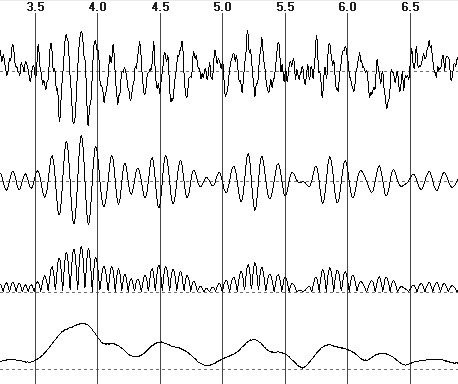
Fig.2. From top to bottom: the EEG fragment, its filtering in alpha
domain, the module of filtered signal, the EEG envelope
Another method comparatively simple for
application consists in calculating the mean of EEG absolute value (fig.
2C, this indicator is designated as Am). Indeed, as such measurements
are preceded by EEG filtration in a frequency domain, then the transformed
record is centered around zero and both positive and negative EEG extremums
are quite symmetric and their dynamics are sufficiently smooth. Therefore,
averaging of amplitudes of the signal through all time samples gives a
stable and balanced measure of average EEG amplitude. As the simple
calculations can show, this indicator also considers the temporal variability
of EEG periods.
The third alternative estimation can be
a mean value of EEG envelope (fig. 2D) which reflects the signal amplitude
modulation (this indicator will be denoted as Ae). In this connection
Ae is similar to 0.5 of Ap but it is disposed of quantization
of EEG extremums in time and of variability of their periods.
These three indicators are referred below as “natural measures”
of average EEG amplitude and they are compared with indirect spectral estimates.
3. Results
3.1. Integral differences
Here let us estimate
distinctions between Ps, As, Ap, Am, Ae indicators using 32-seconds
EEG record for "closed eyes" test, 10-20% system of derivations, 256 Hz
sampling rate, and analysis in alpha domain. Since the values of indicators
vary significantly then Z-normalization of values of each indicator throughout
all derivations should be performed for comparability of results.
Fig. 3 shows the
evaluation of Ps, As, Ae estimates through four derivation meridians
(Ap and Am values by reason of their proximity to Ae
are not shown). As it can be easily seen, this record demonstrates classical
consecutive reduction of alpha rhythm amplitude from occipital to frontal
derivations with noticeable left- and right-handed asymmetry in parietal
and occipital areas. Furthermore, it is obvious a number of differences
between three indicators changing their sign in some derivations.
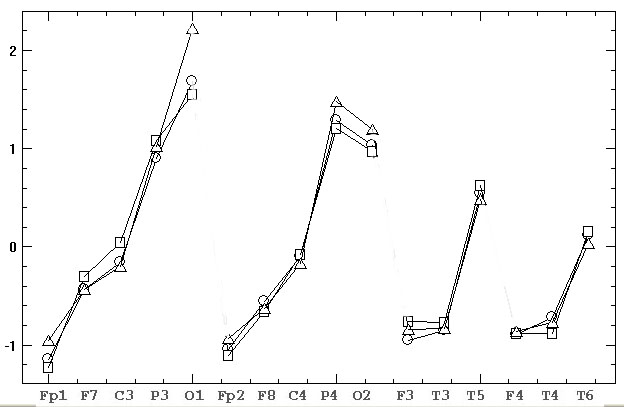
Fig.3. Z-normalized estimates of EEG average
amplitude based on amplitude spectrum (squares), power spectrum (triangles)
and EEG envelope (circles)
First of all let us
calculate descriptive statistics (variation range, mean ± standard deviation)
for absolute values of differences of As, Ap, Am indicators relative
to Ae:
|As-Ae|: 0.009–0.21,
0.101±0.058;
|Am-Ae|: 0.0001–0.012, 0.0036±0.003;
|Ap-Ae|: 0.0004–0.07,
0.003±0.002.
The greater difference
occurs for As, it reaches 21% of Z–value and its average difference exceeds
10%. The differences of Ap and Am from Ae are minimal,
average difference does not exceed 0.36% of Z–value. The divergences between
the mean values of |As-Ae| and |Am-Ae| as well as of |As-Ae|
and |Ap-Ae| are verified by t–test with high confidence p=0.000007.
Nevertheless, the difference between |Am-Ae| and |Ap-Ae|
is not significant at p=0.46, thus Ap and Am indicators
may be regarded as equivalent.
Let us calculate similar statistics for the
differences of three natural indicators relative to As:
|Ae-As|: 0.009–0.21, 0.101±0.058;
|Am-As|: 0.019–0.26, 0.12±0.066;
|Ap-As|: 0.004–0.21, 0.102±0.033.
The null hypothesis
of pairwise differences between |Ae-As|, |Am-As|, |Ap-As|
are accepted with high confidence p=0.95, 0.95, 0.96, thus these
three natural indicators can be considered as equivalent.
Finally, let us perform
calculations for Ps relative to Ae and As:
|Ps-Ae|: 0.003–0.54, 0.115±0.126;
|Ps-As|: 0.02–0.67, 0.169±0.157.
Thus, power spectrum
gives estimates greater then above-considered ones with respect to their
variation ranges and mean values as compared to amplitude spectrum and
envelope indicators.
Summary.
Three natural indicators of EEG average amplitude practically do not differ
and may be regarded as equivalent ones, but they are significantly different
from the indirect estimates based on amplitude spectrum. Even greater differences
with the other four parameters are valid for the power spectrum.
3.2. Differential differences
Several methodological
approaches can be applied for a more detailed numerical study of adequacy
of considered indicators. As the equivalence of free natural estimates
has been shown above then in further comparisons the measure based on an
envelope will be mainly used.
The idea of the first
approach is as follows. If we divide a hole EEG record onto overlapping
epochs with a small time shift between themselves, the dynamics of adequate
indicator values through epochs should become sufficiently smooth.
Now let us consider
the occipital O2 derivation with a high amplitude of alpha rhythm and the
frontal F3 derivation with a low representation of alpha rhythm. Total
32-seconds time interval will be divided onto 150th epochs of 2-seconds
duration and shifted at 0.2-seconds between themselves. For each i–th
epoch (i=1-150) let us calculate Asi and Aei
estimates. To make their comparison possible Z–normalization of each indicator
should be performed for all epochs. Since the time shift between epochs
amounts to 10% of their duration, temporal dynamics of adequate estimates
through epochs should be sufficiently smooth without sharp fluctuations.
Significant differences
between the time dynamics of two indicators is illustrated in Fig.4: the
dynamics for Ae is smoother compared to a high-amplitude random
fluctuations for As. Besides, comparing O2 and F3 graphs reveals
a whole series of episodes of opposite tendencies between two indexes,
i.e. differences in their topographical relations. For example Asi
and Aei estimates differ significantly in O2, but they
are equal or their ratio changes to opposite in F3. Such topographic differences
are extremely disturbing because they can lead to incompatibility of results
and conclusions for intergroup comparisons estimating influence of various
factors such as age, sex, occupation, pathology, functional condition,
motivation, social or professional affiliation, etc.
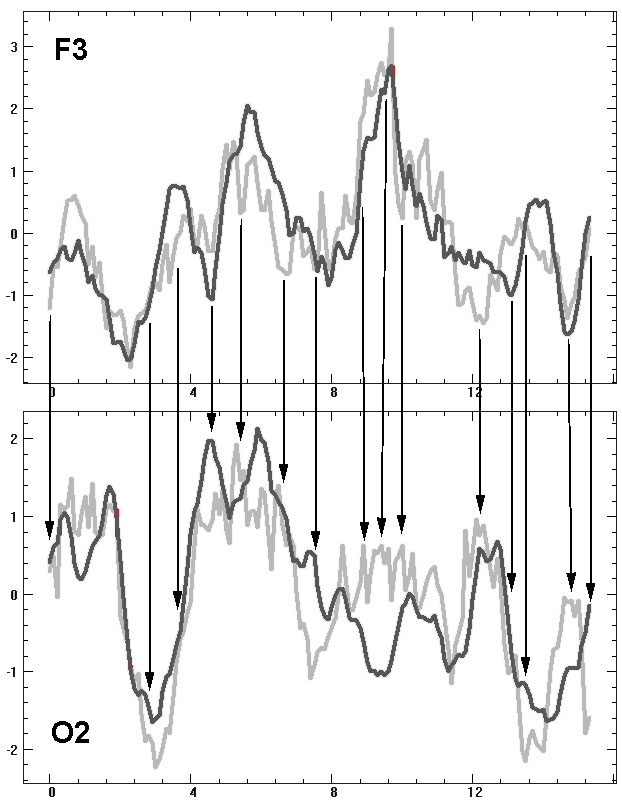
Fig. 4. Dynamics of average EEG amplitude
in alpha domain at 150th 2-seconds epochs (x-axis) shifted by 0.2-seconds
among themselves for F3 and O2 derivation, gray – amplitude spectrum estimates,
black – EEG envelope estimates, the arrows mark the obvious episodes of
topographical distinctions
The numerical estimation of the degree of
"smoothness” of dynamics can be made if to calculate absolute differences
for each X-indicator between pairs of subsequent epochs DXi=|Xi+1-Xi|
(i.e. absolute derivative) and then evaluate the mean value DX.
The results of the quantitative comparison are given in the table 1 the
columns of which include derivation, frequency domain, As or Ae
indicator, mean absolute difference between As and Ae (i.e.
mean values of |Asi-Aei|)
with its standard deviation, mean value DAs
or DAe (i.e. absolute derivative) with
its standard deviation, a significance level of null-hypothesis “no distinction
between DAs and DAe”.
Table 1. The results of the analysis of differential
distinctions between average EEG amplitude estimates based on amplitude
spectrum and EEG envelope
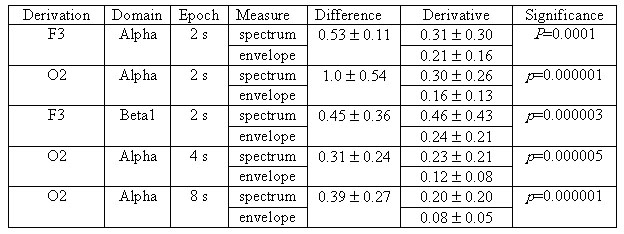 As anyone can see from
the table.1 the average absolute difference between Asi
and Aei is up to 31–100% of Z–value that much more exceeds
the differences mentioned in the previous section. This situation is quite
alarming because any researcher due to random factors can perform EEG recording
in an error-prone time period.
As anyone can see from
the table.1 the average absolute difference between Asi
and Aei is up to 31–100% of Z–value that much more exceeds
the differences mentioned in the previous section. This situation is quite
alarming because any researcher due to random factors can perform EEG recording
in an error-prone time period.
The mean values and
standard deviations for DAe
are 1.5–2 times smaller compared to DAs
and the differences between DAe
and DAs are highly
significant statistically. Similar conclusions are also reproduced for
higher frequency beta1-domain and for longer 4- and 8-seconds epochs. Thus,
the revealed regularities are stable and reproducible regardless of derivation,
frequency domain and epoch duration.
Finally, let us asses
the power spectrum estimates for alpha domain in O2 derivation and 2-seconds
epoch. The average absolute differences between Ps and Ae
are characterized by statistics 0.54±0.45 and between Ps and As
by statistics 0.29±0.25. Statistics for DPs
derivative is 0.25±0.21. It is significantly different from DAe
at p=0.0001 and differs from DAs
at p=0.02 by a statistical trend.
Summary.
The natural estimates of average EEG amplitude provide a smoother dynamics
of their changes during neighbouring epochs whereas the spectral amplitude
and power estimates are the subject to sharp and casual fluctuations. Furthermore,
they do not coincide with each other by a statistical trend.
3.3. Additivity of averaging results
The statistical averaging
operation has the property of additivity, namely: the mean value of the
sample is equal to averaging of averaged values of its consistent subsamples.
Natural estimates of EEG average amplitude possess those properties by
definition.
Let us examine this
property for spectral estimates. Let us take the same F3 and O2 derivations
in alpha and beta1 domains and calculate As and Ps at 32-seconds
epoch. Then this interval is divided into 2, 4, 8 epochs, calculate Asi
and Psi at each i-epoch and average those estimates.
The results are given in the table 2 which implies a consistent increase
in As and Ps estimates depending on the number and size of
epochs.
Table 2. Alterations of average EEG amplitude
estimates based on amplitude and power spectrum depending on the number
and size of averaged epochs
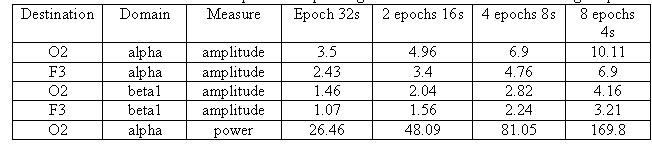 This situation is also quite alarming because
different researchers analyze EEG records of different lengths, so their
results and conclusions may be incomparable and even contradictory in some
cases. This property is not inherent to a particular frequency characteristic
(amplitude spectrum, power spectrum, etc.) but to FFT method itself applied
for EEG signals. By increasing the analysis period and frequency resolution
in EEG spectra more harmonics with low amplitude appear and such harmonics
make no physiological sense. It results in the systematic reduction of
average values with increasing of epoch length according to the law very
close to the linear one (table. 2).
This situation is also quite alarming because
different researchers analyze EEG records of different lengths, so their
results and conclusions may be incomparable and even contradictory in some
cases. This property is not inherent to a particular frequency characteristic
(amplitude spectrum, power spectrum, etc.) but to FFT method itself applied
for EEG signals. By increasing the analysis period and frequency resolution
in EEG spectra more harmonics with low amplitude appear and such harmonics
make no physiological sense. It results in the systematic reduction of
average values with increasing of epoch length according to the law very
close to the linear one (table. 2).
Summary.
The indirect spectral estimates of average EEG amplitude do not possess
the property of additivity of statistical averaging operations. The resulting
estimates depending on the number and length of averaged epochs can differ
over 3 times in their values.
3.4. Comparison on simulated signals
Now let us compare natural
and indirect estimates of average EEG amplitude using two synthesized signals
(fig. 5).

Fig. 5. Two synthesized signals of 32-seconds length: 1) the sum
of 3 harmonics of 184 µV amplitude and 9, 10, 11 Hz frequencies; 2) the
sum of 3 harmonics of 122 µV amplitude and 9.5, 10, 10.5 Hz frequencies
As anyone can see, the ratio of the original
harmonic amplitudes is 184/122=1.508. The similar ratio is for means of
variations range of synthesized signals: (548.3+19.2)/2=283.8 µV, (367.4+6.3)/2=186.8
µV, the ratio is 1.512. It is obvious that an adequate measure should give
the same ratio of two estimates:
As gives 8.64 and 4.1 µV, ratio=2.11
Ps: gives 492.2 and 220.2 µV2, ratio=2.34,
Ap gives 249.5 and 168.1 µV, ratio=1.48,
Am gives 83.1 and 55.5 µV, ratio=1.5;
Ae gives 88.04 and 132.1 µV, ratio=1.5.
Summary.
The indirect spectral indicators of EEG average amplitude on simulated
signals with known amplitude ratio produce estimates 2.11/1.511=1.4 and
2.34/1.511=1.55 times different from the correct values, whereas the natural
indicators show correct ratio of mean amplitude of signals.
3.5. Dependence on spectral distribution
As it has been shown
above, the natural indicators give correct amplitude estimation for known
model signals. Therefore, they can be used them as a reference point to
continue the comparison on real EEG records varying in the shape of distribution
of spectral harmonic amplitudes (fig. 6).
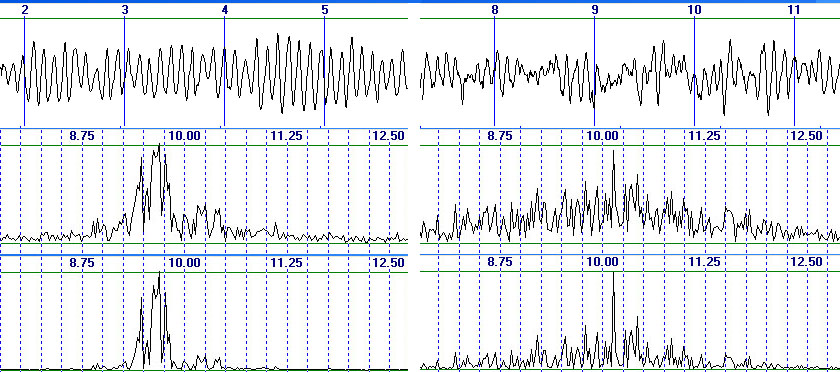
Fig.6. Two subjects with different spectral distribution in alpha
domain, from top to bottom: EEG in O2 derivation, amplitude spectrum, power
spectrumFig.6. Two subjects with different spectral distribution in alpha
domain, from top to bottom: EEG in O2 derivation, amplitude spectrum, power
spectrum
As anyone can see,
two examiners differ considerably in their EEG spectral distribution. For
the first of them the frequency range of predominant alpha rhythm amplitudes
is quite narrow 9.2–10 Hz, while for the second the range is wider 8-12
Hz. The resulting estimates are:
Ae: 31.3 and 118 µV, ratio=0.26;
Am: 20 and 75.3 µV, ratio=0.267;
Ap: 227.1 and 60.4 µV, ratio=0.266;
As: 4.1 and 11.29 µV, ratio=0.36;
Ps: 25 and 351.3 µV2, ratio=0.07.
Note that the latest
result would be a consequence of Ps quadratic suppression of harmonics
on the lateral frequencies of the first examiner.
Thus, the natural
indicators demonstrate almost the same proportion (the difference between
them is 0.267–0.26=0.007 or 0.007/0.26=2.7% of ratio value) while the spectral
estimations 0.36/0.26=1.38 and 0.26/0.07=3.7 times differ from the natural
ones according to their ratios respectively. In addition, the spectral
indicators demonstrate even a greater difference between the ratio values
(0.36/0.07=5.1 times). So as compared to correct natural indicators, As
estimations for two examiners are closer between themselves whereas Ps
estimations diverge considerably. This situation is rather disturbing since
for intergroup comparisons it can lead to displacement of mean values and
standard deviations. This may prevent statistically reliable detection
of real differences or lead to identification of pseudo-differences.
Summary.
As and Ps indicators depending on differences between subjective
EEG spectral distribution give estimates which differ over 5 times in their
ratios while the natural indicators show the same relation of values 1.38–3.7
times different from spectral estimates ratios.
4. Conclusion
As it follows from the
findings in sections 3.1-3.5, the spectral estimates of average EEG amplitude
in frequency domains possess a number of significant and fundamental errors.
In addition, the measures based on amplitude and power spectra differ in
their estimates. These results and findings do not allow to qualify metrologically
the spectral estimates as a viable (reliable) analytical tool adequate
to the nature and specificity of EEG potentials. Their use may lead to
inconsistency and thus incompatibility of results obtained by different
researchers Therefore applying the natural estimates of average EEG amplitude
seems to be more preferable and sustainable.
References
Deuschl G., Eisen
A. (1999). Recommendation for the practice of clinical neurophysiology:
Guidelines of the International Federation of clinical neurophysiology.
Elsevier, Amsterdam, 304 pp.
Harris F.J.
(1978) On the use of windows for harmonic analysis with the discrete Fourier
transform. IEEE proceedings. (66)1:51–83.
Ivanov L.B.
(2011) On informativeness of use of coherent analysis in clinical electro-encephalography.
Zh Vyssh Nerv Deiat Im I P Pavlova. 61(4): 499–512.
Malik M., BiggerJ.
T., Camm A.J., Kleiger R.E., Malliani A., Moss A.J., Schwartz. P.J.
(1996) Heart rate variability. Standards of measurement, physiological
interpretation, and clinical use. Eur Heart J. 17 (3): 354–381.
Kayser J., Tenke
C.E. (2010) In search of the Rosetta Stone for scalp EEG: Converging
on reference–free techniques. Clin.Neurophysiol. 121:1973–1975.
Kulaichev A.P.
(2007) Computer electrophysiology and functional diagnostics, 4th edition.
INFRA?M, Moscow, 640 pp.
Kulaichev A.P.
(2009) The informativeness of coherence analysis in EEG studies. Neurosci
Behav Physiol . 59(6): 757–767.
Kulaichev A.P.
(2011) The method of correlation analysis of EEG synchronism and its possibilities.
Zh Vyssh Nerv Deiat Im I P Pavlova. 61(4): 485–498.
Kulaichev A.P.
(2012) Comparative analysis of EEG correlation synchronism and EEG amplitude
relationships in all-night sleep. Zh Vyssh Nerv Deiat Im I P Pavlova. 62(1):
108–119.
Kulaichev A.P.,
Gorbachevskaya N.L. (2013) Differentiation of norm and disorders of
schizophrenic spectrum by analysis of EEG correlation synchrony. J.Exp.Integr.Med.
3(4):267–278.
Kulaichev A.P.,
Iznak A.F., Iznak E., Kornilov V.V., Sorokin S.A. (2014) The Changes
of EEG correlation synchrony at depressive deviations of advanced age.
Zh Vyssh Nerv Deiat Im I P Pavlova. 64(2):1–9.
Ng S.C., Raveendran
P. (2007) Comparison of different montages on to EEG classification.
Biomed 06, IFMBE Proceedings 15, 365–368.
Orihovskaya K.B.,
Antonova-Rafi U.V. (2014) The effect of EEG spectrum leakage when using
Barletta filter and at his absence. Int research J. (22) 3–2: 42–43.
Otnes R.K., Enochson
L. (1987) Applied time series analisys, vol.1: bsaic techniques. N.Y.
1978. 428 pp.
Randall R.B.
(1987) Frequency Analysis, 3rd edition. Bruel & Kjaer, 344 рp.
Tong S., Thankor
N.V. (2009) Quantitative EEG analysis methods and clinical applications.
Artech House, 421 pp.