Differentiation of Norm and
Disorders of Schizophrenic Spectrum by Analysis of EEG Correlation Synchrony
г
Kulaichev A.P., Gorbachevskaya N.L.
source: Differentiation
of Norm and Disorders of Schizophrenic Spectrum by Analysis of EEG Correlation
Synchrony. J.Exp.Integr.Med., 2013. 3(4)
Аннотация:
Objectives: The experimental work was designed
to find the integrated differences in EEG synchrony between normal people
and patients with disorders of schizophrenic spectrum. EEG recording have
been performed in a state of quiet wakefulness with eyes closed for three
groups of 8–15 years old adolescents: normal group (n=36) and two groups
of mental disorders in nosological categories F20 (n=23) and F21 (n=41)
according to ICD–10.
Methods: In this study we have used the
alternative method for EEG synchrony estimating based on correlation between
envelopes of EEG signals. This method was previously proven as a highly
sensitive tool of differentiation of psychopathological and functional
states.
Results: As a result of research, the complex
picture of significant topographical, interhemispheric, regional and age
distinctions was revealed, in which many of fragmentary results previously
received by other researchers found their confirmation. One of the basic
features of the received integrated picture of pathology is existence of
extended zones of sharply lowered EEG–synchrony dividing local and isolated
areas in frontal and occipital regions mainly of normal or sometimes increased
EEG synchrony. The received results completely fit into the framework of
the theory of disintegration of cortical electric activity in cases of
disorders of schizophrenic spectrum.
Conclusion: The used method provides close to
100% reliability of tripartite classification of norm and two pathology
groups separately, it allows revelation of many authentic correlations
between EEG synchrony estimations and psychometric indices, its results
are consistently reproducible for different groups of patients and examinees,
which opens up opportunities and prospects for its use as an auxiliary
quantitative differential indicator.
KeywWords:
schizophrenia, schizotypal disorder, EEG, envelope correlation, coherency,
disintegration, discriminant classification
INTRODUCTION
Among numerous papers devoted to EEG
differences between norm and schizophrenia, relatively few studies relate
to differences in EEG synchrony in a state of quiet wakefulness as it follows
from the special review [19]. However, classificatory sensitivity of EEG
synchrony estimations is significantly higher compared with amplitude spectrum
[5, 12, 13], power spectrum [5] and some other measures [13]. To a large
extent this is determined by the fact that estimates of EEG synchrony have
a significantly lower intraindividual variability, which according to our
data obtained at different experimental material and estimated by variation
coefficient is 8?12% against 23–41% for average amplitude spectrum and
against 86?95% for power spectrum. So by EEG synchrony estimations it is
possible to receive reliability of comparable distinctions at smaller sample
volumes and reliability of smaller distinctions under comparable sample
volumes.
Results obtained by different researchers
are rather fragmentary and contradictory, that was noted in the discussion
[4]. Some researchers have found that compared with the norm at schizophrenia
a coherence is lower, namely: a) intra– and interhemispheric coherence
in all domains [27]; b) violated lefthemispheric F–T connections [23];
c) a coherence in d and
q
domains at Fp1–F7 derivations and in a
domain at F7–F8 [28]; d) a coherence in d
domain in temporal lobe [31]. Other studies on the contrary have shown
that for schizophrenia compared with the norm a coherence is higher, namely:
a) intra– and interhemispheric one in q
domain and intrahemispheric one in a
domain [20]; b) interhemispheric one in d
and b domains at
О1–О2 and in d domain at
Т5–Т6 [22]; c) intrahemispheric one in general [18] or only in d
domain [29]. It is significant that most of the cited works were published
about ten and more years ago. Probably, such a situation is caused by the
fact that coherence function is unstable indicator of EEG synchrony [7,
14, 15, 17]. The observed inconsistency of results makes it actual to use
alternative approaches to evaluation of EEG synchrony in this field.
MATERIALS AND METHODS
EEG recording was carried out in a state of
quiet wakefulness with eyes closed. The electrodes were placed according
to 10?20% system in 16 cortex areas (O1, O2, P3, P4, C3, C4, F3, F4, T5,
T6, T3, T4, F7, F8); united ears electrodes were used as referents (A1+A2);
the bandwidth was 0.5–35 Hz; sampling rate was 200 Hz. For the analysis
we selected the fragments free of artifacts with duration 41 seconds (8196
discrete time slots). The analysis was carried out in five standard frequency
domains: delta (d) 0.5–4
Hz, theta (q) from 4–8
Hz, alpha (a) 8–13 Hz,
beta–1 (b1) 13–20 Hz, beta–2
(b2) 20–32 Hz.
The group of patients with disorders of
schizophrenic spectrum was diagnosed according to ICD–10 in Mental Health
Research Center, Moscow and it consisted of 125 boys 8–15 years old. For
45 of them (age 11.5±2.2 years), the diagnosis
made was schizophrenia, childish type (F20), and for 80 adolescents (age
11.9±2.5 years) schizotypal disorder (F21).
Control group N (norm) included 36 pupils from Moscow’s schools without
documented mental deviations (age 12.2±2.0
years). Parents of all examinees gave the written permission for carrying
out researches and publication of their results.
In this study we used the alternative approach
to similarity estimation between bioelectric activity of different cerebral
areas: the analysis of EEG correlation synchrony (ACS) proposed and detailed
in [13]. It estimates degree of EEG synchrony by correlation coefficient
between envelopes of EEG records preliminary filtered in a given frequency
range. Here it is appropriate to emphasize that as an envelope represents
a change of EEG amplitude modulation, so the synchrony estimation constructed
on its basis has the direct and important physiological sense (unlike coherence).
Indeed, the EEG amplitude increases with increase of synchrony of postsynaptic
potentials, so the correlation of EEG envelopes estimates the degree of
synchrony in change of such intraneuronal synchronism.
An ordered sequence of such correlations
between nearby derivations (in our case, between 36 EEG derivation pairs)
have been named profile of synchrony (PS) and such profiles as topographic
patterns of EEG synchrony (for group of subjects we have an aaray or a
matrix of profiles) are the source material for the further analysis. This
method has already demonstrated its high efficiency for a similar problem
[13] as well as for differentiation of night sleep stages, i.e. functional
states [12].
Below for evaluation of pairwise sample differences we use the nonparametric
Wilcoxon test since a large part of sample distributions differs from normal
law. For evaluation of group differences we also apply the two–way repeated
measures ANOVA (number of repeated measures is equal to number of subjects
in compared groups). We also use the designations of groups: F20, F21,
N and the designation of frequency domains: d,
q,
a,
b1,
b2.
RESULTS
1. Analysis of records on consistency
In any statistical sample due to influence
of casual, uncontrolled in experiment factors there are outliers, and also
among measurements there are more consistent and less consistent ones.
For reliable separation of prevailing parities it is desirable preliminary
to clear samples from outliers as well as from less consistent measurements.
In our case, a role of random factors can be acted by: 1) instrumental
factors such as differences in position of electrodes concerning anatomic
cortex structures, changes in interelectrode resistance, etc.; 2) personal
factors such as differences in individual EEG characteristics, differences
in current physiological and psychological state, etc.; 3) classifying
factors such as patients belonging to nosology not differentiated or not
clearly differentiated in ICD–10 [24], subjective judgments of psychiatrists,
etc. Therefore, in each of two groups of patients it is desirable to get
rid of influence of such extraneous casual factors by extracting among
each of groups a central compact "kernel" of highly consistent measurements.
In connection with the representative statistical volume of available samples,
such selection of compact "kernel" is considered to be possible to perform.
For this purpose we used the method, which
was proposed in [13] and showed its effectiveness for a similar task as
well as for differentiation of functional states [12]. Its essence is calculation
of the average correlation of PS of each subject with profiles of synchrony
of all other subjects. This average correlation estimates the average personal
consistency of topographic distribution of EEG synchrony on scalp. As a
result, a growing sequence of such estimates (rank?ordered sample) is formed,
which is visualized by Ketle chart. Using this chart we select subjects,
averaged correlations of which exceed 0.4–0.5 and number of which is not
less than 50% of original sample.
a)
|
b)
|
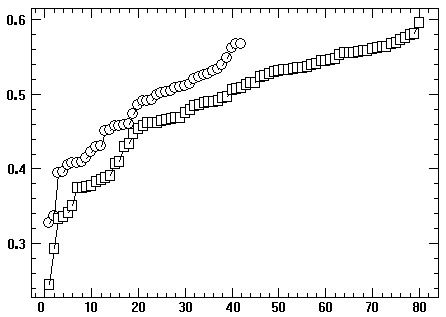
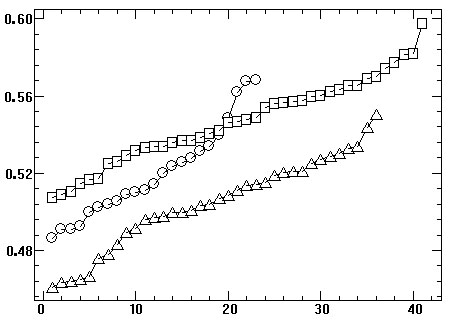
Fig. 1. Average interindividual correlations of synchrony profiles of
EEG records (vertical) in ascending order (horizontal): circles – F20 group,
squares – F21 group, triangles (Fig. 1a) – N group: a – all records, b
– highly consistent records, 1 – outliers, 2 – less harmonized subgroups,
Since our analysis is carried out in 5 frequency
domains, so in order to perform the abovementioned selection, the estimates
should be used that averaged over 5 domains. In the variational series
for F20 and F21 groups (Fig. 1a) we can see the presence of outliers and
of several subgroups of different degree of consistency. Fig. 1b presents
variational series of highly consistency subgroups of F20, F21 and N subjects.
The fact draws the attention that N subgroup is characterized by less averaged
consistency (0.50) compared with F20 and F21 subgroups (0.52 and 0.55).
This confirms the conclusion [14] that a sample from a less representative
general population related to a particular type of pathology turns out
to be more consistent than a sample from a much larger population related
to psychological norm, or in other words according to winged expression:
every “healthy” man is "healthy" in its own way but every "sick" one is
sick alike.
It is necessary to emphasize, that in this
study not only the usual problem of differentiation of norm and pathology
was considered, but at the same time also the non–depicted earlier in literature
more complex task of detection of subtle differences between the two close
nosology. Such a formulation of the task proves advisability and necessity
for the following analysis of use of the highly consistent EEG records
(Fig. 1b): 1) F20 subgroup included 23 patients in age of 11.2±2.1;
2) F21 subgroup included 41 patients, in age of 12.2±2.0.
As anyone can see, the selected subgroups reproduce the age ratio of initial
groups in a well–balanced way, and on this basis they are also quite suitable
for the further analysis.
In a case of larger volume of experimental
data the second stage could be completed of the source material purification,
which consists in removal of records, synchrony profiles of which contain
two or more values exceeding three standard deviations. A simple statistical
calculation shows that probability of occurrence of such a "complex" outlier
among 36 variables of synchrony profile is 0.054.
2. Discriminant classification
The results of some our researches, in particular
[12, 13], have shown that linear discriminant classification of groups
of subjects – corresponding to different nosology, therapeutic treatment,
functional states, social, age and sexual categories, – is the effective
primary indicator of prospectivity of a further research. If such a classification
of originally specified groups gives a significant number of errors (over
20?30%), then such groups are slightly differ by its EEG indicators or
strongly internally heterogeneous, and if so further detailed analysis
of their differences is as a rule unproductive.
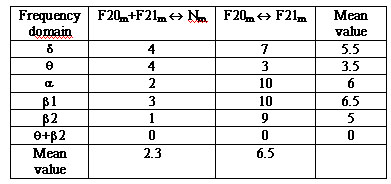
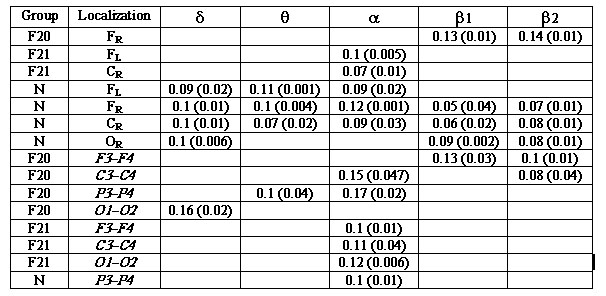
The results of the classification are given
in the table 1. Let us note the following: 1) q
domain provides the lowest (on average) percentage of classification errors,
which confirms the results of [13]; 2) b2
domain is the next one by a its discriminant sensitivity; 3) association
of indicators of these two frequency domains gives the exact classification
of three groups; 4) presence of small errors of classification shows that:
a) the performed selection of subjects assured sufficient consistency of
each pathology group; b) a detailed analysis of intergroup differences
promises fruitful results.
Table 1. Errors of discriminant classification (in
percentage) between the norm and the pathology (F20+F21-N)
and between two pathology categories (F20-F21) depending on a frequency
domain
 The obtained results favorably differ from
a number of alternative approaches using other indicators and more sophisticated
methods for classification by normal and schizophrenic patterns of EEG,
where the number of errors makes: 23% [30], 12.5% [3], 5.5?13.5% [16],
25?28.2% [25], 18.6% [21]. Only in [11] the accuracy of classification
has been achieved close to 100%, however, the revealed there set of rules
was able to achieve a unidirectional separation of schizophrenia from the
norm, but not vice versa.
The obtained results favorably differ from
a number of alternative approaches using other indicators and more sophisticated
methods for classification by normal and schizophrenic patterns of EEG,
where the number of errors makes: 23% [30], 12.5% [3], 5.5?13.5% [16],
25?28.2% [25], 18.6% [21]. Only in [11] the accuracy of classification
has been achieved close to 100%, however, the revealed there set of rules
was able to achieve a unidirectional separation of schizophrenia from the
norm, but not vice versa.
It is also interesting to compare these
results with discrimination by usage of spectral estimations. Let’s restrict
ourselves to q domain which
is the best one for minimizing errors. The usage of spectrum amplitude
averaged in frequency domain [mcV] gives (9+25)/2=17% classification errors
in average (9%, 25% and 17% correspond to three columns of table. 1); a
usage of averaged power estimates [mcV2] gives (15+29)/2=22% errors; the
logarithm of power [2log(mcV2)] often used in studies gives (10+22)/2=16%
errors. This once again confirms the above given conclusion on the higher
discriminating sensitivity of EEG synchrony estimates.
3. Local relations of synchrony
In order to determine directions and prospects
for further analysis it is necessary, first of all, to examine the overall
detailed picture of relations of EEG synchrony between normal and pathological
groups. For each of three groups we compute the average values of synchrony
in each derivation pair and scrutinize intergroup ratios of greater?lesser
synchrony (Fig. 2, 3)
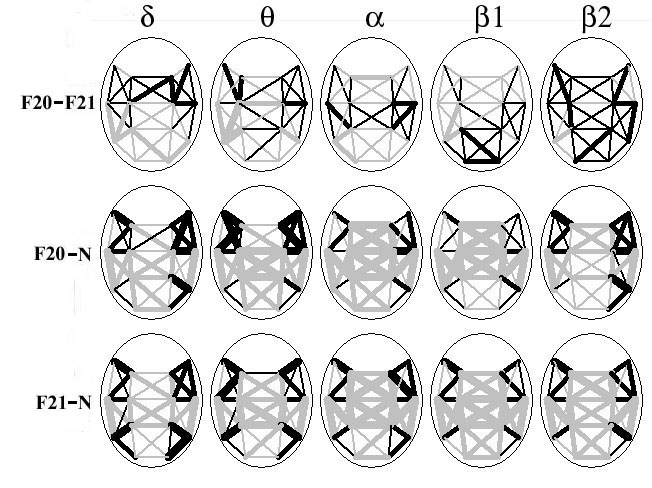
Fig. 2. Topographic maps of intergroup differences (compared groups
are designated at the left) in averaged synchrony for all derivation pairs
in 5 frequency domains (specified at top). Black lines specify the more
high synchrony in the first of two compared groups, gray lines – the smaller
synchrony, three gradation of lines thickness specify the absolute difference
in averaged synchrony |DS|
between two compared groups as it increases: |DS|<0.05;
|DS|<0.1; |DS|>0.1.
At the topograms (Fig. 2, 3), first of all,
our attention is drawn to the crosswise area of sharp decrease in synchrony
of pathology groups ("downfall") in comparison with the norm, including
sagital?interhemispheric and axial?central segments. It’s possible that
this indicates significant violations of interhemispheric and frontal–occipital
relationships at disorders of schizophrenic spectrum. At comparison of
two pathology groups (F20–F21) in many frequency domains we also observe
distinctive regional and interhemispheric areas of increase–decrease of
synchrony.
Due to observed regional structure of intergroup
synchrony relations with a purpose of identification of statistically significant
patterns it is more appropriate now to consider separately interhemispheric
and averaged regional intrahemispheric ratios.
4. Interhemispheric synchrony
For each group and each frequency domain there
were calculated average values of synchrony between derivations F3–F4,
C3–C4, P3–P4, O1–O2. The results are presented at Fig. 4.
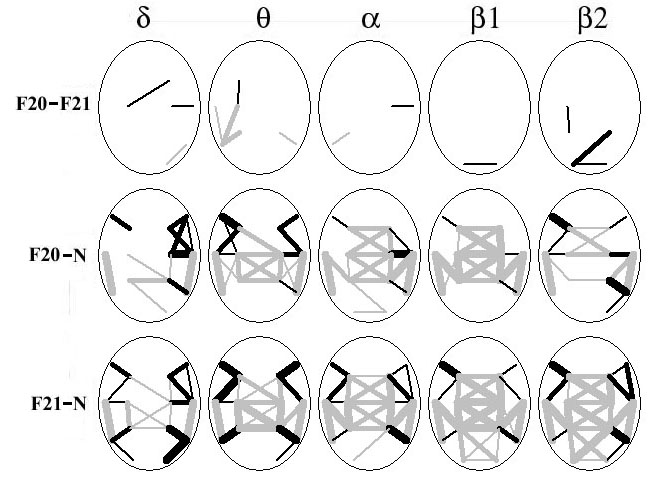
Fig. 3. Topographic maps of intergroup differences reliability in
averaged synchrony for derivation pairs in 5 frequency domains. Three gradation
of lines thickness specify the significant level of null hypothesis: 0.01<p<0.05;
p<0.01;
p<0.001.
Other notations are similar to Fig. 2.
From comparison of the charts and
the statistical distinctions, first of all, it should be noted:
1. In most cases, there can be observed a reduction
of synchrony in center–vertex–occiput direction. Jonckhreere test, which
takes an orientation of factor effect into account, reveals the existence
of such trends at р=0.03*10-7 for all groups and domains
(except for F20 group in b2
domain). The reduction of synchrony in front–center direction is observed
for all groups in a domain
(р=0.0002*10-7) and for pathology groups also in q
domain (p=0.016–0.0012). This conclusion coincides with the results
of [4].
2. In most cases (68% from 40 comparisons, p=0.04–0.0004)
there is observed the higher synchrony in N group in relation to F20, F21
groups, and in 23% cases this ratio is manifested itself in a form of trend
of mean values. This conclusion coincides with the results of [4, 27] being
opposite to some fragmentary conclusions [20, 22]; the latter ones however
are distinguished by statistically small volumes of samples included 8
and 11 patients.
3. Local differences between F20 and F21groups are
observed only in O1–O2 occipital pair in b1
(p=0.04) and b2
(p=0.03) domains, and in both cases, the synchrony values for F20
group do not differ from the norm (p=0.46), but for F21 group these
values are significantly lower (p=0.043).
4. However, at Fig. 4 for F20 and F21 groups in sagital
neighboring derivation pairs we see systematic differences between them
that the analysis of variance allows to reveal when the second factor is
regional one (2 factor gradations): a) increase of synchrony in F21 group
(with the convergence to the norm) in F–C region in q
domain (p=0.00005); b) increase of synchrony in F20 group (with
the convergence to the norm) in F–C region in b1
(р=0.00001) and *2 (р=0.004) domains.
5. For differences between front–occiput regional synchrony
(F–O) there is only one distinction between F20 and F21 groups in b1
domain (p=0.01).
5. Regional intrahemispheric
differences
For each group and for each frequency domain
there were calculated average values of synchrony for six regions: for
the left and right frontal regions (FL, FR), comprising, respectively,
the values of synchrony between F7, F3, T3, C3 and F8, F4, C4, T4 derivations;
for the left and right central ones (CL, CR) including synchrony between
T3, C3, T5, P3 and C4, T4, P4, T6 derivations; for left and right occipital
ones (OL, OR), including synchrony between T5, P3, O1 and P4, T6, O2 derivations.
The results are presented at Fig. 5.
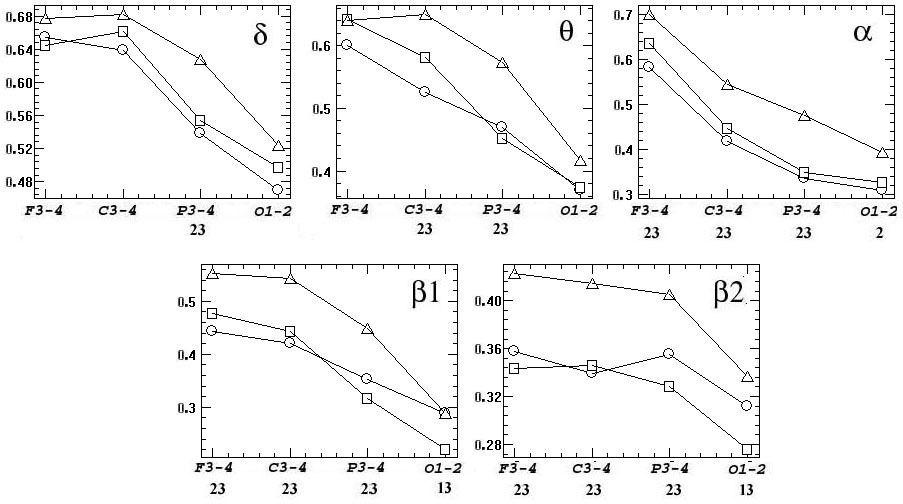
Fig. 4. Differences in interhemispheric synchrony for 5 frequency
domains (р=0.04–0.0004). The values averaged for each group synchrony
(vertical axes) are shown for derivation pairs: F3–F4, C3–C4, P3–P4, O1–O2
(horizontal axes). Group markers: circles – F20, squares – F21, triangles
– N. Below graphics, the designation of reliable intergroup differences
is shown in number notation: 1 – F20–F21, 2 – F20–N, 3 – F21–N.
From comparison of the charts and shown
statistical differences, first of all, it should be noted:
1. In N group there is observed: a) approximate equality
of synchrony in frontal–central FL, FR, CL, CR region (except its decrease
in a domain, p=0.02–0.0007);
b) reduction of synchrony in the occipital OL, OR area (р=0.048–10-5,
except b2 domain).
2. In F20 and F21 groups it is observed a sharp decrease
of synchrony in central region compared with frontal and occipital ones.
In most cases the differences between FL–CL, FR–CR, CL–OL, CR–OR manifest
itself with high confidence (76% reliable differences from 50 comparisons,
р=0.033–10-8).
3. Synchrony in N group compared with F20 and F21 groups
is as follows: a) it is significantly higher in central region (95% reliable
differences from 20 comparisons, р=0.01–10-7),
which coincides with the results of [4, 27, 31]. b) in some cases it is
lower in frontal and occipital regions (30% reliable differences from 40
comparisons,
p=0.049–0.001), which partially coincides with the
results of [18, 20, 27, 29].
4. Local–intraregional differences between F20 and
F21 groups are detected in CL and OR regions in q
domain (p=0.04) and in OL region in a
domain (p=0.047). Additionally, at Fig. 5 the macro regional intergroup
differences (for both hemispheres) are also observed, and analysis of variance
allows to reveal those differences in case that as a second factor we use
left and right regions: a) reduction of synchrony in F20 group in occipital
OL–OR area in d (p=0.007),
q
(р=10-6) and a
(p=0.0002) domains with its convergence to the norm and increase
of synchrony in central CL–CR area in b2
domain (p=0.008); b) reduction of synchrony in F21 group in frontal
FL–FR area in b2 domain
(p=0.004) with its convergence to the norm.
5. Comparing of the difference between frontal synchrony
and occipital one reveals differences between F20 and F21 groups in d
domain for FR–OR remainder (p=0.03) and for remainders between FL–OL
(p=0.02) and FR–OR (p=0.03) regions in q
domain.
6. Regional asymmetry
Visually, at Fig. 5 we can note some signs of right–sided asymmetry;
most distinctly they appeared in F20 and F21 groups. Statistical comparison
of mean values for left and right regions reveals the presence of right–sided
asymmetry (p=0.048–0.007) in occipital OL–OR area for F20 group
in d, a and b2
domains and for F21 group in a,
b1
and b2 domains, and also
in central CL–CR area for F20 and N groups in b1
domain. Differences in asymmetry coefficient calculated by the formula
(L–R)/(L+R) are detected in central CL–CR area in q
domain (p=0.035–0.018) between F20, N groups and between F20, F21
groups.
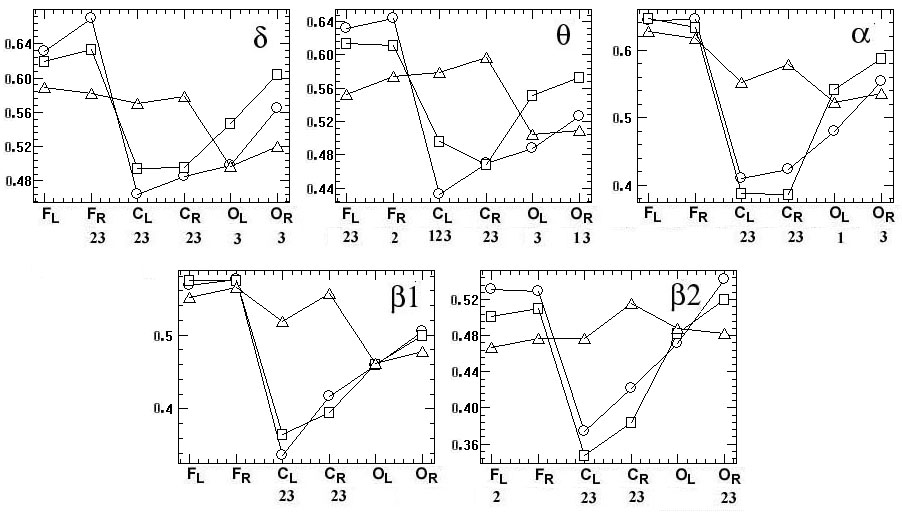
Fig. 5. Regional intrahemispheric differences in frequency domains
(р=0.033–10-8). The averaged values of synchrony for each group
(vertical) in order of regions (horizontal): FL, FR (frontal left and right),
CL, CR (central left and right), CL, CR (occipital left, right), other
notations are similar to Fig. 4.
On the one hand, these asymmetries are not
that numerous so to indicate a general pattern, on the other hand, no case
of asymmetry is revealed in N group.
7. Age and sex differences
In order to identify age–related differences
we divide each group into two subgroups in age ranges 8–11 and 12–15 years
(respectively the number of subgroups is: in F20 category there are 16
and 7 boys, in F21 category – 16 and 20 boys, in N category – 22 and 19
boys). Now let’s make a comparison of these subgroups.
Table 2. Authentic age changes in intrahemispheric
and interhemispheric EEG synchrony in fuve frequency domains.
Remainders are represented between average values of synchrony in
subgroups of 8–11 and 12–15 years old; the significance values are shown
in brackets
 The results are presented in table 2, from
a consideration of which we can make the following conclusions:
The results are presented in table 2, from
a consideration of which we can make the following conclusions:
1. In all detected cases, the differences are associated
with an increase in synchrony with age, and this indicates a presence of
systematic tendency;
2. Intraregional changes of synchrony are most representative
in N group and intrahemispheric ones in F20 group;
3. In a case of the pair comparison of three N, F20,
F21 groups, the most of changes in synchrony topographically do not coincide,
except for following cases: in a
domain in FR region for N, F21 groups, in b1
and b2 domains in CL region
for N, F20 groups, in a
domains for C3?C4 derivation pair for F20, F21 groups and for P3?P4 derivation
pair for N, F20 groups;
4. If we compare the results of table 2 with the charts
at Fig. 4, 5, then the convergence of EEG synchrony with the age to the
norm is observed in pathology groups in interhemispheric connections predominantly
in a domain, whereas as
for relative intrahemispheric relations, the situation is reversed: in
CR region differences increase and in FL, FR, OR regions the higher synchrony
observations are leveled in pathology groups in relation to norm.
Revealed age differences may indicate an
identification feasibility of the differences between norm and pathology
within specific age categories in a case of presence of much more voluminous
experimental material.
The scope of this article do not allow
to consider our available results of analysis of female adolescents, topography
of distribution of EEG synchrony of which in control and pathology groups
has a number of significant local differences and yet maintains the marked
phenomenon of crossbshaped
“downfall" in EEG synchrony at pathology. However, it certainly indicates
that such studies should be performed with taking the gender into account.
8. Comparison with psychometric
measures
For assessment of cognitive functions of patients,
violation of which is one of the main consequences of schizophrenia, the
following four psychometric indices were used:
VDR — volume of direct reproduction defined by technique of memorization
of 10 words under verbal presentation (developed by A.R. Luria in 1962),
this technique is intended to assess the status of voluntary verbal memory,
fatigue, activity of attention, storing, preservation, reproduction, voluntary
attention, etc.:
VSA, VDA — volume of simple and difficult paired associates
(paired–associates learning, PAL); this technique is intended to study
the memory and memory processes;
TS — runtime of Schulte tables execution; this technique
is applied to research a rate of sensomotor reactions and characteristics
of attention, level of intellectual working capacity.
Between these indices for both groups of
patients there were found no significant correlations (except VDA and TS,
which correlation = 0.49), which indicates that there is no strong functional
dependencies between those indices for analyzed samples of patients.
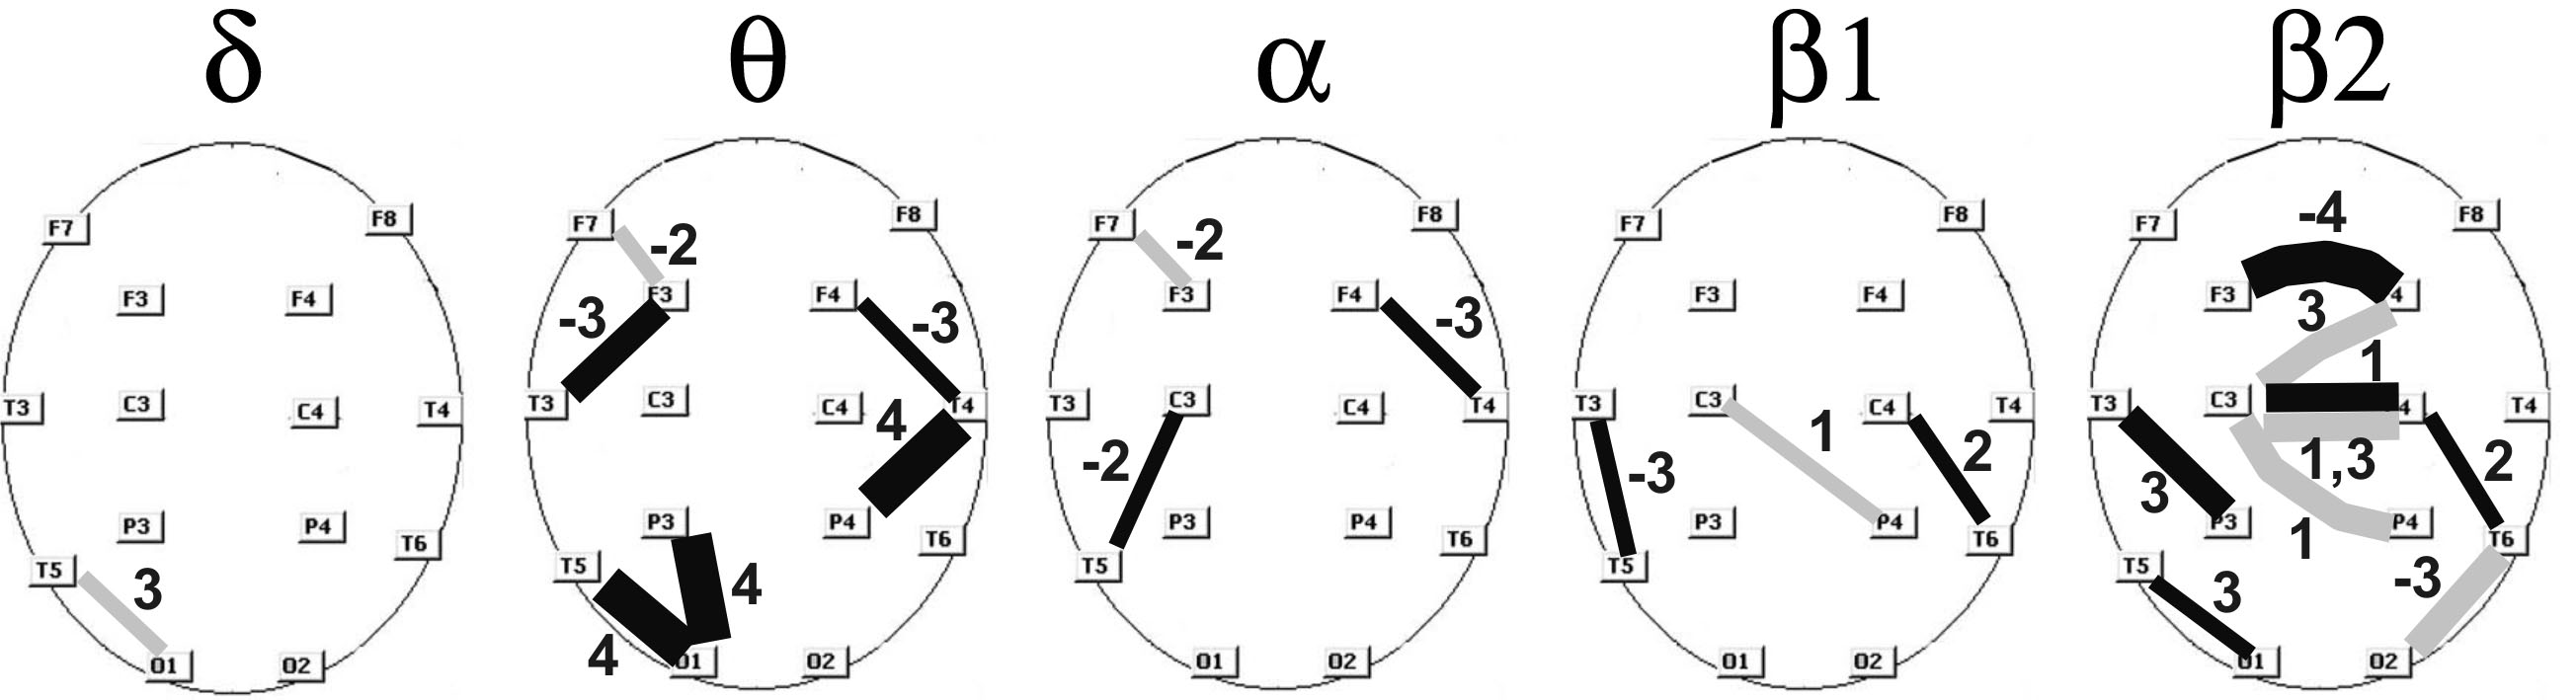
Fig. 6. Significant correlations between synchrony estimates and
psychometric measure (p=0.03–0.008) with the following numbering
notation: 1 – volume of direct reproduction by technique of memorization
of 10 words under verbal presentation; 2 – volume of simple binary associations;
3 – volume of complex binary associations; 4 – runtime of Schulte tables
execution. Color of lines indicates the group of patients: black – F20,
gray – F21, three grades of lines thickness indicate the absolute value
of correlations: 0.45–0.49, 0.5–0.59, 0.6–0.75, the figures at lines indicate
the numbering notation of psychometric measure, "minus" indicates a negative
correlation.
The proximity of estimates of EEG synchrony
to psychometric indices was assessed by Pearson correlation coefficient
r, critical value of which for those samples is rcr<0.31
at p=0.05. Fig. 6 shows the identified significant correlations
with local estimates of EEG synchrony between derivation pairs in the range
of average and above average correlation values (r=0.45–0.75, p=0.03–0.008).
In addition, it is interesting to calculate correlations with the average
estimates of regional intrahemispheric synchronities as well as of differences
between them that characterize the magnitude of decrease of EEG synchrony
in CL, CR regions in relation to neighboring FL, FR, OR, OL regions
.
Table. 3. Correlations between psychometric measures
with intrahemispheric regional synchrony
and with remainders between regional synchrony for five frequency
domains
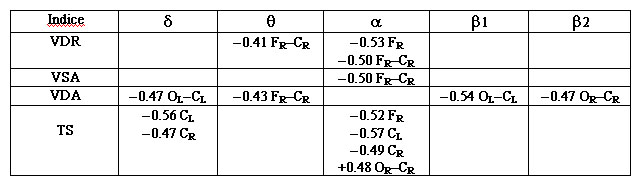 These correlations are presented in table 3.
The received results allow making the following conclusions:
These correlations are presented in table 3.
The received results allow making the following conclusions:
1. The greatest number of significant correlations
with the psychometric indices is revealed for F20 group (25 vs. 9 for F21
group); it is quite consistent with the fact that for schizophrenia category
(F20) the violations of cognitive processes estimated by these psychometric
indices are more expressed.
2. The greatest number of significant correlations
belongs to "downfall" of synchrony for pathology groups in central axial
area and to its remainders with with neighboring regions: 19 significant
correlations against 11 for other areas and derivation pairs.
3. In rank–order of total numbers of significant correlations,
the frequency domains are ranked as follows: b2
– 11 correlations, q –
9, a – 9, d
– 4, b1 – 4. With respect
to local correlations (Fig. 6) b2
and q domains have the
obvious advantage as well as in a case of discriminant classification;
the leading place of b2
domain can be determined by its greater relationship with cognitive activity.
4. In rank–order of significant correlations, the psychometric
indicators are ranged as follows: VDA – 13 correlations, VSA – 11, TS –
10, VDR – 8. According to average value of correlations, the TS index has
a considerable advantage (r=0.70) in comparison with VDR (0.49),
VSA (0.48) and VDA (0.50). The last would seem to indicate that in F20
group (which shows the most number of correlation), the features of attention
and mental performance are more vulnerable compared with the capabilities
of memorizing and reminiscence
5. Signs of correlations for VDA, VSA are opposite
to ones for TS, which corresponds to their psychometric ratio.
6. In high–frequency domains (b1,
b2)
compared with mid–frequency domains (q,
a)
in most cases there are an inversion of signs of correlations, which can
be a result of opposite relationship between the activity of these domains
and the cognitive abilities.
Let us note that in recent years
we can see an increasing interest of researchers to comparison of different
estimates of EEG synchrony on one hand and psychometric and syndromic indicators
of schizophrenic spectrum disorders on the other hand. These studies reveal
the following significant correlations: 0.36–0.52 [2], 0.27–0.39 [1], 0.37–0.82
[8] for a small group of 14 patients, 0.37–0.55 [9], 0.38–0.49 [10]. In
this comparison, the numerous received by us significant correlations between
EEG synchrony estimates and psychometric indices in a range 0.45–0.75 look
rather perspective.
9. Reproducibility of results
In order to test stability of our results obtained
on the basis of stated here methodology, we analyzed another EEG data which
has been recorded in 2001–2004 and discussed in [4]. Two groups of male
adolescents 10–12 years old include: F20 group of 18 patients (in age 12.1–0.93)
and control group of 25 pupils (in age 12.1–0.53). The results turned out
to be similar to Fig. 4 and 5; they are shown in Fig. 7 (identified significant
differences showed p=0.047?10-5). As you can see, these charts are in good
agreement in Fig. 4 and 5 with the exact reproduction of the phenomenon
of cross–shaped "downfall" in EEG synchrony for F20 group. The separate
and not numerous distinctions can be a consequence of narrower age range
of the used groups. The discriminant classification gives an unmistakable
separation of normal and pathological groups in all frequency domains.
Thereby ACS–method possesses sufficient
accuracy and stability, yielding almost identical results on various groups
of examinees and patients.
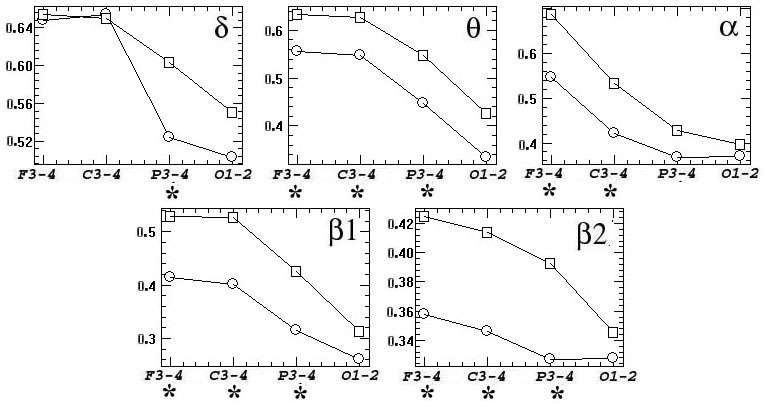
Fig. 7. Differences between synchrony for N and F20 group records
discussed in [4], asterisks denote cases of significant group differences
(p=0.47–10-5) : a – interhemispheric synchrony; b – regional
intrahemispheric synchrony. The remaining notation is similar to Fig. 4,
5.
DISCUSSION
The results of our complex
analysis reveal the complicated picture of regional, interhemispheric and
age differences in EEG synchrony between two disorders of schizophrenic
spectrum and the norm, including interchanging cortical areas with oppositely
directed ratios of higher, lesser or equal synchrony. Apparently, by this
there is determined the noted in the introduction apparent inconsistency
of fragmentary results obtained by other researchers. Disclose of complete
picture of EEG synchrony relations in these studies could be prevented
by: a) uncertainties of coherent analysis [14]; b) small volume of experimental
data [8, 20, 22]; c) absence of selection of EEG records on consistency;
d) absence of separation of groups according to nosological type, age and
sex. However, many of particular conclusions of other researchers find
their counterparts in the considered complex picture: local cases of increase
of intrahemispheric coherence in schizophrenics [18, 20, 27, 29], its decline
in central region [4, 31], reduced interhemispheric synchrony [4, 27],
a violation of frontal–temporal relationships [23].
One of distinctive
and stable components of above considered picture of mental disorders in
comparison with the norm is the presence of the vast areas of low synchrony
separating isolated intrahemispheric (frontal and occipital) areas with
synchrony near to normal level. The presence of such a reduction and detection
of right?sided asymmetry can indicate a substantial violations of interhemispheric
and frontal–occipital relationships for schizophrenic and schizotypal disorder,
which fits into framework of the well–known theory of disintegration of
cortical electrical activity [6, 26] ascending to Bleuler’s studies (1911,
1913). Apparently, in schizophrenic process, a tendency to disintegration
comprises cortical neuronal substrate at different levels, i.e. from local
neuronal ensembles to spatially separated neural networks, which causes
serious disturbances in their interaction [4]. It is considered that one
of direct consequences of this disintegration is represented by observed
violations of cognitive and behavioral functions at patients with schizophrenic
disorders.
The set in this study
additional task of differentiation of two closely related F20 and F21 categories
among the block of disorders of schizophrenic spectrum is especially complicated
because among experts there is still no consensus on a safe separation
criteria for schizophrenia and schizotypal disorder [24]. The significant
differences between F20 and F21 groups appear mainly in frontal and occipital
areas in certain frequency domains. With this in occiput an interhemispheric
and intrahemispheric synchrony for schizophrenia (F20) in some cases was
closer to normal, whereas for schizotypal disorder (F21) intrahemispheric
synchrony is higher than normal, but interhemispheric synchrony is below
than normal. Certain relationships of this kind are also observed in parietal,
temporal and central areas. Apparently, this is due to the fact that criteria
of schizotypal disorder includes, in particular, the presence of unusual
phenomena of perception including somatosensory, auditory and visual illusions
or hallucinations, and as a result of it there can be more drastic deviations
of EEG synchrony from the norm in areas of primary projection of corresponding
analyzers.
On the other hand,
in frontal and some central cortex areas in F20 group there are observed
greater deviations of interhemispheric and intrahemispheric synchrony estimates
from the norm than in the case of schizotypal disorder. This is consistent
with concept of greater safety of frontal cortex at patients of F21 categories
[24]. It is significant that most such deviations in intrahemispheric synchrony
manifest themselves in b2
domain, whose activity is directly related to cognitive activity, and namely
violations of cognitive processes are most typical just for schizophrenia
pathology [24].
We note also that
most of patterns on charts like Fig. 2–5 also appear when we analyze full
amount of data (125 patients), but the performed selection of highly consistency
subgroups (64 patients) improved considerably the reliability of conclusions
about observed differences. Moreover, re–calculating of previous EEG records
of [4] by used here methodology confirms all the above mentioned interhemispheric
and regional relationships with high numerical accuracy. That proves the
stable reproducibility of results in different groups of patients by using
of ACS–method.
These results demonstrate
the high efficiency of ACS–method in differentiation of normal examinees
from patients of different mental disorders by EEC, in what connection
in classifying aspect q
and b2
frequency domains has noticeable advantage. It should also be emphasized
that the efficiency for classification of q
domain was found in our previous paper [13], in the same paper there was
shown an advantage of ACS-method in comparison with other methods of classification
and with other EEG indices.
The present study
also showed that for the reliable differentiation on EEG of various subcategories
within such the complex and multidimensional nosology as psychiatric disorders
of schizophrenic spectrum, it is necessary to use: 1) a bigger volume of
experimental data than it takes place in most cited studies, 2) separate
study of different nosology, age categories and sexual groups; 3) preliminary
extraction of highly consistent EEG records for elimination of extraneous
factors influence.
Apparently the real
progress towards development and implementation of efficient numerical
methods for differentiation of norm and various forms of mental pathology
by EEG is possible upon condition of international cooperation and coordination
of researches. It also requires a formation of an integrated bank of EEG
records (within F2*–block of ICD–10) from the data of various research
& clinical centers differentiated by separate nosology, functional
states, sex, age and other characteristics. One of possible mechanisms
for this integration may be obligation to upload EEG records in standard
EDF?format in such a bank and do it for all articles published in leading
scientific journals. In addition, such publicly–accessible bank will make
the results and theoretical conclusions of EEG studies to be the falsifiable
in sense of Karl Popper. For the purification of such a bank from influence
of extraneous random factors a technique can be used similar to above discussed
extraction of highly consistent EEG records.
Conclusion.
Considered multidimensional results on distinctions of the norm and two
groups of deviations of schizophrenic spectrum in particular: а) the revealed
numerous significant correlations of EEG synchrony estimates with psychometric
indices; c) the high classifying sensibility of the used ACS–method, near
100% reliability; d) the reproducibility of results for different groups
of patients and examinees – all this shows that EEG correlation synchrony
measures can be perspective for use as auxiliary quantitative estimates
(in addition to ranking expert estimates) at diagnostics of mental deviations
of schizophrenic spectrum.
REFERENCES
1. Bob P, Susta M, Glaslova K, Boutros
NN. Dissociative symptoms and interregional EEG cross–correlations in paranoid
schizophrenia. Psychiatry Res 2010; 177: 37–40.
2. Bob P, Palus M, Susta M, Glaslova
K. EEG phase synchronization in patients with paranoid schizophrenia. Neurosc
Lett 2008; 447: 73–7.
3. Boostani R, Sadatnezhad K,
Sabeti M. An efficient classifier to diagnose of schizophrenia based on
the EEG signals. Exp Syst Appl 2009; 36: 6492–99.
4. Borisov SV, Kaplan AYa, Gorbachevskaya
NL, Kozlova IA. Analysis of EEG structural synchrony in adolescents with
schizophrenic disorders. Human Physiology 2005; 31: 255–61.
5. Ford MR, Goethe JW, Dekker
DK. EEG coherence and power in the discrimination of psychiatric disorders
and medication effects. Biol Psychiat 2005; 21: 1175–88.
6. Friston KJ. Theoretical Neurobiology
and Schizophrenia. Brain Med Bull 1996; 52: 644–55.
7. Guevara MA, Corsi–Cabrera
M. EEG coherence or EEG correlation? Int J Psychophysiol 1996; 23: 145–53.
8. Higashima M, Takeda T, Kikuchi
M, Nagasawa T, Hirao N, Oka T, Nakamura M, Koshino Y. State–dependent changes
in intrahemispheric EEG coherence for patients with acute exacerbation
of schizophrenia. Psychiatry Res 2007; 149: 41–7.
9. John JP, Khanna S, Pradhan
N, Mukundan CR. EEG Alpha Coherence and Psychopathological Dimensions of
Schizophrenia. Indian J Psychiat 2002; 44: 97–107.
10. Kubicki M, Styner M, Bouix
S, Gerig G, Markant D, Smith K, Kikinis R, McCarley RW,
Shenton ME. Reduced interhemispheric connectivity in schizophrenia–tractography
based segmentation of the corpus callosum. Schizophr Res 2008; 106: 125–31.
11. Kaplan AYa, Borisov SV, Zheligovskii
VA. Classification of the adolescent EEG by the spectral and segmental
characteristics for normals. Zhurnal Vysshei Nervnoi Deiatelnosti Im. I.P.Pavlova
2005; 55: 478–86.
12. Kulaichev AP. Comparative
Analysis of EEG Correlation Synchronism and EEG Amplitude Relationships
in All?Night Sleep. Zhurnal Vysshei Nervnoi Deiatelnosti Im. I.P.Pavlova
2012; 62: 108–19.
13. Kulaichev AP. The Method
of Correlation Analysis of EEG Synchronism and its Possibilities. Zhurnal
Vysshei Nervnoi Deiatelnosti Im. I.P.Pavlova 2011; 61: 485–98.
14. Kulaichev AP. The Informativeness
of Coherence Analysis in EEG Studies. Zhurnal Vysshei Nervnoi Deiatelnosti
Im. I.P.Pavlova 2009; 59: 766–75. Transl: Neurosci Behav Physiol 2011;
41 (3): 321–328.
15. Kulaichev AP. Some methodical
problems of the frequency analysis of EEG. Zhurnal Vysshei Nervnoi Deiatelnosti
Im. I.P.Pavlova 1997; 47: 918–26.
16. Lastochkina NA., Puchinskaya
LM. Correlation analysis of EEG rhythms and functional asymmetry of the
hemispheres in children with the hyperdynamic syndrome. Neurosci Behav
Physiol 1992; 2: 251–8.
17. Leocani L, Comi G. EEG coherence
in pathological conditions. J Clin Neurophysiol 1999; 16: 548–55.
18. Mann K, Maier W, Franke P,
Rцschke J, Gдnsicke M. Intra– and interhemispheric electroencephalogram
coherence in siblings discordant for schizophrenia and healthy volunteers.
Biol Psychiat 1997; 42: 655–63.
19. Melnikova TS, Lapin IA, Sirkosyan
VV. The review of use of the coherent analysis in psychiatry. Social and
clinical psychiatry 2009; 19: 90–4.
20. Merrin EL., Floyd TC, Fein
G. EEG coherence term in unmedicated schizophrenic patients. Biol Psychiat
1989; 25: 60–6.
21. Morrison-Stewart SL, Williamson
PC, Corning WC, Kutcher SP, Merskey H. Coherence on electroencephalography
and aberrant functional organisation of the brain in schizophrenic patients
during activation tasks. Br J Psychiat 1991; 159: 636–44.
22. Nagase Y, Okubo Y, Matsuura
M, Kojima T, Torua M. EEG coherence in unmedicated schizophrenic patients:
topographical study of predominantly never medicated cases alert. Biol
Psychiat 1992; 32: 1028–34.
23. Norman RM, Malla AK, Williamson
PC, Morrison–Stewart SL, Helmes E, Cortese L. EEG coherence and syndromes
in schizophrenia. Br J Psychiat 1997; 170: 411–5.
24. Siever L, Koenigsberg H,
Harvey P, Mitropoulou V, Laruelle M, Abi?Dargham A., Goodman M., Buchsbaum
M. Cognitive and brain function in schizotypal personality disorder.
Schizophr Res 2002; 54: 157–67.
25. Sakoglu U, Michael AM, Calhoun
VD. Classification of schizophrenia patients vs healthy controls with dynamic
functional network connectivity . Neuroimage 2009; 47: S39–S41.
26. Stephan KE, Friston KJ, Frith
CD. Dysconnection in Schizophrenia: From Abnormal Synaptic Plasticity to
Failures of Self–monitoring. Schizophr Bull 2009; 35: 509–27.
27. Strelets VB, Garakh ZhV,
Novototskii–Vlasov VYu, Magomedov RA. Relationship between EEG power and
rhythm synchronization in health and cognitive pathology. Zhurnal Vysshei
Nervnoi Deiatelnosti Im. I.P.Pavlova 2005; 55: 496–504. Transl: Neurosci
Behav Physiol 2006; 36: 655–62.
28. Tauscher J, Fischer P, Neumeister
A, Rappelsberger P, Kasper S. Low frontal electroencephalographic coherence
in neuroleptic?free schizophrenic patients. Biol Psychiatry 1998; 44: 38–447.
29. Wada Y, Nanbu Y, Kikuchi
M, Koshino Y, Hashimoto T. Photic stimulation in drug–naive patients. Aberrant
functional organization in schizophrenia: analysis of EEG coherence during
rest. Neuropsychobiology 1998; 38: 63–9.
30. Winterer G, Ziller M, Dorn
H, Frick K, Mulert C, Wuebben Y, Herrmann WM. Frontal dysfunction in schizophrenia
– a new electrophysiological classifier for research and clinical applications.
Eur Arch Psychiat Clin Neurosci 2000; 250: 207–14.
31. Winterer G, Egan MF, Rдdler
T, Hyde T, Coppola R, Weinberger DR. An association between reduced interhemispheric
EEG coherence in the temporal lobe and genetic risk for schizophrenia.
Schizophr Res 2001; 49: 129–43.