Mechanisms of Catalytic Action and Chemical Modifications of Endonucleases WEN1 and WEN2 from Wheat Seedlings
L. I. Fedoreyeva1,2 and B. F. Vanyushin1,2*
1All-Russian Research Institute of Agricultural Biotechnology, Russian Academy of Agricultural Sciences, ul. Timiryazevskaya 42, 127550 Moscow, Russia2Belozersky Institute of Physico-Chemical Biology, Lomonosov Moscow State University, 119991 Moscow, Russia; E-mail: vanyush@belozersky.msu.ru
* To whom correspondence should be addressed.
Received March 26, 2012; Revision received July 18, 2012
Hydrolysis of DNA catalyzed by wheat endonucleases WEN1 and WEN2 is pronouncedly processive. A correlation has been revealed between appearance of new products of DNA hydrolysis with different length and conformational changes in the enzymes. The first conformational conversion of the endonucleases is associated with appearance of large fragments of DNA hydrolysis with length longer than 500 bp, and the second conversion is associated with formation of oligonucleotides with length of 120-140 bp, and the third conversion is associated with formation of short oligonucleotides and mononucleotides. Formation of the DNA—enzyme complex is accompanied by appearance of fluorescence at λ = 410-440 nm. The intensity, positions, and numbers of maximums of the fluorescence spectra of DNA—WEN1 and DNA—WEN2 complexes are different and depend on the methylation status of the DNA and on the presence of Mg2+. The endonucleases hydrolyze DNA by two mechanisms: one is metal-independent, and the other depends on one or two Mg2+ ions. One Mg2+ ion is located inside the catalytic center of WEN1, whereas the WEN2 center contains two Mg2+ ions. The first (site-specific) stage of DNA hydrolysis does not depend on Mg2+. Mg2+ ions evoke changes in the site specificity of the endonuclease action (WEN1) and abolish their ability to recognize the methylation status of DNA. Products of DNA hydrolysis by endonucleases WEN1 and WEN2 in the presence of Mg2+ are similar in length (120-140 bp). The endonucleases have at least two centers (domains) – catalytic and substrate-binding. Two histidine and apparently two lysine plus two dicarboxylic amino acid residues are present inside the catalytic center of WEN1. The catalytic center of WEN2 contains at least one histidine residue and apparently two residues of aspartic or glutamic acid, which are involved in coordination of the metal ions. The catalytic centers of WEN1 and WEN2 seem to be formed, respectively, by HD/E(D/EK)KH and HD/ED/E amino acid residues. The site-specificity of the endonuclease action is due to the DNA-binding domain. This domain contains dicarboxylic amino acid residues, which seem to be responsible for sensitivity of the enzymes to the methylation status of DNA. The hydroxyl groups of tyrosine residues in the enzymes also seem to contribute to recognizing methylated bases in DNA.
KEY WORDS: endonucleases, DNA hydrolysis kinetics, catalytic mechanism, DNA methylation, wheat, plantsDOI: 10.1134/S0006297913010057
Abbreviations: bp, base pairs; WEN1, WEN2, wheat endonucleases.
At least two classes of endonucleases are found in plants,
Zn2+-dependent and Ca2+- and
Mg2+-dependent ones [1]. Both these
classes of endonucleases are involved in the process of programmed cell
death. Zn2+-dependent endonucleases are found in
extracellular fluid and in vacuoles, and their activity is maximal at
pH values from 5.0 to 6.5, whereas typical Ca2+- and
Mg2+-dependent endonucleases have optimum neutral pH value.
A Mg2+-dependent nuclease activity involved in the cell
death program was found in the intermembrane space of mitochondria in
arabidopsis plants [2]. Plant
Zn2+-dependent endonucleases ZEN1 from zinnia, BEN1 from
barley [3], and nuclease A from Agropyron
elongate seedlings capable of cleaving both double- and
single-stranded DNAs and RNA are studied most fully [4].
Two endonucleases, WEN1 and WEN2, have been isolated from the vesicular fraction of cells of aging apoptosis-prone coleoptiles of 8-day-old etiolated wheat seedlings [5, 6]. By electrophoresis, the nuclease activities were shown to be associated with proteins with apparent molecular weights of 27 kDa (WEN1) and 43 kDa (WEN2) [5, 6]. The endonuclease WEN1 preferentially cleaves methylated single-stranded DNA and WEN2 mainly cleaves non-methylated double-stranded DNA. These endonucleases can hydrolyze DNA in the absence of metal ions. Ca2+ and/or Mg2+ noticeably modify the activity and effects of these enzymes [5, 6].
The endonuclease WEN1 is a site-specific nuclease that cleaves the DNA sequence 5′-CNG-3′ between the C and N residues [7]. During long-term hydrolysis of DNA (for 2 h and more), the WEN1 and WEN2 enzymes produce oligonucleotides with the length of about 10 bp and mononucleotides. This suggests that WEN1 and WEN2 can display not only endo- but also exonuclease activity [8]. The activities of the endonucleases WEN1 and WEN2 are modulated by S-adenosyl-L-methionine (SAM), which seems to serve as an allosteric effector for these enzymes. SAM inhibits WEN1 and stimulates WEN2 [5, 6]. WEN1 and WEN2 catalyze internucleosomal fragmentation of DNA in isolated nuclei of wheat seedlings and seem to be involved in apoptotic degradation of DNA [9]. In the terminal stages of DNA hydrolysis, these enzymes display exonuclease activity, cleaving large fragments to small oligonucleotides and even to mononucleotides; consequently, they can participate in utilization of nuclear material during apoptosis.
The catalytic properties and molecular mechanisms of plant endonucleases are poorly studied. However, there are some indications for pronounced processive action of these enzymes [8].
The purpose of this work was to study the catalytic mechanisms of WEN1 and WEN2 from wheat seedlings and influences of different chemical modifications on the activity of these enzymes.
MATERIALS AND METHODS
Isolation of vesicular fraction of cells. Seeds of winter wheat cultivar Mironovskaya 808 were sprouted in the dark at 26°C. Eight days later, the wheat seedlings were collected and carefully washed in running water. Separated coleoptiles were homogenized at 4°C in 50 mM Tris-HCl buffer (pH 7.5) supplemented with 0.4 M sucrose (buffer A) and BSA (1 mg/ml). The homogenate was centrifuged for 30 min at 600g, the precipitate was removed, and the supernatant was centrifuged for 30 min at 8000g. The resulting precipitate representing the vesicular fraction [10] was washed several times in buffer A without BSA.
Isolation and purification of endonucleases WEN1 and WEN2. The endonucleases were extracted from the vesicular fraction with 50 mM Tris-HCl buffer (pH 7.5) supplemented with 0.8 M sucrose and 0.4 M NaCl and purified by successive ion-exchange chromatography on DEAE-cellulose, gel filtration through Superdex 200 and 75, and hydrophobic chromatography on Toyopearl HW-50 [5, 6].
The protein concentration was determined spectrophotometrically by absorption at λ = 280 nm and by the Bradford method [11].
Determination of endonuclease activity. We determined endonuclease activities of the enzymes using as substrates phage λ non-methylated DNA (dcm–,dam–) and methylated DNA (dcm+,dam+) (Fermentas, Lithuania). The substrate (1 µg DNA, 2 µl) was supplemented with the enzyme solution (2.0·10–8 M, 3 µl) and with 5 µl of 50 mM Tris-HCl buffer (pH 7.5) (the reaction mixture volume was 10 µl). The reaction mixture was incubated at 37°C for the desired time. Products of DNA hydrolysis were analyzed by electrophoresis in 1.2% agarose gel. The gels were photographed using a Fujifilm FLA 3000 device (Japan). The DNA hydrolysis products were quantitatively analyzed using the GelPro program.
Chemical modification of the enzymes. Histidine residues in the enzymes were modified with 2% solution of diethylpyrocarbonate (DEPC) in 10 mM Tris-HCl buffer (pH 7.5) at room temperature [12]. Generation of N-carboethoxyhistidine residues was tested by increase in absorption of the mixture at λ = 242 nm every 5 min. Histidine residues were also modified in the presence of DNA (1 µg DNA was added to the enzyme solution (2.0·10–8 M)). The excess DEPC was removed by centrifugation on an Amicon 3000 membrane at 2000g for 15 min. The number of modified histidine residues (n) was calculated using the formula:
n = A242 M k/ε [E],
where M is molecular weight of the enzyme, k is an empirical coefficient, ε is the molar absorption coefficient equal to 3200 M–1·cm–1, and [E] is the enzyme concentration.
Lysine/arginine residues were modified with 10% solution of trinitrobenzenesulfonic acid (TNBSA) in 10 mM Tris-HCl buffer (pH 7.5) for 30 min at room temperature [13]. The enzyme was also modified in the presence of DNA. The excess TNBSA was removed as described above. The number of modified amino groups was calculated using data of the differential absorption at λ = 420 nm and the molar absorption coefficient ε = 22,000 M–1·cm–1.
Dicarboxylic amino acid residues were modified with 0.01 M solution of 1-ethyl-3-(3-dimethylaminopropyl)carbodiimide (CDI) (as well as with CDI in the presence of o-dianisidine) in 10 mM Tris-HCl buffer (pH 7.5) at room temperature for 1 h [13]. This modification was also performed in the presence of DNA. The excess CDI was removed as described above. The number of modified aspartic and glutamic amino acid residues was calculated by the above formula using data on the differential absorption at λ = 305 nm and the molar absorption coefficient ε = 16,000 M–1·cm–1.
Changes in the enzyme activities under the influence of the corresponding modifying agents were assessed by comparing DNA hydrolysis products separated by electrophoresis in 1.2% agarose gel before and after their chemical treatment. DNA was hydrolyzed with the modified enzymes as described above for the non-modified enzymes for 30 min at 37°C. To determine the influence of Mg2+ on the enzyme activities, the reaction mixture was supplemented with 3 µl of 0.1 M solution of MgCl2 and 2 µl of 100 mM Tris-HCl buffer (pH 7.5) (the reaction mixture volume was 10 µl).
Fluorescence spectra were obtained using a Perkin Elmer LS 55 spectrofluorimeter (USA). The fluorescence spectra were recorded using a quartz cuvette with 1-cm pathlength with excitation at the wavelength λ = 280 nm. The slit width of the excitation and fluorescence monochromators was 10 nm.
Conformational changes in the endonucleases during hydrolysis of DNA were studied as follows: 1 ml of WEN1 solution (6.0·10–8 M) in 10 mM Tris-HCl buffer (pH 7.5) or 1 ml of WEN2 solution (4.5·10–8 M) in 10 mM Tris-HCl buffer (pH 7.5) was supplemented with the phage λ methylated or non-methylated DNA (3.8·10–9 M). Hydrolysis of the DNA was performed in the presence or in the absence of 3 mM MgCl2 in a thermostatted cuvette at 37°C. The fluorescence spectra were recorded every 3-5 min for 3 h.
The endonucleases were titrated with 1 M MgCl2 solution at 24°C with constant stirring of the reaction mixture. The enzyme concentrations were the same as described above. The fluorescence spectra were recorded 3-5 min after the addition of MgCl2.
The endonucleases were titrated with solution of the phage λ DNA with different methylation status at 24°C as follows: 1 ml of WEN1 solution (6.0·10–8 M) in 10 mM Tris-HCl buffer (pH 7.5) or 1 ml of WEN2 solution (4.5·10–8 M) in 10 mM Tris-HCl buffer (pH 7.5) was supplemented with equal portions of the phage λ DNA (11.3·10–9 M) with constant stirring of the mixture. In experiments in the presence of Mg2+, protein solutions containing 3 mM MgCl2 were used. The fluorescence spectra were recorded 2-3 min after the addition of DNA.
These experiments were performed at least three times. Values of the fluorescence (F) intensities were corrected taking into account dilutions of the enzyme solutions on addition of DNA solutions or Mg2+.
Scatchard plots [14] were calculated from the equation:
r/(L) = n/K – r/K,
where r is the saturation degree of the ligand binding site, L is the molar concentration of the ligand, and K is the dissociation constant. The r value was determined from the fluorescence spectra as r = (F0 – F)/(F0 – F), where F0 is the initial fluorescence intensity (at λ = 315 nm or at λ = 340 nm), F is the fluorescence intensity on addition of DNA solution, F is the maximal fluorescence quenching after which an addition of DNA did not change the fluorescence intensity, (L) is the molar concentration of the added DNA. The maximal experimental error did not exceed 5-6%.
RESULTS AND DISCUSSION
DNA–protein interactions were studied using fluorescence spectroscopy. Comparison of the emission spectra of the DNA–protein complex and of the free protein can give information about changes in the microenvironment of tryptophan and tyrosine residues. Figure 1 presents spectra of the intrinsic fluorescence of the plant endonucleases WEN1 and WEN2. On excitation of the fluorescence due only to tryptophan residues by illumination at λ = 296 nm, the emission spectra of WEN1 and WEN2 have maximums at λ = 331 nm. On excitation of the total fluorescence of the enzymes by illumination at λ = 280 nm, the emission spectra of both endonucleases have two maximums (the common maximum at λ = 315 nm and the other one at λ = 336 nm from WEN2 and at λ = 340 nm from WEN1). The intensity of fluorescence caused by tyrosine residues is higher than of that caused by tryptophan residues (Fig. 1). The presence of two fluorescence maximums seems to be due to a significant distance between the tyrosine and tryptophan residues in the spatial structure of the proteins. Quenching of the emission spectra and/or displacement of their maximums can indicate protein binding with DNA. The binding of the protein with DNA is likely to influence the domain organization of the enzymes. Quenching of the fluorescence of tyrosine as well of tryptophan is mediated by energy transfer from the aromatic amino acid residues onto nucleic acid bases on formation of the DNA–enzyme complex.
Fig. 1. Fluorescence spectra of endonucleases WEN1 and WEN2 on excitation by illumination at λ = 280 nm.
On titration of the endonucleases WEN1 and WEN2 with methylated and non-methylated DNAs, the fluorescence from both tyrosine and tryptophan residues is quenched.
Note that the quenching of the endonuclease fluorescence upon the addition of DNA at room temperature was virtually unchanged for 3-10 min, thus the equilibrium on formation of the enzyme–DNA complex was achieved already in 3 min.
It was shown earlier [5, 6] that hydrolysis of DNA at room temperature goes very slowly. High molecular weight products of DNA hydrolysis were detected in agarose gel only 3 h later. This allowed us to use the quenching of fluorescence for calculating dissociation constants of the endonucleases complexes with DNA using the Scatchard’s method.
Based on the dependence of the relative decrease in fluorescence of endonucleases WEN1 and WEN2 (F/F0) upon addition of DNA on the protein/DNA molar ratio (an example is presented in Fig. 2), it was found that an increase in the enzyme/DNA molar ratio was accompanied by a gradual increase in the ratio F/F0 value up to 1 : 1 [15]. According to these results, one molecule of WEN1 and WEN2 bound to one molecule of DNA, independently of its methylation status. The presence of Mg2+ in the reaction medium did not influence this ratio.
Fig. 2. Dependence of the WEN1 to phage λ methylated DNA molar ratio on the relative quenching of fluorescence on titration of the enzyme with DNA solution.
Based on the fluorescence spectra of wheat endonucleases obtained on titration with DNA, Scatchard plots were plotted [14]. In a simple case of identical and independent binding sites, the equilibrium binding of ligand with macromolecule is described by the equation:
r/(L) = n/K – r/K,
where r is the binding site saturation degree with the ligand determined as r = (occupied site)/[(occupied site) + (vacant site)], L is the ligand concentration, n is the number of binding sites, and K is the dissociation constant. In our case the dependence r/(L) on r (the Scatchard plot) is linear. The slope of the straight line in the Scatchard plot corresponds to 1/K, and the straight line cuts on the ordinate axis a segment n/K and on the abscissa axis a segment equal to n. In all variants, the number n of binding sites was equal to 1 ± 0.1 (data not presented). Thus, WEN1 and WEN2 have one DNA binding site.
From the plots, the dissociation constants of the enzyme complexes with DNA were determined (table). The dissociation constants of the complex of WEN1 with the phage λ methylated DNA (dcm+,dam+) calculated by changes in the fluorescence from tryptophan residues were two times higher than calculated by changes in the tyrosine fluorescence. On the contrary, on titration of endonuclease WEN1 with non-methylated DNA the dissociation constants calculated by changes in the fluorescence from tyrosine residues were twofold higher than calculated by changes in the tryptophan fluorescence. As differentiated from WEN1, dissociation constants of the WEN2 complexes with methylated and non-methylated DNAs determined by changes in the fluorescence from both tryptophan and tyrosine residues display an inverse dependence (table).
Dissociation constants (×109 M–1) of
the complexes of endonucleases WEN1 and WEN2 with phage λ
non-methylated (dam–,dcm–) and
methylated (dam+,dcm+) DNAs
Note: Maximal error of the experiments was no more than 5-6%.
Tyrosine residues can act as nucleophiles during hydrolysis and be constituents of the catalytic centers of some nucleases [16]. Based on our results (table), we supposed that tyrosine residues could be involved in binding DNA and that they should be sensitive to the methylation status of the DNA. On calculation based on the quenching of tyrosine fluorescence, the dissociation constants of the WEN1 complexes with non-methylated DNA were higher than the dissociation constants of complexes with methylated DNA, whereas the dissociation constants of the WEN2 complexes with methylated DNA were higher than its complexes with non-methylated DNA (table).
Titration of endonucleases WEN1 and WEN2 with DNA solution results in appearance of fluorescence in the long-wavelength region of the spectrum (Fig. 3). The fluorescence maximum for WEN1 on titration with non-methylated DNA is at λ = 412 nm. At higher concentrations of DNA, the maximum of the enzyme fluorescence shifts to λ = 420 nm, and another maximum appears at λ = 440 nm. Similar fluorescence spectra were also obtained on titration of WEN1 with methylated DNA (Fig. 3a), but the fluorescence intensity in the longer-wavelength region of the spectrum in this case was about 1.5-fold higher than on the titration of the enzyme with non-methylated DNA (data not presented). On titration of WEN2 with methylated DNA (Fig. 3b) and with non-methylated DNA (data not presented), two emission maximums appeared, at λ = 420 and 440 nm, but in the case of non-methylated DNA the fluorescence intensity was nearly twofold higher than on titration with methylated DNA.
Fig. 3. Titration of endonucleases WEN1 (a) and WEN2 (b) with phage λ methylated DNA. The fluorescence spectra were obtained on excitation with illumination at λ = 280 nm (the titration conditions are described in “Materials and Methods”).
Changes in emission intensity in the long-wavelength region of the fluorescence spectrum did not directly depend on the concentration of DNA. The appearance of fluorescence in this region of the spectrum is thought to be associated with formation of intermediate complexes of enzyme with DNA. The spatial structures of intermediate complexes of WEN1–DNA and WEN2–DNA seem to be different. This seems to be evidenced by positions of the maximums in the long-wavelength region of the fluorescence spectra. This can be due to difference in the amino acid residues in the catalytic centers of WEN1 and WEN2, and, consequently, the catalytic mechanisms of these enzymes may be different.
If the appearance of fluorescence in the long-wavelength region of the spectrum is caused by formation of intermediate enzyme–DNA complexes, the intensity of this fluorescence has to depend on kinetic parameters of these complexes (Michaelis constant (KM) and catalytic constants) [8]. The higher the affinity between the enzyme and the substrate, the higher is the fluorescence intensity. The higher the hydrolysis rate, the shorter is the time of existence of the intermediate complex and the more frequent are fluctuations in the fluorescence intensity. In fact, the KM of methylated DNA hydrolysis with endonuclease WEN1 is 20.8 nM, and the KM of non-methylated DNA hydrolysis is 80.0 nM [8], and the fluorescence intensity in the long-wavelength region of the spectrum on formation of the enzyme complex with methylated DNA is 1.5-fold higher than on formation of the complex with non-methylated DNA. On the contrary, on formation of the complex of WEN2 with non-methylated DNA the fluorescence intensity in the long-wavelength region of the spectrum is twofold higher than on formation of the complex with methylated DNA. The KM of hydrolysis of non-methylated DNA with WEN2 is 26.7 nM, which is nearly four times lower than the KM on hydrolysis of methylated DNA (100.0 nM). This indicates that the studied plant endonucleases can discriminate DNAs by their methylation status.
On titration of endonuclease WEN1 with Mg2+, an increase was observed in intensity of the fluorescence caused by both tyrosine and tryptophan. Figure 4a shows that in 5 mM MgCl2 solution there was a conformational transition accompanied by an increase in the fluorescence intensity. On titration of endonuclease WEN2 with Mg2+, two conformational transitions were revealed at MgCl2 concentrations of 3 and 7 mM (Fig. 4b). These conformational transitions (similarly to those observed in endonuclease WEN1) were accompanied by an increase in the fluorescence intensity. We think that WEN1 has one site for binding metal ions, whereas WEN2 has two such sites.
Fig. 4. Changes in fluorescence intensity (at λ = 340 nm) of endonucleases WEN1 (a) and WEN2 (b) depending on Mg2+ concentration.
Titration of endonuclease WEN1 with solutions of DNA with different methylation status in the presence of Mg2+ (table) revealed that dissociation constants calculated by the fluorescence quenching at λ = 340 nm were higher than the corresponding constants on titration in the absence of Mg2+. Consequently, Mg2+ can influence the binding of the enzyme with DNA. Changes in this binding are accompanied by modulation of the enzyme action that abolishes the ability of the enzymes to recognize the methylation status of DNA, as revealed by electrophoresis of the DNA hydrolysis products [5]. In the presence of Mg2+, both methylated and non-methylated DNAs are hydrolyzed by WEN1 with production of fragments with similar lengths. A similar picture is also observed in the case of endonuclease WEN2 [6]. This is in agreement with previous data showing that in the presence of Mg2+ wheat endonucleases lose their ability to recognize the methylation status of DNA [5, 6]. The lowering of dissociation constants calculated by changes in the fluorescence at λ = 315 nm in the presence of Mg2+ (table), as compared to similar constants obtained in the absence of metal ions, seems to be due to formation of bonds between hydroxyl groups of tyrosine residues with the metal ions and the resulting enhancement of the interaction of WEN2 tyrosine residues with methylated DNA and of WEN1 tyrosine residues with non-methylated DNA. We suppose that tyrosine residues can be located inside the DNA-binding domain of the endonucleases and can be involved in recognizing the DNA methylation status by these enzymes.
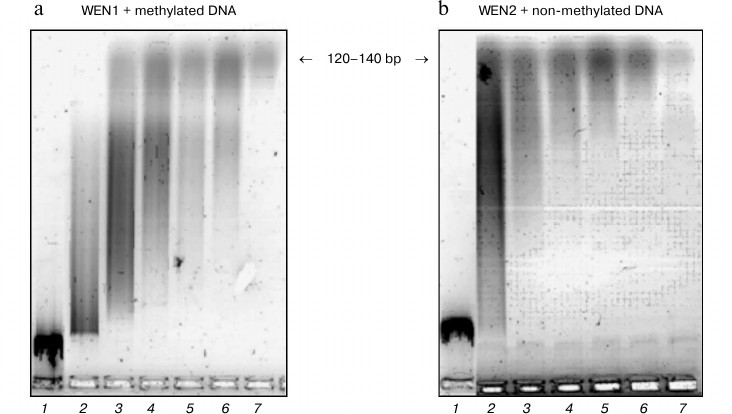
Hydrolysis of DNA with the wheat endonucleases for different time intervals resulted in appearance of fragments with different molecular weights (Fig. 5). In the first stage of hydrolysis, large fragments of DNA are produced. This stage is characteristic for endonuclease WEN1. Then the high molecular weight fraction of DNA is hydrolyzed with production of a number of shorter oligonucleotides, and in the third stage of hydrolysis oligonucleotides with the length of 120-140 bp are produced. The further hydrolysis of the oligonucleotides with the wheat endonucleases results in production of low molecular weight oligonucleotides and of mononucleotides. Hydrolysis of the phage DNA [S] with the plant endonucleases [E] can be represented by the following scheme:
where P1, P2, P3, and P4 are products of different stages of DNA hydrolysis [8].
Fig. 5. Kinetics of phage λ DNA hydrolysis with endonucleases WEN1 (a) and WEN2 (b). Products of DNA hydrolysis were analyzed by electrophoresis in 1.2% agarose gel. Duration of hydrolysis (min): 1) 0; 2) 15; 3) 30; 4) 45; 5) 60; 6) 90; 7) 120.
The hydrolysis of DNA with enzymes WEN1 and WEN2 is associated with a gradual quenching of the intensity of the intrinsic protein fluorescence spectra at λ = 315 and 340 nm. The fluorescence is quenched without sharp jumps, only the slope of the intensity curve changes (data not presented). However, in the long-wavelength region of the fluorescence spectrum significant jump-like changes occur (Fig. 6). As judged from the increase in the fluorescence intensity at λ = 412 nm (Fig. 6a), the first conformational transition in the complex of WEN1 with non-methylated DNA occurs in 40 min. During 2 h, four such conformational transitions were observed: at 40, 60, 110, and 130 min. These conformational transitions were accompanied by a bathochromic displacement of the maximum of the fluorescence spectrum or by a hypochromic displacement of the maximum with appearance of an additional fluorescence (at λ = 439 nm) (spectra not presented). During the hydrolysis of DNA, the WEN1 complex with methylated DNA undergoes four earlier conformational transitions, respectively, at 20, 50, 80, and 110 min (Figs. 5a and 6c). This observation supports our data on the preferential hydrolysis of methylated DNA with endonuclease WEN1. On hydrolysis of differently methylated DNAs with endonuclease WEN2, the enzyme undergoes only three conformational transitions. In the case of the methylated DNA complex with WEN2, there were transitions in the long-wavelength region of the fluorescence spectra at 70, 100, and 130 min, whereas in the case of the non-methylated DNA complex with WEN2 such transitions occurred at 30, 80, and 120 min, respectively. This also can indicate that, as differentiated from WEN1, WEN2 preferentially hydrolyzes non-methylated DNA. Note that during the hydrolysis of non-methylated DNA with WEN2 the fluorescence intensity in the long-wavelength region of the spectrum can increase tenfold, whereas during the hydrolysis with WEN1 the increase is no more than threefold (data not presented). During the hydrolysis of methylated DNA with WEN2, the fluorescence intensity in the same region of the spectrum increases no more than threefold, and during the hydrolysis with WEN1 the fluorescence intensity increases more than sixfold (Fig. 3).
Fig. 6. Changes in fluorescence intensity of endonuclease WEN1 at λ = 412 nm (a, c) and of endonuclease WEN2 (b, d) at λ = 420 nm on hydrolyzing non-methylated DNA (a, b) and methylated DNA (c, d).
Conformational changes observed in enzymes WEN1 and WEN2 in the corresponding stages of DNA hydrolysis correlated with appearance during these stages of oligonucleotides with definite lengths (Figs. 5 and 6). Thus, on the first conformational change in WEN2, DNA is hydrolyzed with production of high molecular weight fragments. The second conformational transition is associated with appearance of oligonucleotides with length of 120-140 bp, and during the third stage low molecular weight oligonucleotides and mononucleotides are produced.
We studied a possible role of histidine and lysine/arginine amino acid residues and also of dicarboxylic amino acid residues in the catalysis of DNA hydrolysis with the wheat endonucleases.
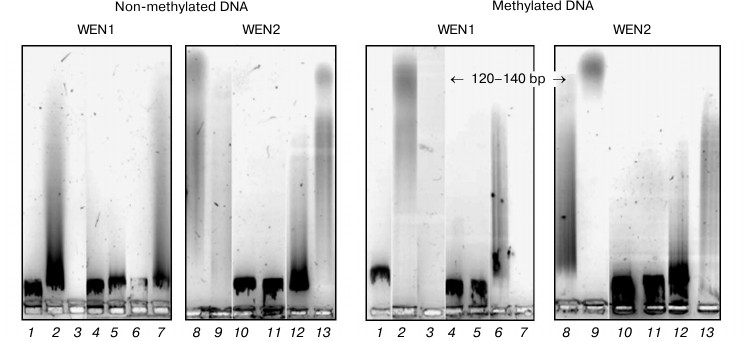
Histidine residues in endonucleases WEN1 and WEN2 were modified with diethylpyrocarbonate (DEPC) in the absence and in the presence of DNA. The treatment with DEPC completely abolished the enzymatic activity of the endonucleases (Fig. 7). Hydroxylamine destroys N-carboethoxyhistidine and virtually completely recovers the enzyme activity. This confirms that the DEPC-caused modification has affected just histidine residues of the enzyme. The presence of DNA in the reaction mixture protects the endonuclease WEN2 against the inhibitory effect of DEPC (Fig. 7). The prevention by DNA of the activity loss by endonuclease WEN2 seems to indicate that histidine residues may be involved in binding to DNA. However, DNA does not protect enzyme WEN1 against the inhibitory effect of DEPC. Addition of Mg2+ to the reaction mixture with the modified endonuclease WEN1 recovered the enzymatic activity if the modification was performed in the presence of DNA. It seems that Mg2+can contribute to activation of water molecule during the nucleophilic cleavage of DNA with the modified endonuclease WEN1. Different protective effects of DNA during modification of histidine residues in WEN1 and WEN2 seem to indicate different action mechanisms of these enzymes.
Fig. 7. Analysis in 1.2% agarose gel of phage λ DNA hydrolysis products with endonucleases WEN1 and WEN2 modified at histidine residues. 1) Control (DNA); 2, 8) DNA + enzyme; 3, 9) DNA + enzyme + Mg2+; 4, 10) DNA + DEPC-modified enzyme; 5, 11) DNA + DEPC-modified enzyme + Mg2+; 6, 12) DEPC-modified enzyme in the presence of DNA; 7, 13) DEPC-modified enzyme in the presence of DNA + Mg2+.
The modification of histidine residues in endonucleases WEN1 and WEN2 with diethylpyrocarbonate was accompanied by an increase in absorption at λ = 240 nm. The comparison of differential absorption spectra of the modified and initial enzymes revealed that the modification resulted in formation of N-carboethoxyhistidine residues. Addition of hydroxylamine decreased the absorption of the reaction mixture at λ = 240 nm. This indicated that the modification affected just histidine residues. As judged from the differential absorption spectra, there were two modified histidine residues in WEN1 and in WEN2. However, the modification with DEPC in the presence of DNA, independently of the DNA methylation status, affected two histidine residues in WEN1 and only one in WEN2. And the endonuclease WEN2 activity is partially retained in the presence of DNA, whereas modified WEN1 in the presence of DNA displays weak activity only in the presence of Mg2+. The active site of endonuclease WEN2 seems to contain only one histidine residue, and it does not bind directly with the phosphate group of DNA but binds with it through a water molecule. Because the involvement of a histidine residue in the activation of the water molecule is a necessary stage in hydrolysis of DNA, modification just of this residue results in partial inactivation of the enzyme. The presence of DNA during the enzyme modification with DEPC does not prevent the modification of this histidine residue. The other histidine residue can be located in the DNA-binding site of endonuclease WEN2.
Metal-independent nucleases contain the most widely distributed motif HKD, and they hydrolyze DNA by a two-step mechanism producing through phosphohistidine an intermediate enzyme–substrate complex [17, 18]. The site-specific recognition of DNA is realized by the enzyme region responsible for binding DNA, which is different from the catalytic center in amino acid composition.
Although endonuclease WEN1 is a metal-dependent enzyme, histidine is also one of the key amino acid residues necessary for manifestation of the hydrolytic activity of this protein. We think that the catalytic center of this enzyme includes two histidine residues similarly to the metal-independent restriction endonuclease Bfil (E, N, K, H)2 [19]. In restriction endonuclease Bfil, one His residue acts as nucleophile, whereas the other residue is used as a basic acid for protonation of the group to be cleaved. Slight recovery by Mg2+ of the enzymatic activity of endonuclease WEN1 on modification with DEPC in the presence of DNA seems to indicate that Mg2+ can partially replace the histidine residue functionally.
Dicarboxylic acids play a very important role in the active (catalytic) center of the nucleases. They are involved in binding metal ions. Carboxyl groups were modified with carbodiimide. Based on differential absorption spectra at λ = 305 nm of the modified and native endonucleases, the number of modified dicarboxylic acid residues was calculated. In endonuclease WEN1, 28 dicarboxylic amino acid residues were modified. Modification of aspartic acid/glutamic acid residues in the presence of DNA depends on the status of the DNA methylation. In the presence of methylated DNA in WEN1, 26 residues of acidic amino acids are modified, and in the presence of non-methylated DNA, 27 residues are modified. In endonuclease WEN2 carbodiimide can modify 30 aspartic acid/glutamic acid residues. In the presence of non-methylated and methylated DNA, 26 and 27 amino acid residues, respectively, are modified.
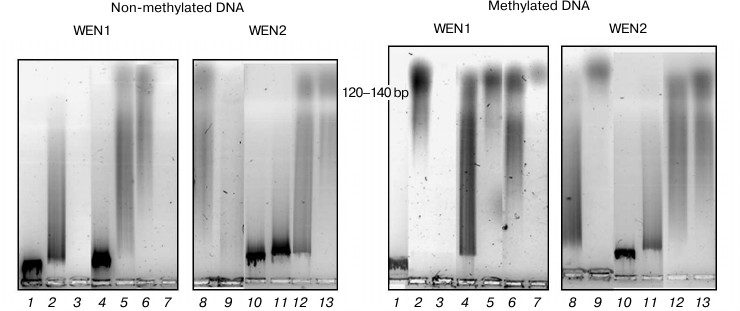
Figure 8 shows the influence of modification of free carboxyl groups of the endonucleases on the enzyme activity. Modification of aspartic acid/glutamic acid residues resulted in complete loss of the ability of endonuclease WEN1 to hydrolyze non-methylated DNA. However, addition of Mg2+ into the reaction mixture partially recovered the enzymatic activity. Modification of these amino acid residues in endonuclease WEN1 led to a partial loss of the enzymatic activity during hydrolysis of methylated DNA. Mg2+ activated endonuclease WEN1 until the stage of formation of low molecular weight oligonucleotides and mononucleotides. Hydrolysis of DNA (especially of methylated DNA) with endonuclease WEN1 with modified dicarboxylic amino acid residues in the presence of Mg2+ activated the stage of production of oligonucleotides with the length of 120-140 bp (Fig. 8). Modification of dicarboxylic amino acid residues in endonuclease WEN2 abolished its ability to hydrolyze non-methylated DNA and had virtually no influence on its activity during hydrolysis of methylated DNA (Fig. 8). Note that the degree of inhibition of the enzymes with modified dicarboxylic amino acid residues in the presence of DNA depended on the methylation status of the DNA. Note also that methylation of DNA usually inhibited the cleavage by nucleases [20]. As discriminated from endonuclease WEN2, endonuclease WEN1 preferentially hydrolyzes methylated DNA. On modification of dicarboxylic amino acids in endonuclease WEN1, methylated DNA in the incubation medium protected two amino acid residues, whereas non-methylated DNA protected one residue. In the case of endonuclease WEN2, non-methylated DNA prevented the modification of four amino acid residues, whereas methylated DNA protected three residues. It seems that the endonucleases from wheat seedlings possess at least one residue of aspartic or glutamic acid that is responsible for recognizing the methylated site of DNA.
Fig. 8. Analysis in 1.2% agarose gel of phage λ DNA hydrolysis products from the reaction catalyzed by endonucleases WEN1 and WEN2 modified at dicarboxylic amino acid residues. 1) Control (DNA); 2, 8) DNA + enzyme; 3, 9) DNA + enzyme + Mg2+; 4, 10) DNA + enzyme modified with carbodiimide (CDI); 5, 11) DNA + CDI-modified enzyme + Mg2+; 6, 12) CDI-modified enzyme in presence of DNA; 7, 13) CDI-modified enzyme in the presence of DNA + Mg2+.
Arginine/lysine amino acid residues can also contribute to hydrolysis of DNA with the endonucleases directly attacking phosphate groups of DNA. Amino acid residues containing free amino groups were modified with trinitrobenzenesulfonic acid (TNBSA). From the differential absorption spectra of the modified and initial enzymes, the number of modified amino groups was calculated. In endonuclease WEN1, 18 lysine/arginine groups were modified. On modification in the presence of non-methylated DNA, 15 residues were modified, and in the presence of methylated DNA there were 14 modified residues. On treatment of endonuclease WEN2 with TNBSA, 24 lysine/arginine residues were modified. In the presence of non-methylated DNA the number of such modified residues decreased to 21, and in the presence of methylated DNA it decreased to 20.
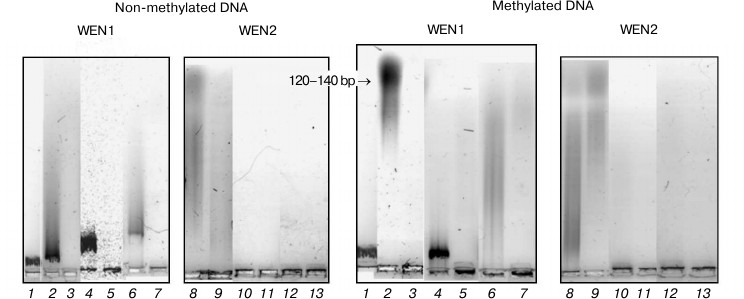
Modification of lysine/arginine amino acid residues abolishes the ability of endonuclease WEN1 to hydrolyze DNA independently of its methylation status (Fig. 9). DNA protects endonuclease WEN1 against the inhibitory effect of TNBSA. The TNBSA-inactivated endonuclease WEN1 nearly completely recovers its activity upon addition of Mg2+. It seems that Mg2+ acts similarly to Arg/Lys residues inside the catalytic center of endonuclease WEN1. Modification of lysine/arginine residues in endonuclease WEN2 did not cause the loss of the enzymatic activity, but it even activated the enzyme. Modification in the presence of DNA also activated the enzyme. It seems that Arg/Lys residues are not constituents of the catalytic center of WEN2. The presence of DNA during modification of Arg/Lys residues prevents the modification of three or four such residues; it seems that they may be involved in the enzyme binding to DNA. An increase in the activity of endonuclease WEN2 due to this modification can be caused by changing the charge around the catalytic center of the enzyme. Neutralization of the positive charge of the center changes the specificity of the enzyme action. The modified endonuclease WEN2 acts as an exonuclease even without addition of metal ions (Fig. 9). It seems that modified Arg/Lys residues covalently bind with the 3′-OH group resulting upon hydrolysis of the phosphodiester bond, and this complex activates hydrolysis of DNA with exonuclease character [8]. Consequently, Arg/Lys residues of endonuclease WEN2 are important for manifestation of exonuclease but not of endonuclease activity.
Fig. 9. Analysis in 1.2% agarose gel of phage λ DNA hydrolysis products from the reaction catalyzed by endonucleases WEN1 and WEN2 modified at dicarboxylic amino acid residues. 1) Control (DNA); 2, 8) DNA + enzyme; 3, 9) DNA + enzyme + Mg2+; 4, 10) DNA + enzyme modified with TNBSA; 5, 11) DNA + TNBSA-modified enzyme + Mg2+; 6, 12) TNBSA-modified enzyme in presence of DNA; 7, 13) TNBSA-modified enzyme in the presence of DNA + Mg2+.
It has been shown above that DNA cleavage with endonuclease WEN1 to oligonucleotides with length of 120-140 bp occurs in the presence of one metal ion in the catalytic center, whereas for hydrolysis of DNA with endonuclease WEN2 two metal ions are necessary. During this stage of DNA hydrolysis, neither WEN1 nor WEN2 can recognize its methylation status. And both histidine residues and hydroxyl groups of deoxyribose produced on the metal-independent stage of DNA hydrolysis to large oligonucleotides act as nucleophiles. Residues of dicarboxylic amino acids coordinate Mg2+. In endonuclease WEN1, this process seems to be contributed by one aspartic or glutamic acid residue, whereas in WEN2 two or more such residues may be involved. In WEN1, Arg/Lys residues are important for manifestation of the enzymatic activity, and they seem to be constituents of the enzyme active center. As differentiated from WEN1, there are no lysine residues in the active center of WEN2.
We think that hydrolysis of DNA with the wheat endonucleases through the metal-independent and metal-dependent pathways is realized inside the same catalytic center. We have shown that some amino acid residues included in the active center can be functionally substituted by metal ions. Thus, modification of lysine residues in endonuclease WEN1 abolishes the enzyme activity, but addition of Mg2+ to the reaction medium activates hydrolysis of DNA.
Thus, the catalytic centers of endonucleases WEN1 and WEN2 are different in amino acid motifs. Schematically, the DNA hydrolysis can be presented as follows. In the first stage, the enzyme binds to DNA producing an intermediate complex. The catalytic center of endonuclease WEN1 contains two histidine residues and, possibly, two dicarboxylic amino acid residues. Dicarboxylic amino acid residues inside the binding domain are likely to determine the sensitivity of the endonuclease to the methylation status of DNA. Hydroxyl groups of tyrosine residues seem to bind with amino groups of DNA bases, or a hydrophobic contact may arise between the aromatic ring of tyrosine and the methyl group of a heterocyclic base of the DNA. This can determine the sensitivity of the endonuclease to the methylation status of DNA.
The catalytic center of WEN1 includes HD/E(D/EK)KH. The motif HUH (HNH) is present in the catalytic center of endonuclease G, the activity of which requires one metal ion [21]. It may be that in the presence of Mg2+ endonuclease WEN1 hydrolyzes DNA through this mechanism. The catalytic center of endonuclease WEN2 includes at least one histidine residue and, possibly, two Asp/Glu residues, which can contribute to coordinating two metal ions. It seems that the catalytic center of WEN2 contains the motif HD/ED/E. In the catalytic center of restriction endonucleases the motif DEK is detected most often [22-24]. In other enzymes the glutamic acid residue can be substituted by Q, D, N, H, or S, and the lysine residue by E, Q, D, S, N, or T. Although endonuclease WEN2 is not highly specific to definite regions of DNA, as differentiated from bacterial restriction endonucleases, we think that the action mechanism of the plant enzyme WEN2 depends on two metal ions.
This work was performed with equipment of the Center of Common Use of the All-Russian Research Institute of Agricultural Biotechnology, Russian Academy of Agricultural Sciences, and was partially supported by the Russian Foundation for Basic Research (project 11-04-00026-a).
REFERENCES
1.Aleksandrushkina, N. I., and Vanyushin, B. F.
(2009) Fiziol. Rast., 56, 11-17.
2.Perez-Amador, M. A., Alber, M. L., Rocher, J. D.,
Thompson, D. M., Hoof, A. V., LeBrasseur, N. D., Ler, A., and Green, P.
J. (2000) Plant Physiol., 122, 169-180.
3.Aoyagi, S., Sugiyama, M., and Fukuda, H. (1988)
FEBS Lett., 429, 134-138.
4.Yupsanis, T., Symeonidis, L., Kalemi, T., Moustaka,
H., and Yupsani, A. (2004) Plant Physiol. Biochem., 42,
795-802.
5.Fedoreyeva, L. I., Sobolev, D. E., and Vanyushin,
B. F. (2007) Epigenetics, 2, 50-53.
6.Fedoreyeva, L. I., Sobolev, D. E., and Vanyushin,
B. F. (2008) Biochemistry (Moscow), 73, 1000-1006.
7.Fedoreyeva, L. I., and Vanyushin, B. F. (2011)
Biochemistry (Moscow), 76, 651-657.
8.Fedoreyeva, L. I., and Vanyushin, B. F. (2012)
Biochemistry (Moscow), 77, 485-491.
9.Fedoreyeva, L. I., Smirnova, T. A., Kolomiitseva,
G. Y., and Vanyushin, B. F. (2009) Biochemistry (Moscow),
74, 145-152.
10.Bakeeva, L. E., Kirnos, M. D., Aleksandrushkina,
N. I., Kazimirchyuk, S. B., Shorning, B. Y., Zamyatnina, V. A.,
Yaguzhinsky, L. S., and Vanyushin, B. F. (1999) FEBS Lett.,
457, 122-125.
11.Bradford, M. M. (1976) Analyt. Biochem.,
72, 248-254.
12.Jois, P. S., Madhu, N., and Rao, D. N. (2008)
Biochem. J., 410, 543-553.
13.Eyzaguirre, J. (1996) Biol. Res.,
29, 1-11.
14.Scatchard, D. (1949) Chem. Rev.,
44, 7-35.
15.Favicchio, R., Dragan, A. I., Kneate, G. G., and
Read, C. M. (2009) in Methods in Molecular Biology.
DNA–Protein Interactions, 543, 589-611.
16.Beese, L. S., and Steitz, T. A. (1991) EMBO
J., 10, 25-33.
17.Stuckey, J. A., and Dixon, J. E. (1999) Nature
Struct. Biol., 6, 278-284.
18.Grindley, N. D., Whiteson, K. L., and Rice, P. A.
(2006) Annu. Rev. Biochem., 75, 567-605.
19.Grazulis, S., Manakova, E., Roessle, M.,
Bochtler, M., Tamulatiene, G., Huber, R., and Siksnys, V. (2005)
Proc. Natl. Acad. Sci. USA, 102, 15797-15802.
20.Buttner, S., Eisenberg, T., Carmona-Gutierrez,
D., Ruli, D., Knauer, H., Ruckenstuhl, C., Sigrist, C., Wissing, S.,
Kollroser, M., Frohlich, K. U., Sigrist, S., and Madeo, F. (2007)
Mol. Cell, 25, 233-246.
21.Ban, C., and Yang, W. (1998) EMBO J.,
17, 1526-1534.
22.Lee, J. Y., Chang, J., Josheph, N., Ghirlando,
R., Rao, D. N., and Yang, W. (2005) Mol. Cell, 20,
155-166.
23.Newman, M., Lunnen, K., Wilson, G., Greci, J.,
Schildkraut, I., and Phillips, S. E. (1998) EMBO J., 17,
5466-5476.
24.Suck, D., Oefner, C., and Kabsch, W. (1984)
EMBO J., 3, 2423-2430.