Dynamic Phase Microscopy Reveals Periodic Oscillations of Endoplasmic Reticulum during Network Formation
T. V. Vyshenskaya1,2, V. P. Tychinsky2,3, D. G. Weiss2, and S. A. Kuznetsov1,2*
1Faculty of Physics and Faculty of Biology, Lomonosov Moscow State University, 119899 Moscow, Russia2Institute of Biological Sciences, University of Rostock, 18059 Rostock, Germany; fax: +49-381-498-6302; E-mail: sergei.kuznetsov@uni-rostock.de
3Faculty of Optoelectronics, Moscow State Institute for Radioengineering, Electronics and Automation, 117454 Moscow, Russia
* To whom correspondence should be addressed.
Received April 11, 2014; Revision received May 26, 2014
Dynamic phase microscopy was used to study the dynamic events of formation of the endoplasmic reticulum (ER) in interphase-arrested Xenopus egg extract. We have shown that the ER periodically oscillated in an ATP-dependent manner in the frequency range of 1.6-2.2 Hz, while the tubular membrane network formed in vitro. The spectral density, i.e. the pattern of a given frequency component in the Fourier spectrum, was strongly correlated with the dynamic events during microtubule-dependent and microtubule-independent ER network formation observed by video-enhanced contrast differential interference contrast and fluorescence microscopy. Because the 1.6-2.2 Hz frequency of oscillation during the network formation was detected both in the presence and absence of microtubules, it appears to be an intrinsic ATP-dependent ER membrane property. Several characteristic active and inactive stages of ER network formation were observed both in the presence and absence of microtubules. However, data analysis of these stages indicated that microtubules and dynein motor activity have a strong influence and a cooperative effect on the kinetics of ER formation by controlled fusion reaction.
KEY WORDS: endoplasmic reticulum, membrane fusion, membrane oscillations, microtubules, dynein, Xenopus, coherent microscopyDOI: 10.1134/S0006297914090077
Abbreviations: DP microscopy, dynamic phase microscopy; ER, endoplasmic reticulum; OPD, optical path difference; VEC-DIC microscopy, video-enhanced contrast differential interference contrast microscopy.
The endoplasmic reticulum (ER) is a large membranous organelle that
forms an extensive polygonal network of tubules, which extend
throughout the cell. This network is highly dynamic and continuously
undergoes formation of new membrane tubules that fuse with each other
and move relative to one another [1, 2]. An excellent system to study the ER network
formation in vitro is the extracts isolated from the eggs of the
frog Xenopus laevis and arrested in interphase or metaphase.
Using interphase-arrested extract Allan and Vale [3, 4] and Steffen et al. [5] have demonstrated that microtubules and the
microtubule-dependent cytoplasmic motor dynein are involved in the
formation of ER networks and play a central role in its stimulation.
However, ER network formation in interphase-arrested extract could also
occur independently of microtubules and microtubule-based motors by
membrane fusion, for which cytosolic factors were required [6, 7]. However, a 3-4-times longer
incubation period was necessary for the ER network formation in the
absence of microtubules ([6], this report).
Therefore, two mechanisms – microtubule-dependent and a
microtubule-independent – appear to be involved in ER network
formation in interphase-arrested extract and both mechanisms require
ATP [3, 6]. How and whether
these mechanisms are interlinked in vivo and in vitro is
not clear. The ER network was also observed in metaphase-arrested
extracts [8]. However, in this case the process of
network formation depends not on microtubules, but rather on
myosin V-driven motility along actin filaments [8].
To investigate ER network formation in temporal and spatial modes in more details, we used the method of dynamic phase (DP) microscopy, which allows measuring the dynamic changes of ER during network formation both near the glass surface and in the bulk of the solution. We found that in interphase-arrested extract during network formation the ER periodically fluctuated at a frequency about 2 Hz. The oscillation was found to be an intrinsic property of ER undergoing network formation both in the presence and absence of microtubules. Microtubules and dynein motor activity stimulated not only the formation of ER networks; they also stimulated their oscillation and changed the dynamic properties of the ER membranes.
MATERIALS AND METHODS
Dynamic phase microscopy. DP microscopy [9-11] was used to study dynamic processes in Xenopus egg cytoplasmic extracts. Briefly, DP microscopy is based on the assumption that any process within or associated with an object of interest (conformal transitions, movements of particles, etc.) is accompanied by a local change of effective refractive index and corresponding OPD (optical path difference) value. For dynamic objects the local OPD at any given point is not constant over time. Thus, the recording of periodic OPD measurements at a given point provides information about a local process. A simultaneous recording of OPD at many distinct points provides information concerning spatial correlation of the process. Digitized OPD values vs. time called track-diagrams are obtained by periodically scanning along a chosen scan-line and stored for further processing. The recorded track-diagram at a given point of scan-line provides information about the temporal processes at this point and contains the data concerning the spatial dependence on fluctuation intensity. The Fourier transform of the track-diagram record yields the corresponding spectrum of local fluctuations. The sum of these spectra at all points along a scan-line is presented as a 2D spectral pattern showing the location and spectral density ρ(x, F) of dominating frequencies of OPD fluctuations of each point along the scan-line. The high accuracy in measuring local fluctuations of OPD is the main advantage of the DP microscopy, thereby exceeding the classical resolution limit 4-6-fold for objects with sufficiently high OPD values.
The used computer phase microscope Airyscan (Russia) was an interference microscope according to the Linnik layout, with phase modulation of the reference wave [11, 12]. A He-Ne laser (λ = 633 nm, 1 mW) was used as the coherent light source and a dissector image tube (model LI-620; Elektron, Russia) as a coordinate-sensitive photodetector. The size of the observation field could be changed from 5 × 5 to 50 × 50 µm2, depending on the lens magnification.
Data acquisition and processing was carried out with the image processing software package MIREA (Moscow, Russia). The acquisition time of digital phase images was 16.4 s for a 128 × 128 pixel raster of an 8 × 8 µm2 viewing field. The noise-limited sensitivity was hmin = 0.5 nm. The software generated pseudo-color phase images of an object in OPD values at each pixel.
Video-enhanced differential interference contrast (VEC-DIC) and fluorescence microscopy. VEC-DIC microscopy [13-15] was performed as described in [5, 8]. A Nikon Diaphot 300 inverted microscope (Nikon GmbH, Germany) equipped with an oil immersion condenser (NA 1.4), 100× DIC PlanApo oil objective (NA 1.4), and mercury arc lamp (HBO 100) was employed. A Hamamatsu C2400-07 Newvicon camera was used for acquiring DIC images (Hamamatsu Photonics Deutschland GmbH, Germany). The analog and digital processing of VEC-DIC signals was performed using an ARGUS 20 real time image processor (Hamamatsu Photonics, Japan). The images were captured directly from the ARGUS 20 image processor into a computer equipped with an LG-3 frame grabber (Scion Corporation, USA) using IPLab Spectrum software (Scanalytics Inc., USA).
For fluorescence microscopy, a Nikon Eclipse 800 microscope (Nikon GmbH) equipped with an oil immersion condenser (NA 1.4), 60× DIC PlanApo oil objective (NA 1.4) and mercury arc lamp (HBO 100) was used. A Spot camera (Visitron Systems GmbH, Germany) was used for acquiring fluorescence images. Single frame images were captured into a computer using MetaMorph software (Universal Imaging Inc., USA).
Materials and sample preparation. Interphase cytoplasmic extract was isolated from Xenopus eggs as described by Steffen et al. [5]. For DP microscopy, 5-7 µl of the extract was diluted 1 : 3 (v/v) with acetate buffer (100 mM sodium acetate, 2.5 mM magnesium acetate, 5 mM EGTA, 10 mM HEPES, 50 mM sucrose, 1 mM dithiothreitol, pH 7.2) supplemented with 2 mM ATP or ATP regenerating system (1 mM ATP, 50 µg/ml creatine kinase and 10 mM creatine phosphate) and placed into a chamber consisting of a cover slip and a small polished silicon plate that served as a mirror of the interferometer. This sandwich was held in a metal frame and sealed.
For fluorescence microscopy, 5-7 µl of Xenopus cytoplasmic extract diluted 1 : 3 (v/v) with acetate buffer supplemented with ATP regenerating system and 1 µg/ml DiCO6 (3,3′-dihexyloxacarbocyanine iodide) was placed on a slide, covered with a coverslip, and sealed with VALAP (Vaseline–lanolin–paraffin 1 : 1 : 1).
For some experiments the extracts were diluted with acetate buffer containing one the following agents: 1% Triton X-100, 50 µM nocodazole, 5 U hexokinase with 15 mM D-glucose, 100 µM orthovanadate, 2 µM okadaic acid, or 0.5 mg/ml of m74-2 monoclonal anti-dynein IC antibody [5].
Unless stated otherwise all reagents were from Sigma-Aldrich Chemie GmbH (Germany).
RESULTS
VEC-DIC and fluorescence microscopy of ER network formation. Incubation of interphase-arrested extract from Xenopus eggs at room temperature led to the formation of an extensive tubular membrane network of ER in vitro. Membrane plaques became attached to the surface and membrane tubules were pulled out by moving along microtubule tracks in a dynein-dependent manner (Fig. 1a). Evenly spread membrane networks were established within 20 min (Fig. 1b). Inhibition of microtubule assembly by nocodazole or the dynein motor by dynein-specific antibody or by vanadate prevented the microtubule-dependent ER network formation [5]. Nevertheless, in the presence of nocodazole the ER networks started to form without microtubules after 60 min of extract incubation and an evenly spread membrane network could be observed within 90 min (Fig. 1c) [6]. Thus, that there are two processes responsible for ER network formation in Xenopus egg extract, a microtubule/dynein-dependent process and a microtubule-independent process, and there is a particular timing associated with the two processes. We suggest that the first phase is initiated by the polymerization of microtubules and the motor function of cytoplasmic dynein, while the second phase, which occurs about an hour later, is initiated by unknown cytosolic factors that modify and control the membrane fusion reaction.
Fig. 1. Comparison of fluorescence and DP images of ER network. a, b) Images taken by fluorescence microscopy at 7 and 20 min after initiation of ER network formation in the presence of microtubules. c) Image taken by fluorescence microscopy at 90 min after initiation of ER network formation in the absence of microtubules. d) Enlarged image of the 6 × 8 µm area shown in (b). e) Pseudo color digital phase image (6 × 8 µm or 96 × 128 pixel) taken by DP microscopy 10 min after induction of ER network formation. The ER network just started to form. f) Pseudo color digital phase image (6 × 8 µm or 96 × 128 pixel) taken 20 min after induction of ER network formation. The ER network has formed. g) The scale of OPD values in nm for the digital phase images (e, f).
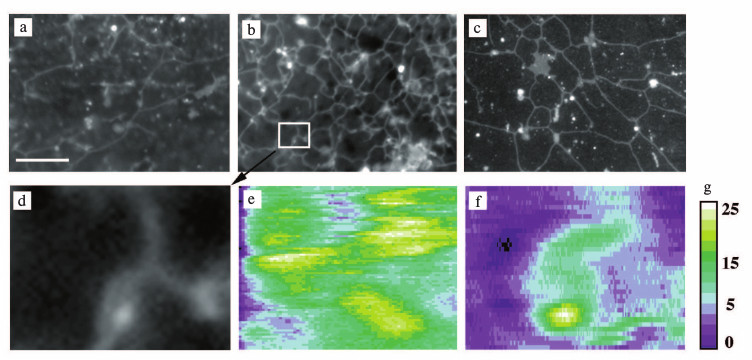
Digital phase images of ER during network formation. Since the local fluctuations of optical path difference (OPD) in biological specimens can be measured with high accuracy by DP microscopy (see “Materials and Methods”), we used this method to analyze dynamic processes during ER network formation.
Within the first 5 min of extract incubation, when microtubule assembly was taking place and ER networks just started to form, very few objects with high OPD contrast were detectable by DP microscopy (data not shown). After 10 min of incubation, when the ER network could clearly be observed by VEC-DIC and fluorescence microscopy, objects with high OPD contrast could also be visualized by DP microscopy (Fig. 1e). The recorded images of high intensity OPD objects appeared partially blurred because of the relatively high speed of the moving ER membranes along microtubules (~2 µm/s) and the slow acquisition time of the digital image of 16.4 s. After 20 min, when the ER network had evenly spread, we observed high contrast OPD objects with morphology similar to that of the ER visualized by fluorescence microscopy (Fig. 1f). The high contrast OPD objects were also observed in the presence of nocodazole after 90 min of extract incubation (data not shown). To place the scan lines for the dynamic measurements, areas with objects of high OPD contrast were identified by digital phase images (Fig. 2a), thereby increasing the probability that a chosen 2 µm long scan lines crossed the objects with high OPD contrast (Fig. 2c). This method proved especially useful in the early stages of ER network formation, when only few objects with high OPD contrast were detectable by DP microscopy.
Fig. 2. Sampling of OPD values of Xenopus egg extract preparations undergoing ER network formation by DP microscopy. a) Pseudo color digital phase image (6 × 8 µm or 96 × 128 pixel) where the scan line (2 µm or 32 pixel) was chosen at the area with highest OPD contrast. b) The track chart (16 s × 1.9 µm or 512 × 30 pixel) obtained by periodic scanning along the scan line shown on (a) at 32 ms for 16 s. c) OPD profile along the X-axis at the time point 10.5 s on the time-axis (P-1). d) OPD recording along the time-axis taken at X = 0.8 µm (P-2).
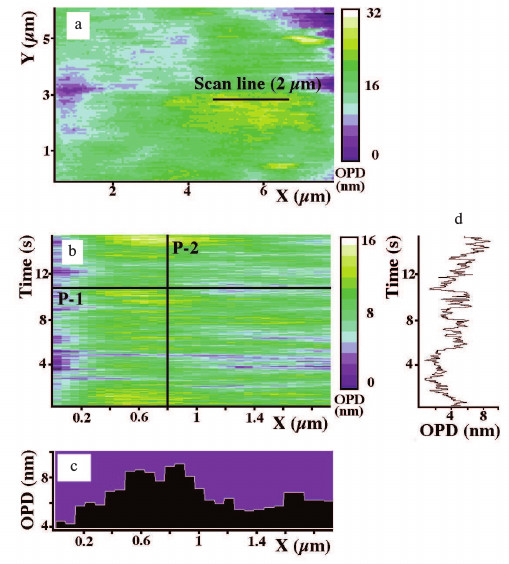
Characterization of dynamic aspects of egg extracts during ER network formation by DP microscopy. To characterize the dynamic aspects of the extract preparations during ER network formation, we measured the OPD fluctuations of high contrast objects in these preparations. OPD values were recorded by fast (30-35 ms) periodic scanning along the scan lines. As mentioned above, positioning of the scan lines (over high contrast objects) was determined by the digital phase images. Measurements were taken at 1 to 10 min intervals during network formation. Rapid periodic scanning yielded track charts as illustrated in Fig. 2b. The analysis of horizontal sections over the track charts provided OPD profiles, i.e. phase height profiles at a given time point along the scan line. These profiles revealed that the apparent size of different structures with high density varied from 200 to 1500 nm in diameter and from 4 to 50 nm in height. An example of a phase height profile along a 2 µm long scan line (P-1) is shown in Fig. 2c. The vertical section of the track chart (P-2) represents the OPD changes for one pixel over time (Fig. 2d). Despite the time-dependent changes in diameter and height of the structures, morphology and apparent size of these structures were very similar to those observed by VEC-DIC and fluorescence microscopy.
Spectral analysis of all such OPD recordings revealed that about 80% of the analyzed 2D spectral patterns contained regions of intense OPD fluctuation. Further analysis yielded spectral patterns with dominating frequency components within the range of 1.6-2.2 Hz. A typical 2D spectral pattern with an area of intense OPD fluctuation with a dominating frequency of about 1.9 Hz is shown in Fig. 3a. The Fourier spectrum taken at the center of the active area at X = 1 µm yielded a high contrast at 1.9 Hz with a small bandwidth (Fig. 3b). The lateral extension of the region of 1.9 Hz oscillations on the scan line coincided with the apparent diameter of a high spectral density structure (Fig. 3c). Occasionally, low-frequency components (<1 Hz) could also be distinguished (Fig. 3, a and b). However, the extent and spectral density of these low-frequency components were very variable and they were detectable in almost all extract preparations independently of incubation time. Therefore, only the regions of high density of 1.6-2.2 Hz signal, named 2-Hz component for convenience, were considered as the specific feature in interphase-arrested extract during ER network formation.
Fig. 3. Analysis of track charts. a) A typical 2D spectral pattern obtained by spectral analysis of the OPD recordings at each pixel along the X-axis of the track chart shown on Fig. 2b. The arrow indicates the area of enhanced fluctuation density and dominating frequency at 1.9 Hz. b) Fourier spectrum taken at the center of the area indicated in (a). The prominent peak of spectral density at 1.9 Hz can be seen. c) Profile of spectral density taken at 1.9 Hz along the X-axis of the 2D spectral pattern shown in (a). The width of the area with a dominating frequency at 1.9 Hz is about 0.5 µm.
ER network formation as a requirement for 2-Hz component of OPD oscillations. While it was not possible to identify the objects with OPD fluctuation by DP microscopy directly, the periodic fluctuations could nevertheless be attributed to the ER membrane system. To characterize the identity of the objects responsible for the 2-Hz component of OPD fluctuations, we incubated interphase-arrested extract under different conditions inhibiting or stimulating ER network formation.
When membranous organelles were solubilized by the adding 1% Triton X-100 to the extract, the microtubules still exhibited their typical gliding motion over the cover slip surface as observed by VEC-DIC microscopy (data not shown). However, under these conditions we detected neither ER movement nor ER network formation by VEC-DIC and fluorescence microscopy nor objects with high OPD contrast by DP microscopy. Only objects, most probably microtubules, with relatively low OPD contrast were observed, and the OPD fluctuations of these objects did not display any particular periodicity of oscillation. The 2-Hz component with high spectral density was absent (Fig. 4 and table). Thus, we concluded that membrane organelles appear to be involved in generating of the 2-Hz component with high spectral density rather than microtubules gliding over the cover slip surface.
Fig. 4. Effects of inhibitors of microtubule-dependent ER network formation on the 2-Hz component. Typical examples of Fourier spectra taken at the center of the 2-Hz component area after treatment of Xenopus egg extracts either without additions (control) (a) or with 1% Triton X-100 (b), with 50 µM nocodazole (c), with 5 U hexokinase and 15 mM glucose (d), 100 µM orthovanadate (e), or 0.5 mg/ml monoclonal antibody m74-2 against the dynein intermediate chain (f). All additions block the ER network formation and the appearance of the peak of high spectral density at frequency 1.6-2.2 Hz.
Effect of inhibitors and stimulator of microtubule-dependent ER network
formation on the spectral density of 2-Hz component
* All digital phase images were taken between 10 and 20 min after
initiation of microtubule-dependent ER network formation in
Xenopus egg extracts.
Because microtubules and microtubule-dependent motor dynein play a central role in the stimulation of ER network formation, their requirement for the process of ER network formation and the presence of 2-Hz component with high spectral density of membrane oscillation was tested. In extracts treated with nocodazole, microtubule assembly was blocked and the ER network formation, which normally occurs within 20 min of incubation, was inhibited. In the absence of microtubules the objects with high OPD contrast could still be observed, but a 2-Hz component with high spectral density was not present (Fig. 4 and table). The 2-Hz component was also absent when the function of microtubule-based motors was blocked either by ATP depletion, by treatment with 100 µM vanadate which blocks the ATPase activity, or by treatment with the dynein intermediate chain-specific monoclonal antibody m74-2 that disrupts the dynein–dynactin interaction (Fig. 4 and table). In contrast, when microtubule-dependent network formation was stimulated according to Allan [16] with okadaic acid, the spectral density of the 2-Hz component was increased more than 2-fold in comparison to untreated extracts (table). Taken together, our data demonstrated that the 2-Hz component of OPD fluctuations is associated with ER network formation.
The 2-Hz component as kinetic parameter for active periods of ER network formation. Because the periodic oscillations of ER in interphase-arrested extracts were detected only during the periods of ER network formation, we determined how the spectral density of the 2-Hz component changed with time. A typical profile of spectral density of the 2-Hz component during ER network formation in the presence of microtubules is shown in Fig. 5a. As expected, an increase of spectral density was observed after 5-7 min of extract incubation, which coincides with the initial stages of ER formation as confirmed by VEC-DIC and fluorescence microscopy. Within these 30 min the spectral density slightly changed as reflected by 1, 2, or 3 peaks between 5 and 35 min. At about 40 min the spectral density decreased dramatically despite of the presence of a fully developed ER network as observed by both VEC-DIC and fluorescence microscopy. An additional peak of spectral density was detected at 50 min, followed by a late period of enhancement of spectral density at 90-100 min of incubation (Fig. 5a).
Fig. 5. Time course of spectral density of the 2-Hz component during ER network formation. Spectral density of 2-Hz component is shown in the presence of microtubules (a), in the absence of microtubules after nocodazole treatment (b) and after ATP depletion with 5 U hexokinase and 15 mM glucose (c). Each time course is representative of three experiments.
After longer periods of extract incubation the ER network also formed in the absence of microtubules, e.g. during nocodazole treatment (Fig. 1c). Indeed, the high spectral density 2-Hz component remain absent during the first 60 min of extract incubation in the presence of nocodazole (Fig. 5b). A peak of high spectral density was first observed around 70 min when the ER network was first detectable by VEC-DIC and fluorescence microscopy. Elevated spectral density of the 2-Hz component lasted for only about 20 to 30 min, although the ER network remained stable as seen by both VEC-DIC and fluorescence microscopy. As in the presence of microtubules, the late period of enhancement of spectral density of 2-Hz component was also observed in nocodazole-treated extracts at 90-100 min (Fig. 5b).
Under ATP depletion conditions no 2-Hz component with increased the spectral density was detected during 120 min of extract incubation (Fig. 5c). Thus, we clearly confirmed the finding of Dreier and Rapoport [6] that both microtubule-dependent and microtubule-independent ER network formation as well as the 2-Hz component require ATP.
Based on these observations we conclude that the spectral density of the 2-Hz component reflects active stages during ER network formation and can be considered as a kinetic parameter of this process. Because several peaks of spectral density were observed, our data suggest that the complex process of ER network formation has several active and inactive phases.
DISCUSSION
Using the method of DP microscopy, we have studied the process of ER network formation in Xenopus egg extract. DP microscopy, which is based on direct OPD measurements, allowed us to detect fluctuations of the refractive index both near the glass surface and in bulk solution of the specimen [9-11]. Our data lead to the conclusion that the ER or components therein exhibit periodical changes of the refractive index at a frequency of 1.6-2.2 Hz (2-Hz component) during reticular network formation. These oscillations were strongly dependent on the presence of ATP but independent of the presence of the microtubules or the action of the ER-associated motor enzyme dynein.
The mechanism of the periodical ER oscillations remains unknown. However, OPD-oscillation seems to be a common feature of several membrane organelles from various animal cells. Submicron fluctuations of the plasma membrane in the frequency range of 0.2-40 Hz have been detected in cells, such as erythrocytes [17], lymphoid cell lines [18], fibroblasts, and cardiomyocytes [19]. In vitro experiments with erythrocyte ghost preparations have shown that cell membrane fluctuations in the frequency range of 0.3-5 Hz depended on ATP and could be attributed to the ATPase activity of actin filaments [20]. Furthermore, our previous studies indicate that mitochondria isolated from liver and heart also contain an oscillating component. In this case the spectral density of the 2.10-2.25-Hz component was strongly dependent on ATP [21]. In many cases the exact mechanism that generates these oscillations remains to be identified. In Xenopus egg extract the oscillation was found to be an intrinsic property of ER undergoing network formation. Therefore the network formation is requirement for the generation of the oscillation. However, presently the identification of a biological substrate or process responsible for the periodical ER is not possible because the mechanism of ER network formation without microtubules and actin filaments is still largely unknown.
In Xenopus egg extract the dominant 2-Hz component appears to be present during three phases of ER network formation. The early phase occurs about 10 min after incubating the egg extract and coincides with the microtubule- and dynein-dependent network formation. The second phase occurs about 1 h after incubating the extract and coincides with a microtubule- and actin filament-independent network formation. The third phase occurs about 1.5 h after incubating and its origin is unknown.
Several previous in vitro assays of Xenopus egg extracts indicated a direct role of microtubules in the ER network formation [3-5, 22]. Because these assays allowed only the observation of microtubules and membrane tubules close to the glass surface of a specimen, Dreier and Rapoport [6] suggested that only surface-attached microtubules stimulate ER network formation and have no effect on general ER network formation in the bulk of the solution. Indeed, when we reproduced the stimulatory presence of microtubules, both VEC-DIC/fluorescence microscopy and DP microscopy detected more rapid ER network formation. In the presence of microtubules the prominent peak of the 2-Hz component was measured in extracts much earlier (after 10 min of incubation at room temperature), while in the absence of microtubules it occurred only after 60 min. Microtubules did not change the frequency of the oscillating component in the ER. Therefore, we propose that microtubules and dynein activity have stimulatory effect on ER network formation without altering the basic membrane fusion mechanism responsible for ER network formation at the molecular level.
Measuring the long-term changes of spectral density of the 2-Hz component during both the microtubule-dependent and the microtubule-independent ER network formation resulted in an unexpected finding. Because the 2-Hz frequency appears to be generated by ER membrane tubules or by a component associated with the ER membranes, we expected that after ER network formation the spectral density of the 2-Hz component would reach a steady state at some high level. However, the spectral density declined after the ER network had been formed. Usually three major early peaks of spectral density of the 2-Hz component were detected in the presence of microtubules and two additional late peaks occurred both in the presence and in the absence of microtubules (Fig. 5). Therefore, we suggest that the enhancement of spectral density of the 2-Hz component is associated only with active stages of the ER network formation. The early waves during normal network formation are not observed in microtubule-deficient situations. ER does not always oscillate periodically, but only when it undergoes active stages during the process of network formation. Thus, the process of ER network formation appears to have several active phases. Since an ATP regenerating system was present we can exclude the possibility that these activity waves are due to fluctuations in ATP levels.
Both in presence and absence of microtubules we observed a peak of spectral density of 2-Hz component at 90-100 min. It is expected that the 90-100 min peak also reflects an active stage of ER network. Interestingly, under conditions used this peak appeared at about the same time as the transition of interphase extract to metaphase extract occurs in the presence of delta cyclin B (our unpublished data). Therefore, it will be very important to compare the dynamics of microtubule-dependent ER network formation with actin filament-dependent formation in metaphase-arrested extract. However, we cannot exclude the possibility that ER network formation has its own biological clock working independently but synchronously with the cell cycle as found for centrosome duplication [23].
Notably, the area of the peaks, i.e. the total activity of the spectral density of the 2-Hz component detected in the presence of microtubules, was equal to that in their absence, which indicates that the same ER membrane-associated process may be involved in both microtubule-dependent and microtubule-independent network formations. Furthermore, stimulation of ER network formation by activating signal cascades activates the amplitude of the 2-Hz oscillations in microtubule-dependent ER formation. The major 60-80 min peak of the 2-Hz component that was detected without microtubules was not observed with microtubules (Fig. 5). These data indicate that microtubules have a strong influence on the kinetics of ER network formation that can occur without microtubules. Therefore, we suggest that the two mechanisms, the microtubule-dependent and the microtubule-independent ones, have to cooperate with each other during ER network formation in vitro and in vivo. The influence of microtubules on ER network formation and membrane properties as well as the nature of the 2-Hz component need to be further elucidated. For the later one can propose that fluctuations of membrane potential connected with the activity of membrane ATPases generate periodic oscillations of ER.
We thank Dr. Walter Steffen for the antibody against dynein IC.
This work was supported by the German organization DAAD (German Academic Exchange Service).
REFERENCES
1.Terasaki, M., Chen, L. B., and Fujiwara, K. (1986)
Microtubules and the endoplasmic reticulum are highly interdependent
structures, J. Cell Biol., 103, 1557-1568.
2.Lee, C., and Chen, L. B. (1988) Dynamic behavior of
endoplasmic reticulum in living cells, Cell, 54,
37-46.
3.Allan, V., and Vale, R. (1991) Cell cycle control
of microtubule-based membrane transport and tubule formation in
vitro, J. Cell Biol., 113, 347-359.
4.Allan, V., and Vale, R. (1994) Movement of membrane
tubules along microtubules in vitro: evidence for specialized
sites of motor attachment, J. Cell Sci., 107,
1885-1897.
5.Steffen, W., Karki, S., Vaughan, K. T., Vallee, R.
B., Holzbaur, E. L. F., Weiss, D. G., and Kuznetsov, S. A. (1997) The
involvement of the intermediate chain of cytoplasmic dynein in binding
the motor complex to membranous organelle of Xenopus oocytes,
Mol. Biol. Cell, 8, 2077-2088.
6.Dreier, L., and Rapoport, T. A. (2000) In
vitro formation of the endoplasmic reticulum occurs independently
of microtubules by a controlled fusion reaction, J. Cell Biol.,
148, 883-898.
7.Wang, S., Romano, F. B., Field, C. M.,
Mitchison, T. J., and Rapoport, T. A. (2013) Multiple mechanisms
determine ER network morphology during the cell cycle in Xenopus
egg extracts, J. Cell Biol., 203, 801-814.
8.Wollert, T., Weiss, D. G., Gerdes, H.-H., and
Kuznetsov, S. A. (2002) Activation of myosin V-based motility and
F-actin-dependent network formation of endoplasmic reticulum during
mitosis, J. Cell Biol., 159, 571-577.
9.Tychinsky, V. P., Weiss, D. G., Vyshenskaya, T. V.,
Yaguzhinskii, L. S., and Nikandrov, S. L. (2000) Cooperative processes
in mitochondria: observation by dynamic phase microscopy,
Biophysics, 45, 844-851.
10.Tychinsky, V. P. (2001) Coherent phase microscopy
of intracellular processes, Physics-Uspekhi, 44,
649-662.
11.Weiss, D. G., Tychinsky, V. P., Steffen, W., and
Budde, A. (2001) Digital light microscopy techniques for the study of
living cytoplasm, in Image Analysis in Biology: Methods and
Application (Hader, D. P., ed.) CRC Press, Boca Raton, pp.
209-239.
12.Tychinsky, V. P., Kufal, G., Odintsov, A., and
Vyshenskaya, T. V. (1997) The measurements of submicrometer structures
with the Airyscan laser phase microscope, Quantum Electronics,
27, 735-739.
13.Allen, R. D., Allen, N. S., and Travis, J. L.
(1981) Video-enhanced contrast, differential interference contrast
(AVEC-DIC) microscopy: a new method capable of analyzing
microtubule-related motility in the reticulopodial network of
Allogromia laticollaris, Cell Motil. Cytoskel., 1,
291-302.
14.Allen, R. D., Weiss, D. G., Hayden, J., Brown, D.
T., Fujiwake, H., and Simpson, M. (1985) Gliding movement of
bidirectional transport along single native microtubules from squid
axoplasm: evidence for an active role of microtubules in cytoplasmic
transport, J. Cell Biol., 100, 1736-1752.
15.Weiss, D. G., Maile, W., Wick, R. A., and
Steffen, W. (1999) Video microscopy, in Light Microscopy in Biology.
A Practical Approach (Lacey, A. J., ed.) IRL Press, Oxford, pp.
73-149.
16.Allan, V. (1995) Protein phosphatase 1 regulates
the cytoplasmic dynein-driven formation of endoplasmic reticulum
networks in vitro, J. Cell Biol., 128,
879-891.
17.Levin, S., and Korenstein, R. (1991) Membrane
fluctuations in erythrocytes are linked to MgATP-dependent dynamic
assembly of the membrane skeleton, Biophys. J., 60,
733-737.
18.Mittelman, L., Levin, S., Verschueren, H., De
Baetselier, P., and Korenstein, R. (1994) Direct correlation between
cell membrane fluctuations, cell filterability and the metastatic
potential of lymphoid cell lines, Biochem. Biophys. Res.
Commun., 203, 899-906.
19.Krol, A. Y., Grinfeldt, M. G., Levin, S. V., and
Smilgavichus, A. D. (1990) Local mechanical oscillations of the cell
surface within the range 0.2-30 Hz, Eur. Biophys. J.,
19, 93-99.
20.Tuvia, S., Levin, S., Bitler, A., and Korenstein,
R. (1998) Mechanical fluctuations of the membrane-skeleton are
dependent on F-actin ATPase in human erythrocytes, J. Cell
Biol., 141, 1551-1561.
21.Vladimir, P., Tychinsky, V. P., and Tikhonov, A.
N. (2010) Interference microscopy in cell biophysics. 2. Visualization
of individual cells and energy-transducing organelles, Cell Biochem.
Biophys., 58, 117-128.
22.Waterman-Storer, C. M., Gregory, J., Parsons, S.
F., and Salmon, E. D. (1995) Membrane/microtubule tip attachment
complexes (TACs) allow the assembly dynamics of plus ends to push and
pull membranes into tubulovesicular networks in interphase
Xenopus egg extracts, J. Cell Biol., 130,
1161-1169.
23.Gard, D. L., Hafezi, S., Zhang, T., and Doxsey,
S. J. (1990) Centrosome duplication continues in cycloheximide-treated
Xenopus blastulae in the absence of a detectable cell cycle,
J. Cell Biol., 110, 2033-2042.